

The DOI matches its Crossref record; 75 of the 75 references it cites were found in a registry or an index.
Microbiota-Derived Metabolites Suppress Arthritis by Amplifying Aryl-Hydrocarbon Receptor Activation in Regulatory B Cells
Open accessAbstract
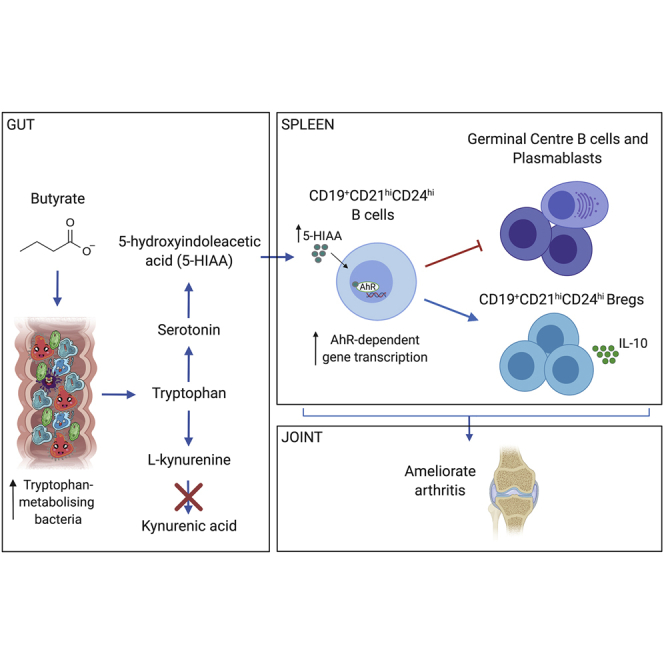
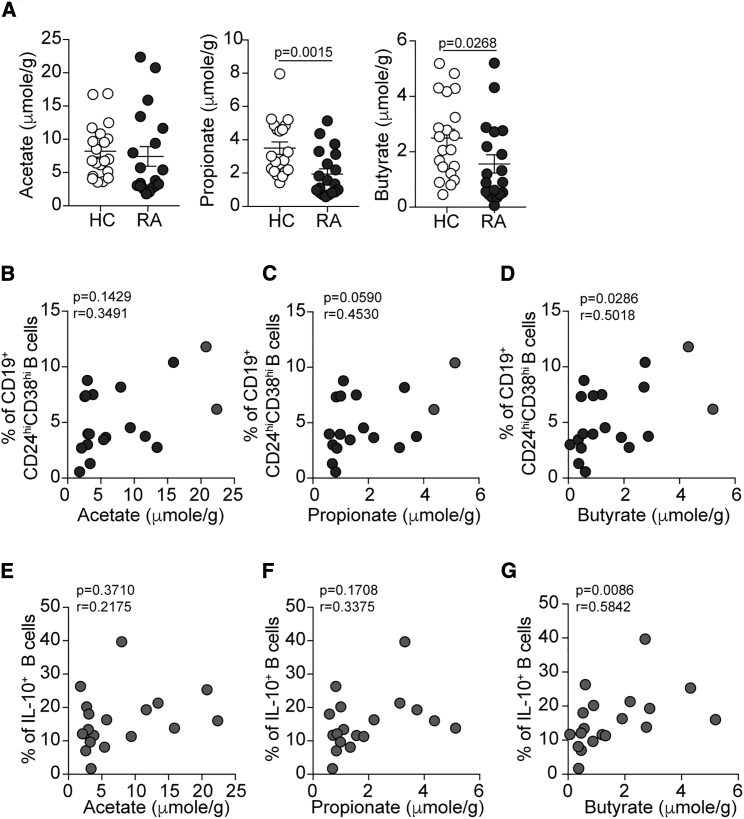
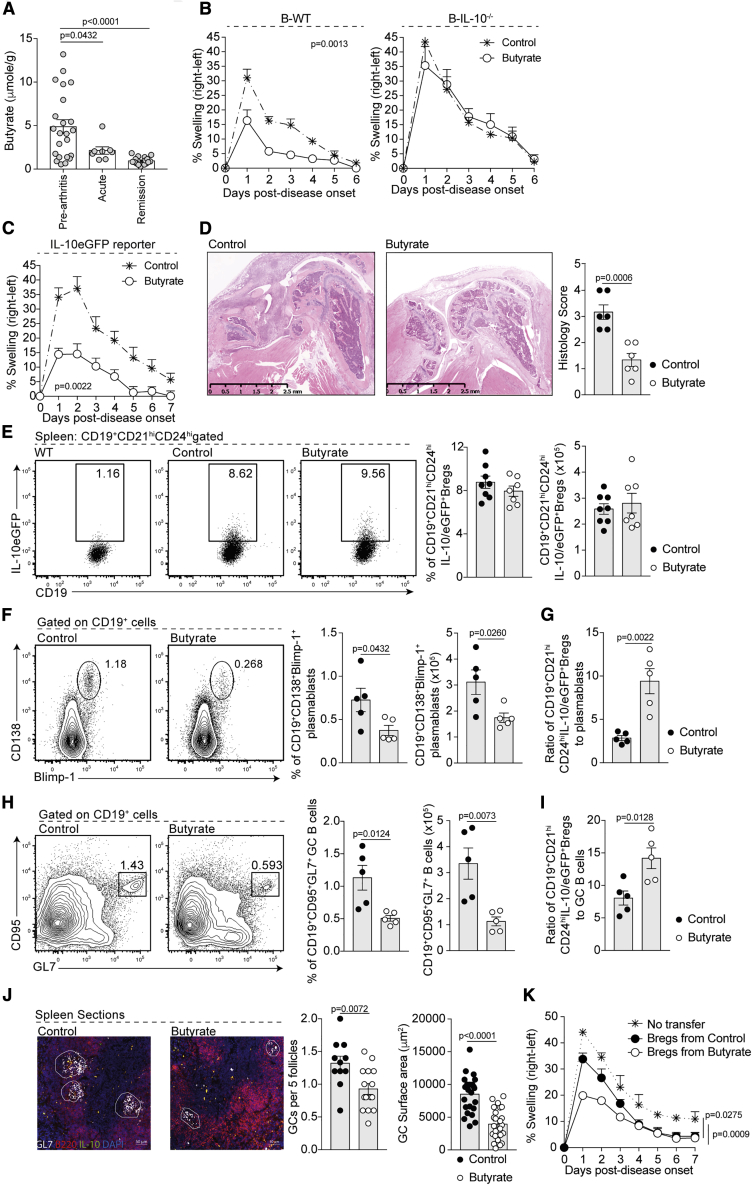
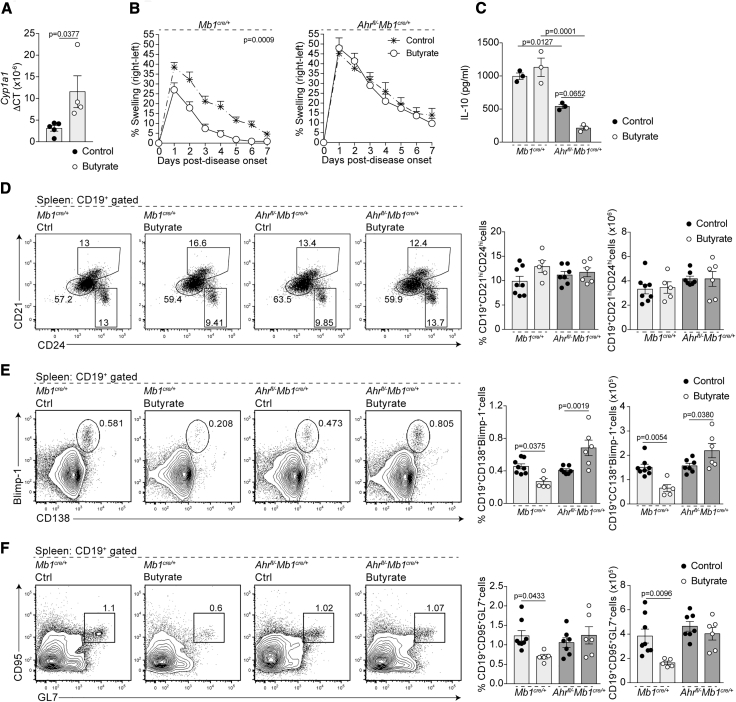
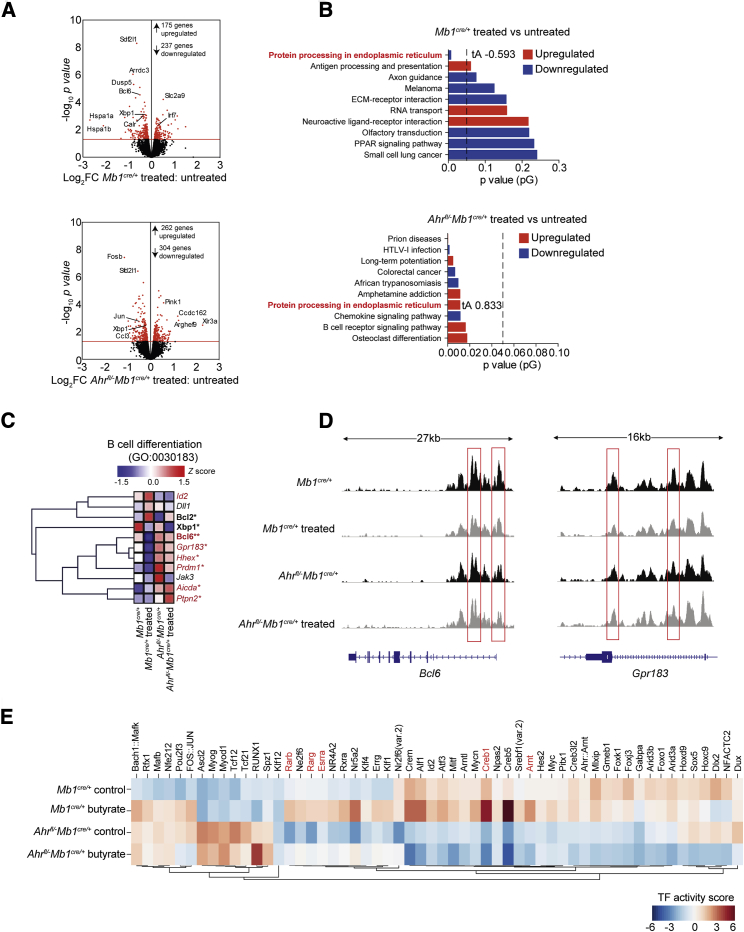
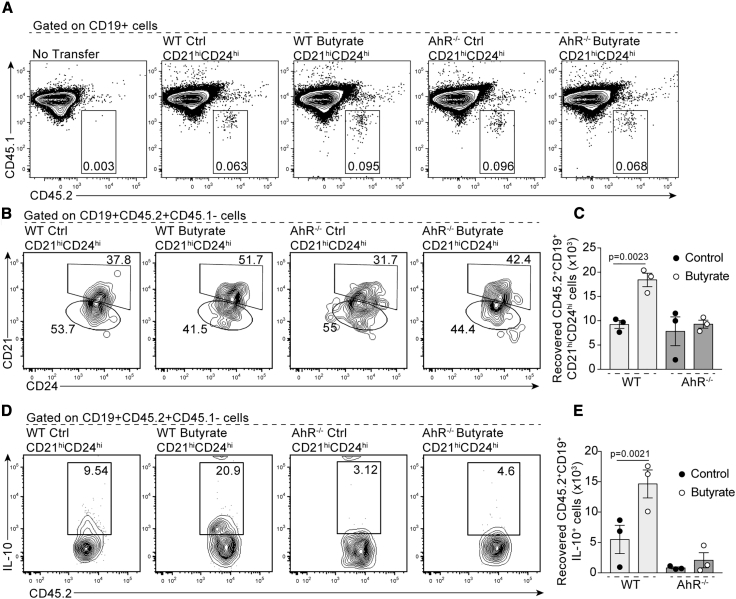
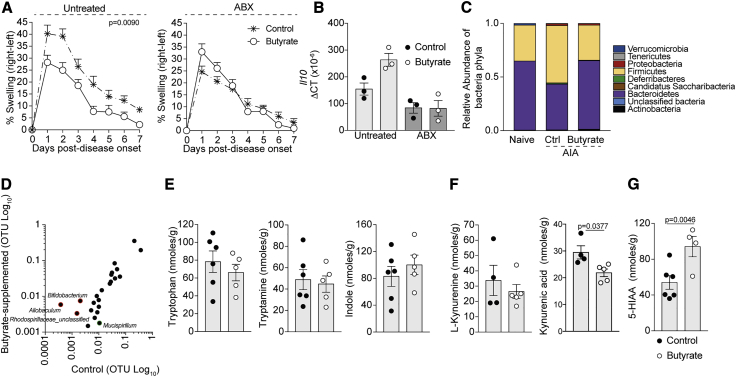
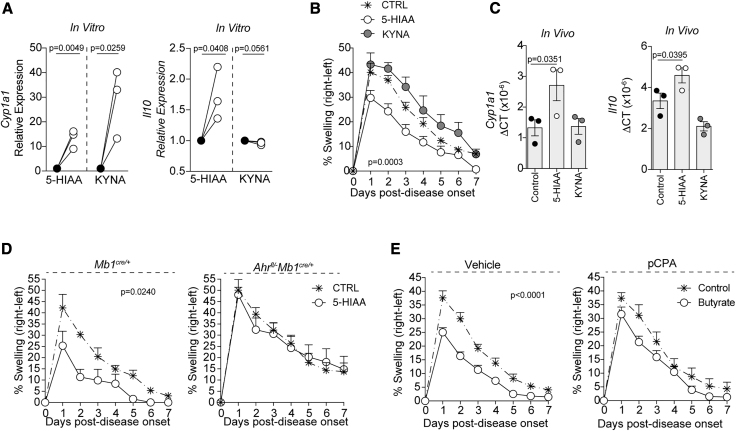
The differentiation of IL-10-producing regulatory B cells (Bregs) in response to gut-microbiota-derived signals supports the maintenance of tolerance. However, whether microbiota-derived metabolites can modulate Breg suppressive function remains unknown. Here, we demonstrate that rheumatoid arthritis (RA) patients and arthritic mice have a reduction in microbial-derived short-chain fatty acids (SCFAs) compared to healthy controls and that in mice, supplementation with the SCFA butyrate reduces arthritis severity. Butyrate supplementation suppresses arthritis in a Breg-dependent manner by increasing the level of the serotonin-derived metabolite 5-Hydroxyindole-3-acetic acid (5-HIAA), which activates the aryl-hydrocarbon receptor (AhR), a newly discovered transcriptional marker for Breg function. Thus, butyrate supplementation via AhR activation controls a molecular program that supports Breg function while inhibiting germinal center (GC) B cell and plasmablast differentiation. Our study demonstrates that butyrate supplementation may serve as a viable therapy for the amelioration of systemic autoimmune disorders.
Overview
The claims and statistics of this paper haven’t been checked yet.
Run the check — free, no account needed. It reads the open-access text and checks the sources it cites.
Integrity signals
Registry
Cites
Statistics
Figures
Verification
Claims the paper makes
The claims and statistics of this paper haven’t been checked yet.
Run the check — free, no account needed. It reads the open-access text and checks the sources it cites.
Claims other papers make about this one
Each is checked against this paper’s own text: does it say what the citing paper says it does?
In the citing paper
“For instance, butyrate has been shown to restrict inflammation by promoting the differentiation of Treg cells and supporting the functions of regulatory B cells.706–708”
From Microbiota–gut–brain axis and its therapeutic applications in neurodegenerative diseases (2024) · cites this paper as [706]
Self-check
Percentages, sums and reported differences re-computed from the paper’s own numbers.
The self-check needs the paper’s full text.
Citations
Cites
STAR: ultrafast universal RNA-seq aligner
Dobin, A., Davis, C. A., Schlesinger, F., Drenkow, J., Zaleski, C., Jha, S., Batut, P., Chaisson, M., & Gingeras, T. R. (2013) · Bioinformatics · doi:10.1093/bioinformatics/bts635 · Cited by 51,709
Robinson, M. D., McCarthy, D. J., & Smyth, G. K. (2010) · Bioinformatics · doi:10.1093/bioinformatics/btp616 · Cited by 41,364
limma powers differential expression analyses for RNA-sequencing and microarray studies
Ritchie, M. E., Phipson, B., Wu, D., Hu, Y., Law, C. W., Shi, W., & Smyth, G. K. (2015) · Nucleic Acids Research · doi:10.1093/nar/gkv007 · Cited by 40,458
The SILVA ribosomal RNA gene database project: improved data processing and web-based tools
Quast, C., Pruesse, E., Yilmaz, P., Gerken, J., Schweer, T., Yarza, P., Peplies, J., & Glöckner, F. O. (2012) · Nucleic Acids Research · doi:10.1093/nar/gks1219 · Cited by 33,055
HTSeq—a Python framework to work with high-throughput sequencing data
Anders, S., Pyl, P. T., & Huber, W. (2015) · Bioinformatics · doi:10.1093/bioinformatics/btu638 · Cited by 21,464
Schloss, P. D., Westcott, S. L., Ryabin, T., Hall, J. R., Hartmann, M., Hollister, E. B., Lesniewski, R. A., Oakley, B. B., Parks, D. H., Robinson, C. J., et al. (2009) · Applied and Environmental Microbiology · doi:10.1128/aem.01541-09 · Cited by 19,549
Model-based Analysis of ChIP-Seq (MACS)
Zhang, Y., Liu, T., Meyer, C. A., Eeckhoute, J., Johnson, D. S., Bernstein, B. E., Nusbaum, C., Myers, R. M., Brown, M., Li, W., et al. (2008) · Genome Biology · doi:10.1186/gb-2008-9-9-r137 · Cited by 18,386
VSEARCH: a versatile open source tool for metagenomics
(2016) · doi:10.7717/peerj.2584 · Cited by 10,773
Near-optimal probabilistic RNA-seq quantification
Bray, N. L., Pimentel, H., Melsted, P., & Pachter, L. (2016) · Nature Biotechnology · doi:10.1038/nbt.3519 · Cited by 9,723
KEGG as a reference resource for gene and protein annotation
Kanehisa, M., Sato, Y., Kawashima, M., Furumichi, M., & Tanabe, M. (2016) · Nucleic Acids Research · doi:10.1093/nar/gkv1070 · Cited by 7,387
Cited by
Sorted by citations
Items 501–581 of 581
Wan, M., Han, J., Rao, M., Hu, F., & Gao, P. (2022) · SSRN Electronic Journal · doi:10.2139/ssrn.4016460
Editorial: The microbial modulation of autoimmune processes and proinflammatory pathways
Rahal, E. A., Shirinian, M., & Dessì, D. (2022) · Frontiers in Cellular and Infection Microbiology · doi:10.3389/fcimb.2022.969610
Du, W., Yin, S., Zhou, Y., Hou, R., Lv, Z., Li, J., Li, L., Qi, N., & Ye, B. (2022) · SSRN Electronic Journal · doi:10.2139/ssrn.4063235
The Gut Microbiota and Its Metabolites Contribute to Ageing and Ageing-Related Diseases
Chen, C., Cao, Z., Lei, H., & Zhang, L. (2023) · Healthy ageing and longevity · doi:10.1007/978-3-031-14023-5_1
He, X., Mi, L., Ji, Y., Zhao, M., Hu, Y., Gao, Y., Qiu, L., & Xu, K. (2023) · Research Square · doi:10.21203/rs.3.rs-2971839/v1
Veland, N., Gleneadie, H. J., Brown, K. E., Sardini, A., Pombo, J., Dimond, A., Burns, V., Sarkisyan, K. S., Schiering, C., Webster, Z., et al. (2023) · bioRxiv (Cold Spring Harbor Laboratory) · doi:10.1101/2023.05.30.542862
廖, 明. (2023) · Pharmacy Information · doi:10.12677/pi.2023.123032
Patry, R. T., & Nagler‐Anderson, C. (2023) · Elsevier eBooks · doi:10.1016/b978-0-323-96018-2.00065-1
Regulatorische B-Zellen – immunpathologisches und prognostisches Potenzial beim Menschen
Veh, J., Ludwig, C., Schrezenmeier, H., & Jahrsdörfer, B. (2023) · Transfusionsmedizin · doi:10.1055/a-2010-5218
“00961 [71] Rosser EC, Piper CJM, Matei DE et al.”
BackgroundCellular lipids in B cell immunity, inflammation, and cancer
Zhang, Y., Ntambi, J. M., & Fang, D. (2023) · Elsevier eBooks · doi:10.1016/b978-0-323-95582-9.00004-8
Maternal obesity shapes the B lymphocyte and antibody repertoires of human colostrumPreprint
Sánchez-Salguero, E. S., Bonilla, D., Alcorta-García, M. R., Díaz, V. J. L., López-Villaseñor, C. N., & Brunck, M. E. G. (2023) · medRxiv · doi:10.1101/2023.09.01.23294956
The osteoprotective effect of melittin acupoint injection on CIA mice based on the gut-joint axisPreprint
Chen, F., Liu, F., Zhong, G., Xi, W., Gao, S., Lai, M., He, Q., Zhang, J., Yang, L., Chen, Y., et al. (2023) · Research Square · doi:10.21203/rs.3.rs-3323658/v1
Sun, S., Wang, D., Dong, D., Xu, L., Xie, M., Wang, Y., Ni, T., Jiang, W., Zhu, X., Ning, N., et al. (2023) · Figshare · doi:10.6084/m9.figshare.22623866
Zhang, B., Lu, C., Dou, B., Qi, Y., Zhaxi, D., Wei, S., Luo, X., Gu, W., & Li, K. (2024) · Research Square · doi:10.21203/rs.3.rs-4672521/v1
Gut microbiota and rheumatic diseases: new insights into pathogenesis
Pażyra, A., Nowakowska, K., Więsyk, P. J., & Oklecińska, Ł. (2024) · Quality in Sport · doi:10.12775/qs.2024.18.53972 · Cited by 1
“Additionally, butyric acid has been shown to inhibit the production of autoantibodies, probably by inhibiting the differentiation of B cells in the embryonic centre via follicular helper T cells (Tfh) [35].”
BackgroundBajaj, S., Rathee, S., & Patil, U. K. (2024) · Current Bioactive Compounds · doi:10.2174/0115734072317179240919081449
Budzinski, L., Chang, H., & Kallinich, T. (2024) · Arthritis und Rheuma · doi:10.1055/a-2435-6449
Zhou, Y.-S., Gao, W. H., Huang, Y., Xia, X., Li, X., Deng, Y., Peng, Q., & Peng, J. (2024) · Digital Chinese Medicine · doi:10.1016/j.dcmed.2025.01.006
Zheng, X., Ke, X., Gao, J., Zheng, Z., & Zhu, P. (2025) · Clinical Rheumatology · doi:10.1007/s10067-025-07482-0
“The activation of AhR is believed to enhance the metabolic support for Breg cell function while concurrently suppressing the differentiation of germinal center (GC) B cells and plasmablasts [39–41].”
Alexiou, V., Matei, D. E., & Rosser, E. C. (2025) · Elsevier eBooks · doi:10.1016/b978-0-12-824465-4.00233-7
Self-citationPatry, R. T., & Nagler‐Anderson, C. (2024) · Elsevier eBooks · doi:10.1016/b978-0-323-95488-4.50034-5
Toxicological evaluation of fatty acids
Mushtaq, A., Gohar, U. F., Shah, H. S., & Zia-Ul-Haq, M. (2025) · Elsevier eBooks · doi:10.1016/b978-0-443-33296-8.00012-5
Yang, Y., Liang, H., Bian, Y., Liu, S., Wang, B., Gong, Z., Lin, L., & Xiao, W. (2025) · Food Frontiers · doi:10.1002/fft2.70196
Sun, S., Wang, D., Dong, D., Xu, L., Xie, M., Wang, Y., Ni, T., Jiang, W., Zhu, X., Ning, N., et al. (2023) · Figshare · doi:10.6084/m9.figshare.22623872
Sun, S., Wang, D., Dong, D., Xu, L., Xie, M., Wang, Y., Ni, T., Jiang, W., Zhu, X., Ning, N., et al. (2023) · Figshare · doi:10.6084/m9.figshare.22623899
Sun, S., Wang, D., Dong, D., Xu, L., Xie, M., Wang, Y., Ni, T., Jiang, W., Zhu, X., Ning, N., et al. (2023) · Figshare · doi:10.6084/m9.figshare.22623878
Sun, S., Wang, D., Dong, D., Xu, L., Xie, M., Wang, Y., Ni, T., Jiang, W., Zhu, X., Ning, N., et al. (2023) · Figshare · doi:10.6084/m9.figshare.22623863
Sun, S., Wang, D., Dong, D., Xu, L., Xie, M., Wang, Y., Ni, T., Jiang, W., Zhu, X., Ning, N., et al. (2023) · Figshare · doi:10.6084/m9.figshare.22623890
Sun, S., Wang, D., Dong, D., Xu, L., Xie, M., Wang, Y., Ni, T., Jiang, W., Zhu, X., Ning, N., et al. (2023) · Figshare · doi:10.6084/m9.figshare.22623887
Xu, H., Zhang, Y., Zhang, Y., Shen, C., Zhang, Z., Wang, J., Zhou, D., Wu, Z., Qie, Y., Liu, S., et al. (2024) · Figshare · doi:10.6084/m9.figshare.26737479
Sun, S., Wang, D., Dong, D., Xu, L., Xie, M., Wang, Y., Ni, T., Jiang, W., Zhu, X., Ning, N., et al. (2023) · Figshare · doi:10.6084/m9.figshare.22623881
Sun, S., Wang, D., Dong, D., Xu, L., Xie, M., Wang, Y., Ni, T., Jiang, W., Zhu, X., Ning, N., et al. (2023) · Figshare · doi:10.6084/m9.figshare.22623896
Sun, S., Wang, D., Dong, D., Xu, L., Xie, M., Wang, Y., Ni, T., Jiang, W., Zhu, X., Ning, N., et al. (2023) · Figshare · doi:10.6084/m9.figshare.22623875
Sun, S., Wang, D., Dong, D., Xu, L., Xie, M., Wang, Y., Ni, T., Jiang, W., Zhu, X., Ning, N., et al. (2023) · Figshare · doi:10.6084/m9.figshare.22623893
Interactions of vitamins and gut microbiota in neurodevelopmental disorders
Liu, L., Gu, Z., Guo, B., Wang, Y., Kirichenko, T. V., Markina, Y. V., Markin, A. M., Hua, H., Li, D., & Woo, A. Y. (2026) · Behavioural Brain Research · doi:10.1016/j.bbr.2026.116028
Zhao, M., Wu, F., Feng, S., Li, C., Liu, S., Chen, S., Liu, Y., Chen, B., Zhang, G., & Han, S. (2026) · Poultry Science · doi:10.1016/j.psj.2026.106427
“The immunomodulatory and anti-inflammatory properties of 5-HIAA stem from its activation of the aryl hydrocarbon receptor ( AhR ), which in turn drives IL-10 upregulation and modulates the Treg/Th17 balance (Rosser, et al., 2020; Zhong, et al., 2024).”
Toyoshi, E., Watanabe, M., Namai, F., Yamane, K., Kashima, T., Ikeda‐Ohtsubo, W., Agista, A. Z., Yoshida, A., Sakuma, T., Fukuda, I., et al. (2026) · Journal of Animal Science and Biotechnology/Journal of animal science and biotechnology · doi:10.1186/s40104-026-01364-4
“Although KyA and PPA activate AhR in humans [51, 52, 66], neither induced CYP1A1 expression in SIECs, suggesting species-specific differences in ligand recognition, supported by structural modelling of porcine AhR (Fig.”
Tan, W., Fu, Y., Hu, W., Lin, Y., Cai, J., Huang, X., OuYang, Y., Lin, S., & Ye, L. (2026) · Phytotherapy Research · doi:10.1002/ptr.70316
“In addition to microbiota-mediated effects, LA directly binds the AhR and induces IL-10 production, complementing existing evidence that AhR activation mitigates arthritis by modulating T cell and macrophage responses (Laragione et al. 2023; Rosser et al. 2020).”
Huang, Z., Ren, J., Shu, Q., Tang, Y., Zhang, J., Yu, W., Zhang, C., Pang, Y., Liu, L., Han, J., et al. (2026) · Biology · doi:10.3390/biology15070558
“Specifically, microbial AhR ligands have been shown to suppress arthritis by amplifying AhR activation in regulatory B cells, a mechanism that may need boosting during estrogen peaks [209].”
Dialogue entre le microbiote intestinal et l'hôte via le métabolisme du L-tryptophane
Modoux, M. (2022) · theses.fr (ABES) · doi:10.70675/e7e50c6bz7d58z452fzb065z884298a05c4a
Multi-omics integration and systems immunology application in rheumatology
Binvignat, M. (2024) · theses.fr (ABES) · doi:10.70675/b0d00dc7zeee1z4078zbeabz41e8b13cc551
Lap, C. R., van Houten, M., Bogaert, D., & Biesbroek, G. (2026) · Frontiers in Immunology · doi:10.3389/fimmu.2026.1794596
“Among the bacterial species negatively associated with post-COVID, those that favor butyrate production are of particular interest, potentially offering therapeutic avenues, due to butyrate ’ s immunoregulatory roles (199, 209).”
Ding, X., Zhao, H., Ma, Y., Zhao, Y., Zheng, M., Chen, X., Jin, L., Du, T., Jiang, Y., & Zhao, X. (2026) · Medicine · doi:10.1097/md.0000000000048225
“[87] And these immune cells also play an important regulatory role in pregnancy maintenance.”
A stromal platform for robust expansion of functional IL-10–producing B cells for immune regulation
Kawakami, R., Imabayashi, K., Baba, A., Saito, Y., Kawata, K., Yada, Y., Shibata, A., Ito, R., Kurasawa, R., Higuchi, R., et al. (2026) · JCI Insight · doi:10.1172/jci.insight.197393
Qi, S., Xing, Q., Gong, X., Jiang, Y., Zhao, Z., Feng, Z., Jiao, S., Wang, C., li, S., & Li, H. (2026) · Frontiers in Pharmacology · doi:10.3389/fphar.2026.1783503
Gut microbiota in chronic inflammation: the interplay with lipid mediators
Bao, S., & Yao, C. (2026) · Gut Microbes · doi:10.1080/19490976.2026.2667605 · Cited by 1
“SCFAs attenuate disease severity in HLA-B27 and β2-microglobulin transgenic models and in experimental arthritis, 233,234 increase bone volume, and suppress osteoclastogenesis in K/BxN and collagen-induced arthritis models.”
Metabolic Reprogramming of B Cells in Cancer: Effects of Altered Energetics
Sarkar, U. A., Ambareen, N., Prasad, P., Kamran, M., & Ghosh, S. (2026) · Biology · doi:10.3390/biology15100744
“However, cancer cells are mainly consumers of SCFAs, which are physiologically produced by certain microbial fauna [78,81].”
Arthritis-Associated Inflammation Remodels Colonic O-GlycosylationPreprint
Pan, P., Yan, Y., Antonopoulos, A., Haslam, S. M., Dell, A., Cheng, L., Samavedam, S. S., Harnett, M. M., Milling, S. W. F., & Pineda, M. A. (2026) · bioRxiv (Cold Spring Harbor Laboratory) · doi:10.64898/2026.05.20.726588
Su, Z., Huang, Z., Huang, Y. Q., Guo, J., Wang, Q., Xu, S., Kang, Y., Wang, Z., Shi, Y., & Jia, B. (2026) · Pharmacological Research · doi:10.1016/j.phrs.2026.108318 · Cited by 1
Piper, C. J. M., Metcalfe, C., Layeghi, M., Montamat, G., Baig, Z., Ferrier, A., Nitschke, L., Catalán, D., & Mauri, C. (2026) · bioRxiv (Cold Spring Harbor Laboratory) · doi:10.64898/2026.06.24.734204
“Flow cytometry was performed as previously described 42, 43 .”
Self-citationAcetate ameliorates membranous nephropathy by modulating the immune response and podocyte function
Liu, J., Cui, Y.-Y., Zheng, K., Jia, X., Cui, Z., & Zhao, M.-H. (2026) · BMC Nephrology · doi:10.1186/s12882-026-05175-7
“SCFA suppresses arthritis by raising 5-HIAA (serotonin metabolite) to activate AhR (a Breg marker), thereby supporting Breg function while inhibiting GC B cells and plasmablast differentiation [29].”
Lee, S. T., Kim, H. E., Kim, S.-Y., Lee, J. Y., Nam, K., Kim, S.-H., Park, J., & Choi, J. K. (2026) · Journal of Allergy and Clinical Immunology · doi:10.1016/j.jaci.2026.06.015
Gu, J., Wang, Y., Zhu, H., Deng, X., Fang, W., Liu, M., & Xia, B. (2026) · Food Frontiers · doi:10.1002/fft2.70313
Iheanacho, G. C., Udoka, A. N. S., Klotz, J. L., & Duckett, S. K. (2026) · Muscles · doi:10.3390/muscles5030052
“This shows that there was a breakdown of 5-HTP after supplementation, and the conversion of serotonin to 5-HIAA can be prompted by the metabolites in the gut microbiome [33,34].”
Beyond antibodies: Emerging roles of B cells in gastrointestinal inflammation and disease
Fujishima, M. C., Ouyang, J., Murooka, T. T., & Santer, D. M. (2026) · Mucosal Immunology · doi:10.1016/j.mucimm.2026.100390
Gut-reproduction axis: a new perspective on understanding pelvic inflammatory disease
Ma, S., Wang, M., Tan, X., Shen, C., Tao, X.-R., Sheng, M.-J., Zhang, X.-Y., Xu, Y., & Zheng, L.-W. (2026) · Frontiers in Microbiology · doi:10.3389/fmicb.2026.1822640
“…derived from GM maintain the function of immune cells, enhance the body’s resistance to pathogenic microorganisms, form the GM-immune system axis (Rosser et al., 2020), stimulate the activity of B cells, secrete immunoglobulin IgA, bind with bacteria to form immune complexes, which are…”
Cai, W., Yang, D., Li, H., Zhang, C., Che, H., & Li, H. (2026) · Food Bioscience · doi:10.1016/j.fbio.2026.109728
Cai, T., Tamanini, I., Odorizzi, K., Ceccato, T., Botti, S., Gallelli, L., Mazzoli, S., Palmieri, A., & Johansen, T. E. B. (2026) · Urologia Journal · doi:10.1177/03915603261476871
“25,26 A lower butyric acid level in our patients’ group might be the missing link to the increased levels of IL found in seminal plasma.”
Indole derivatives intervene osteoporosis via gut-bone axis
Wang, W. (2026) · Frontiers in Cellular and Infection Microbiology · doi:10.3389/fcimb.2026.1845772
“Furthermore, microbial-derived indole derivatives have been shown to be involved in suppressing arthritis by activating AHR in regulatory B cells (Rosser et al., 2020), suggesting a potential mechanistic link between gut microbial indole derivatives, B cell function, and skeletal pathology.”
Bi, Y., Song, W., Glymenaki, M., Hu, J., Li, X., Huang, H., Peng, Y., Ni, S., Haonon, O., Liu, Z., et al. (2026) · iMeta · doi:10.1002/imt2.70144 · Cited by 1
Wang, J., Zhang, D., Hu, S., Guo, H., Zou, L., Wang, N., Xie, J., Wang, Z., Hao, M., Da, Y., et al. (2026) · Diabetes Research and Clinical Practice · doi:10.1016/j.diabres.2026.113510
Zhou, J., Gao, Y., Hong, H., Tang, L., Zhai, Y., Wang, M., & Xie, Z. (2026) · Chinese Herbal Medicines · doi:10.1016/j.chmed.2026.09.002
Zou, Z., Liu, H., Hu, Y., Ge, X., Zhang, J., & Li, X. (2026) · Frontiers in Microbiology · doi:10.3389/fmicb.2026.1923929
“…kynurenine and serotonin pathways, gut microorganisms convert dietary tryptophan into a variety of bioactive indole derivatives, including indole-3-acetic acid (IAA), indole-3-propionic acid (IPA), indole-3-aldehyde (IAld), and indole-3-lactic acid (ILA) (Zelante et al., 2013; Rosser et al., 2020).”
Pharrat, R., Zhao, X., Wu, Z., Bei, C., & Yu, Y. (2026) · Scientific Data · doi:10.1038/s41597-026-08196-x
Su, S., Hu, Z., Min, H., Gao, C., Wang, Y., & Tian, L. (2026) · International Immunopharmacology · doi:10.1016/j.intimp.2026.117377
柴志波, Wang, M., Zheng, J., & Yu, J. (2026) · Frontiers in Pharmacology · doi:10.3389/fphar.2026.1939732
“Some tryptophan metabolites enhance regulatory immunity, whereas indole can promote Th17 responses, pathogenic autoantibodies, and collagen-induced arthritis (Rosser et al., 2020; Seymour et al., 2023).”
Cuc, B. T., Tong, Y., Wu, Z., Álvarez-Simón, D., & Fillatreau, S. (2026) · Immunological Reviews · doi:10.1111/imr.70180 · Cited by 1
Qi, P., & Xie, X. (2026) · Cytokine & Growth Factor Reviews · doi:10.1016/j.cytogfr.2026.101531
Yazicioglu, Y. F., Bantug, G. R., Hess, C., & Clarke, A. J. (2026) · Nature reviews. Immunology · doi:10.1038/s41577-026-01355-6
Zhang, C., Chen, Q., Sun, Z., Wu, T., Zhang, Y., Huang, B., Huang, S., Zhang, Y., & Han, M. (2026) · Frontiers in Immunology · doi:10.3389/fimmu.2026.1828110
Bilski, J., Schramm‐Luc, A., Szczepanik, M., Pierzchalski, P., & Luc, K. (2026) · Frontiers in Immunology · doi:10.3389/fimmu.2026.1936364
Su, X., Li, X., Bian, Y., Li, L., Ren, Q., Liu, J., Luan, H., 李海天, Wu, X., Cheng, X., et al. (2026) · The Innovation Medicine · doi:10.59717/j.xinn-med.2026.100265 · Cited by 4
Gut Microbiota-Induced Metabolic Reprogramming of the Host Immune System
Roy, S. (2026) · Springer eBooks · doi:10.1007/978-3-032-30306-6_7
The Emerging Role of Butyrate in Immune Tolerance
Zhang, J., Shen, S., Cao, J., Li, Y., Tong, B., Shi, Y., Zhou, Y.-N., & Qi, X. (2026) · Journal of Immunology Research · doi:10.1155/jimr/6636669
“These microbial alterations reshaped the pro fi le of tryptophan-derived metabolites, with a marked increase in 5-hydroxyindoleacetic acid (5-HIAA), the major metabolite of serotonin [79].”
InfluentialZiqiang, Y., Yao, W., Zhang, G., Shao, M., Yang, S., & Hexi, D. (2026) · Natural Product Communications · doi:10.1177/1934578x261471961
Piątek, D., Sokal-Dembowska, A., Strycharz-Dudziak, M., & Jarmakiewicz-Czaja, S. (2026) · International Journal of Molecular Sciences · doi:10.3390/ijms27219710
Metadata
- Authors
- Rosser, E. C., Piper, C. J. M., Matei, D. E., Blair, P. A., Rendeiro, A. F., Orford, M., Alber, D. G., Krausgruber, T., Catalan, D., Klein, N., Manson, J. J., Drozdov, I., Bock, C., Wedderburn, L. R., Eaton, S., & Mauri, C.
- Affiliations
- Great Ormond Street Hospital (GB)
- University College London (GB)
- Austrian Academy of Sciences (AT)
- University College Hospital (GB)
- Corresponding author
- Rosser, Elizabeth C.
- Mauri, Claudia
- ORCID
- Venue
- Cell Metabolism
- Publisher
- Elsevier BV
- Published
- 2020-04
- Volume
- 31
- Issue
- 4
- Pages
- 837-851.e10
- ISSN
- 1550-4131 (ISSN-L)
- PMC
- PMC7156916
- OpenAlex
- W3013317600
- Cited by
- 579
- References
- 75
- Citations by year
- 2026: 73 · 2025: 103 · 2024: 112 · 2023: 104 · 2022: 88 · 2021: 70 · 2020: 27
- FWCI
- 23.50
- Type
- journal article
- Language
- en
- Open access
- hybrid
- doi.org
- Licence
- Locations
- Cell Metabolism (publishedVersion, cc-by)
- PubMed Central (publishedVersion, cc-by)
- PubMed (publishedVersion)
- UCL Discovery (University College London) (submittedVersion)
- MPG.PuRe (Max Planck Society) (submittedVersion)
- Universidad de Chile (submittedVersion, cc-by-nc-nd)
- Funders
- Weizmann Institute of Science
- Albert-Ludwigs-Universität Freiburg
- Bill and Melinda Gates Foundation
- Versus Arthritis (21140, 21141, 21593)
- Manchester Biomedical Research Centre
- Rosetrees Trust (M536)
- NIHR Bristol Biomedical Research Centre
- Topics
- Life Sciences › Biochemistry, Genetics and Molecular Biology › Molecular Biology › Gut microbiota and health
- Life Sciences › Immunology and Microbiology › Immunology › T-cell and B-cell Immunology
- Health Sciences › Medicine › Rheumatology › Rheumatoid Arthritis Research and Therapies
- Keywords
- rheumatoid arthritis, regulatory B cells, gut microbiota, short-chain fatty acids, butyrate, aryl hydrocarbon receptor, 5-hydroxyindoleacetic acid, serotonin metabolism, germinal center B cells, plasmablast differentiation, IL-10, autoimmune disease therapy, dietary supplementation
- MeSH terms
- Gastrointestinal Microbiome, Animals, Arthritis, Rheumatoid, Butyrates, Cells, Cultured, Fatty Acids, Volatile, Female, Humans, Hydroxyindoleacetic Acid, Male, Mice, Inbred C57BL, Middle Aged, Receptors, Aryl Hydrocarbon, Mice, Basic Helix-Loop-Helix Proteins, B-Lymphocytes, Regulatory
About these checks
Registry, retraction, Cites and statistics results are computed, not judged, with one exception: a printed reference that no index lists is read once by a model before it counts as a citation error. Claims are extracted by a model and kept only when their quote appears verbatim in the text; each cited source is then checked, with a model’s help, for whether it says what the claim relies on. Those verdicts can be wrong — read the claim’s quote and the cited source before relying on one.
Statistics and arithmetic are recomputed, not judged.
Confidence bands are shown only for fields calibrated on our annotated test set. None is calibrated yet, so no band is shown.
What counts as a claim ›How we measure confidence ›How we check this ›
Are you an author, or do you see a problem with this page? Request a review
