

The DOI matches its Crossref record; 71 of the 71 references it cites were found in a registry or an index.
Warburg-like metabolic transformation underlies neuronal degeneration in sporadic Alzheimer’s disease
Open accessAbstract
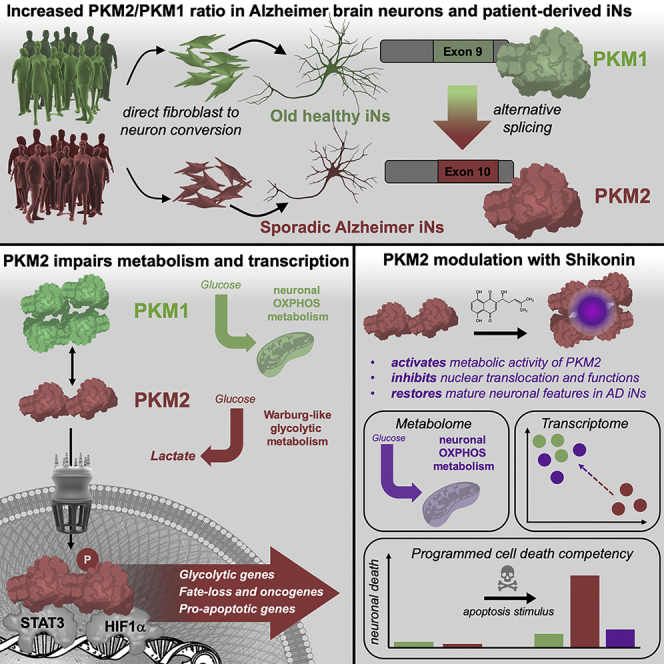
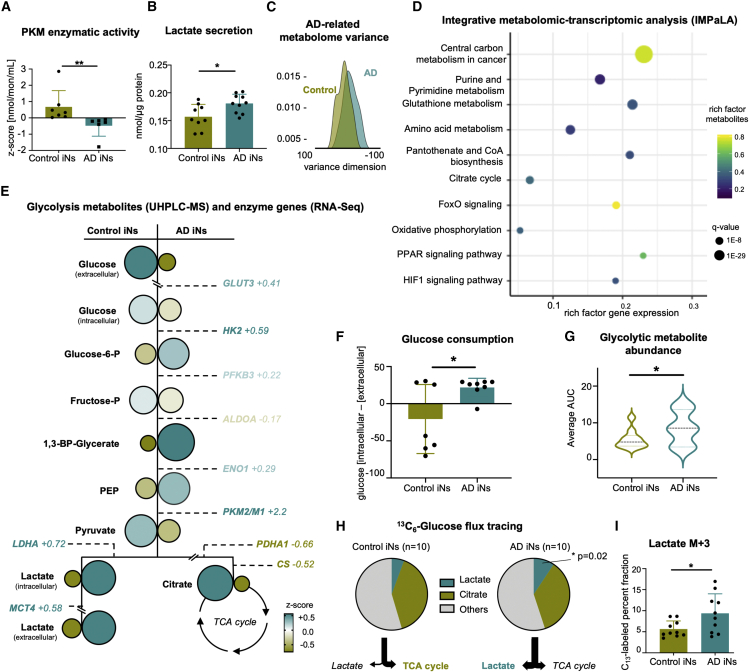
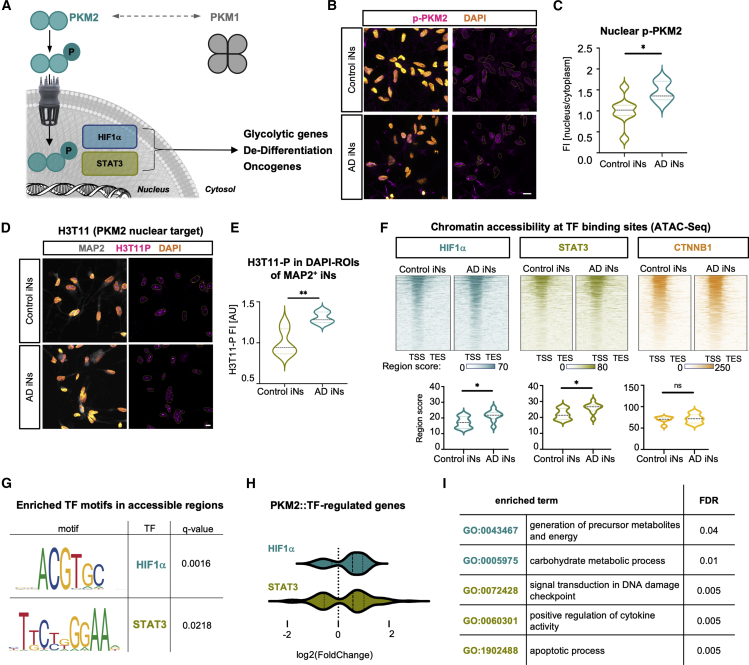
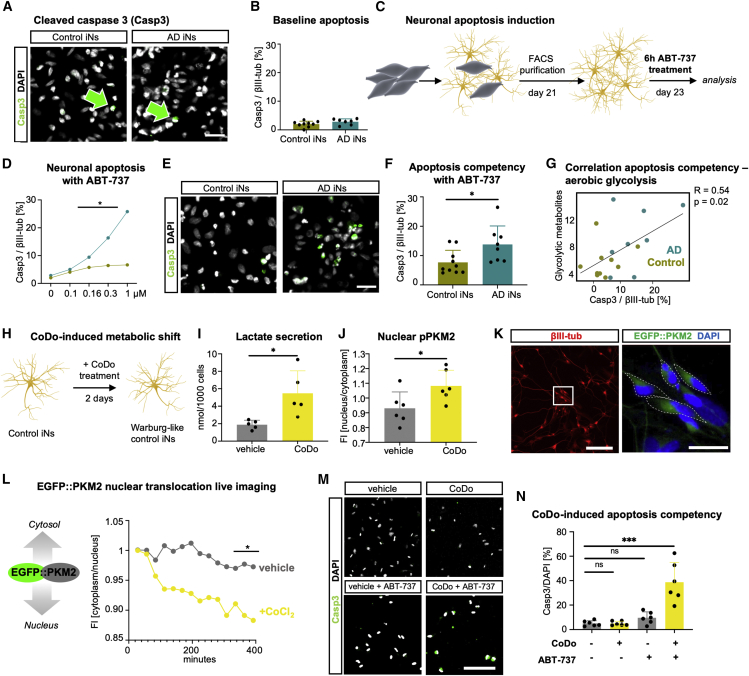
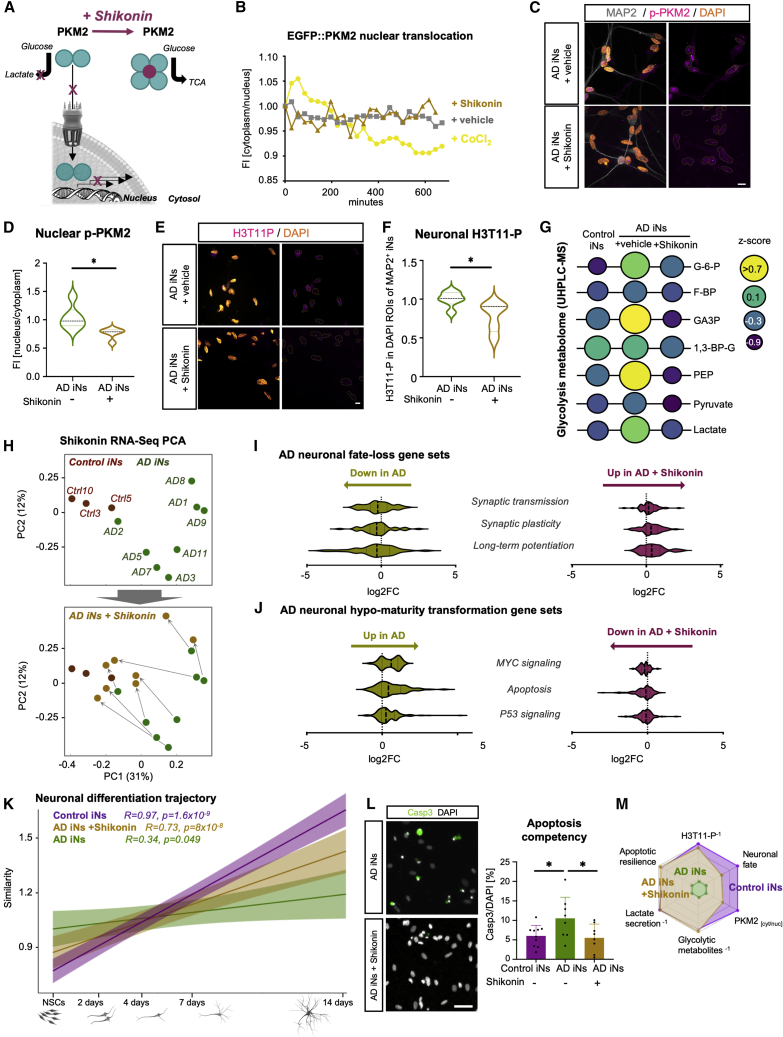
The drivers of sporadic Alzheimer's disease (AD) remain incompletely understood. Utilizing directly converted induced neurons (iNs) from AD-patient-derived fibroblasts, we identified a metabolic switch to aerobic glycolysis in AD iNs. Pathological isoform switching of the glycolytic enzyme pyruvate kinase M (PKM) toward the cancer-associated PKM2 isoform conferred metabolic and transcriptional changes in AD iNs. These alterations occurred via PKM2's lack of metabolic activity and via nuclear translocation and association with STAT3 and HIF1α to promote neuronal fate loss and vulnerability. Chemical modulation of PKM2 prevented nuclear translocation, restored a mature neuronal metabolism, reversed AD-specific gene expression changes, and re-activated neuronal resilience against cell death.
Overview
The claims and statistics of this paper haven’t been checked yet.
Run the check — free, no account needed. It reads the open-access text and checks the sources it cites.
Integrity signals
Registry
Cites
Statistics
Figures
Verification
Claims the paper makes
The claims and statistics of this paper haven’t been checked yet.
Run the check — free, no account needed. It reads the open-access text and checks the sources it cites.
Claims other papers make about this one
Each is checked against this paper’s own text: does it say what the citing paper says it does?
The source backs part of the claim, not all of it — or backs it for a different population, condition or comparison.
In the citing paper
“These neurons exhibited several age-associated dysregulations such as instability of mature neuronal fate, increased cellular senescence, and metabolic shifts (11, 24, 25)”
From Modeling late-onset Alzheimer’s disease neuropathology via direct neuronal reprogramming (2024) · cites this paper as [25]
Experimental — accuracy not yet measuredThe source backs part of the claim, not all of it — or backs it for a different population, condition or comparison.
In the citing paper
“but no AD hallmark neuropathology was shown.”
From Modeling late-onset Alzheimer’s disease neuropathology via direct neuronal reprogramming (2024) · cites this paper as [25]
Experimental — accuracy not yet measuredThe cited source says what the claim attributes to it.
In the citing paper
“Recent studies have directly induced neurons from individuals with AD through NGN2/ASCL1 overexpression.”
From Modeling late-onset Alzheimer’s disease neuropathology via direct neuronal reprogramming (2024) · cites this paper as [25]
Self-check
Percentages, sums and reported differences re-computed from the paper’s own numbers.
The self-check needs the paper’s full text.
Citations
Cites
WGCNA: an R package for weighted correlation network analysis
Langfelder, P., & Horvath, S. (2008) · BMC Bioinformatics · doi:10.1186/1471-2105-9-559 · Cited by 27,252
Understanding the Warburg Effect: The Metabolic Requirements of Cell Proliferation
Vander Heiden, M. G., Cantley, L. C., & Thompson, C. B. (2009) · Science · doi:10.1126/science.1160809 · Cited by 16,197
deepTools2: a next generation web server for deep-sequencing data analysis
Ramírez, F., Ryan, D. P., Grüning, B., Bhardwaj, V., Kilpert, F., Richter, A. S., Heyne, S., Dündar, F., & Manke, T. (2016) · Nucleic Acids Research · doi:10.1093/nar/gkw257 · Cited by 8,096
MetaboAnalyst 5.0: narrowing the gap between raw spectra and functional insights
Pang, Z., Chong, J., Zhou, G., Morais, D. A. D. L., Chang, L., Barrette, M., Gauthier, C., Jacques, P., Li, S., & Xia, J. (2021) · Nucleic Acids Research · doi:10.1093/nar/gkab382 · Cited by 3,972
Metabolic Reprogramming: A Cancer Hallmark Even Warburg Did Not Anticipate
Ward, P. S., & Thompson, C. B. (2012) · Cancer Cell · doi:10.1016/j.ccr.2012.02.014 · Cited by 3,233
Fang, E. F., Hou, Y., Palikaras, K., Adriaanse, B. A., Kerr, J. S., Yang, B., Lautrup, S., Hasan-Olive, M. M., Caponio, D., Dan, X., et al. (2019) · Nature Neuroscience · doi:10.1038/s41593-018-0332-9 · Cited by 1,740
Pyruvate Kinase M2 Is a PHD3-Stimulated Coactivator for Hypoxia-Inducible Factor 1
Luo, W., Hu, H., Chang, R., Zhong, J., Knabel, M., O'Meally, R., Cole, R. N., Pandey, A., & Semenza, G. L. (2011) · Cell · doi:10.1016/j.cell.2011.03.054 · Cited by 1,463
Zebrafish heart regeneration occurs by cardiomyocyte dedifferentiation and proliferation
Jopling, C., Sleep, E., Raya, M., Martí, M., Raya, A., & Belmonte, J. C. I. (2010) · Nature · doi:10.1038/nature08899 · Cited by 1,333
Nuclear PKM2 regulates β-catenin transactivation upon EGFR activation
Yang, W., Xia, Y., Ji, H., Zheng, Y., Liang, J., Huang, W., Gao, X., Aldape, K., & Lu, Z. (2011) · Nature · doi:10.1038/nature10598 · Cited by 1,051
Johnson, E. C. B., Dammer, E. B., Duong, D. M., Ping, L., Zhou, M., Yin, L., Higginbotham, L. A., Guajardo, A., White, B., Troncoso, J. C., et al. (2020) · Nature Medicine · doi:10.1038/s41591-020-0815-6 · Cited by 1,001
Cited by
Sorted by citations
Induced pluripotent stem cells (iPSCs): molecular mechanisms of induction and applications
Cerneckis, J., Cai, H., & Shi, Y. (2024) · Signal Transduction and Targeted Therapy · doi:10.1038/s41392-024-01809-0 · Cited by 452
Redox regulation: mechanisms, biology and therapeutic targets in diseases
Li, B., Ming, H., Qin, S., Nice, E. C., Dong, J., Du, Z., & Huang, C. (2025) · Signal Transduction and Targeted Therapy · doi:10.1038/s41392-024-02095-6 · Cited by 389
Mitochondria: It is all about energy
Casanova, A., Wevers, A., Ledesma, S. N., & Pruimboom, L. (2023) · Frontiers in Physiology · doi:10.3389/fphys.2023.1114231 · Cited by 350
Herdy, J. R., Traxler, L., Agarwal, R. K., Karbacher, L., Schlachetzki, J. C. M., Boehnke, L., Zangwill, D., Galasko, D., Glass, C. K., Mertens, J., et al. (2022) · Cell Stem Cell · doi:10.1016/j.stem.2022.11.010 · Cited by 208
Self-citationZhang, Y., Song, H., Li, M., & Lu, P. (2024) · Clinical and Translational Medicine · doi:10.1002/ctm2.1614 · Cited by 84
Modeling late-onset Alzheimer’s disease neuropathology via direct neuronal reprogramming
Sun, Z., Kwon, J.-S., Ren, Y., Chen, S., Walker, C. K., Lu, X., Cates, K., Karahan, H., Sviben, S., Fitzpatrick, J. A. J., et al. (2024) · Science · doi:10.1126/science.adl2992 · Cited by 77
Neuronal senescence may drive brain aging
Herdy, J. R., Mertens, J., & Gage, F. H. (2024) · Science · doi:10.1126/science.adi3450 · Cited by 78
Self-citationWeak neuronal glycolysis sustains cognition and organismal fitness
Jiménez-Blasco, D., Agulla, J., Lapresa, R., Macia, M. G., Bobo-Jiménez, V., García-Rodríguez, D., Manjarrés-Raza, I., Fernández, E., Jeanson, Y., Khoury, S., et al. (2024) · Nature Metabolism · doi:10.1038/s42255-024-01049-0 · Cited by 65
Ji, Y., Chen, X., Wang, Z., Meek, C. J., McLean, J. L., Yang, Y., Yuan, C., Rochet, J., Liu, F., & Xu, R. (2025) · Molecular Psychiatry · doi:10.1038/s41380-025-03041-w · Cited by 74
Pushing the boundaries of brain organoids to study Alzheimer’s disease
Cerneckis, J., Bu, G., & Shi, Y. (2023) · Trends in Molecular Medicine · doi:10.1016/j.molmed.2023.05.007 · Cited by 63
Arias, C., Sepúlveda, P., Castillo, R. L., & Salazar, L. A. (2023) · International Journal of Molecular Sciences · doi:10.3390/ijms24043073 · Cited by 53
SLC31A1 loss depletes mitochondrial copper and promotes cardiac fibrosis
Tu, B., Song, K., Zhou, Z., Lin, L.-C., Liu, Z., Sun, H., Zhou, Y., Sha, J.-M., Shi, Y., Yang, J., et al. (2025) · European Heart Journal · doi:10.1093/eurheartj/ehaf130 · Cited by 54
Astrocytes in selective vulnerability to neurodegenerative disease
Zimmer, T. S., Orr, A. L., & Orr, A. G. (2024) · Trends in Neurosciences · doi:10.1016/j.tins.2024.02.008 · Cited by 57
Reinventing the Penumbra — the Emerging Clockwork of a Multi-modal Mechanistic Paradigm
Walther, J., Kirsch, E. M., Hellwig, L., Schmerbeck, S. S., Holloway, P. M., Buchan, A. M., & Mergenthaler, P. (2022) · Translational Stroke Research · doi:10.1007/s12975-022-01090-9 · Cited by 49
Metabolic Signatures of Performance in Elite World Tour Professional Male Cyclists
Nemkov, T. G., Cendali, F. I., Stefanoni, D., Martinez, J. L., Hansen, K. C., San-Millán, I., & D’Alessandro, A. (2023) · Sports Medicine · doi:10.1007/s40279-023-01846-9 · Cited by 48
Self-citationPKM2-mediated metabolic reprogramming of microglia in neuroinflammation
Zhang, Q., Wang, S., Zhang, Z., & Chu, S.-F. (2025) · Cell Death Discovery · doi:10.1038/s41420-025-02453-5 · Cited by 45
Wang, Y.-H., Gao, P., Wang, Y., Xu, L., Zeng, K., & Tu, P. (2024) · European Journal of Pharmacology · doi:10.1016/j.ejphar.2024.176551 · Cited by 43
Chen, Y., Zizmare, L., Calbiague, V., Wang, L., Yu, S., Herberg, F. W., Schmachtenberg, O., Paquet‐Durand, F., & Trautwein, C. (2023) · eLife · doi:10.7554/elife.91141 · Cited by 40
Wang, H., Liu, S., Sun, Y., Chen, C., Hu, Z., Li, Q., Long, J., Yan, Q., Liang, J., Lin, Y., et al. (2024) · Ageing Research Reviews · doi:10.1016/j.arr.2024.102472 · Cited by 39
Yao, X., Wang, X., Zhang, R., Kong, L., Fan, C., & Qian, Y. (2025) · Nature Communications · doi:10.1038/s41467-025-59562-z · Cited by 40
Chen, W., Liu, X., Muñoz, V. R., & Kahn, C. R. (2025) · Proceedings of the National Academy of Sciences · doi:10.1073/pnas.2501527122 · Cited by 42
Hu, J., Sha, W., Yuan, S., Wu, J., & Huang, Y. (2023) · International Journal of Molecular Sciences · doi:10.3390/ijms241915023 · Cited by 40
Andreyev, A. Y., Yang, H., Doulias, P., Dolatabadi, N., Zhang, X., Luevanos, M., Blanco, M., Baal, C., Putra, I., Nakamura, T., et al. (2024) · Advanced Science · doi:10.1002/advs.202306469 · Cited by 35
Lactylation of tau in human Alzheimer's disease brains
Zhang, X., Liu, Y., Rekowski, M. J., & Wang, N. (2024) · Alzheimer s & Dementia · doi:10.1002/alz.14481 · Cited by 40
Neural cell state shifts and fate loss in ageing and age-related diseases
Traxler, L., Lucciola, R., Herdy, J. R., Jones, J. R., Mertens, J., & Gage, F. H. (2023) · Nature Reviews Neurology · doi:10.1038/s41582-023-00815-0 · Cited by 37
Self-citationChen, Y., Huang, L., Luo, Z., Han, D., Luo, W., Wan, R., Li, Y., Ge, Y., Lin, W., Xie, Y., et al. (2024) · Journal of Controlled Release · doi:10.1016/j.jconrel.2024.07.010 · Cited by 32
The Role of PKM2 in Multiple Signaling Pathways Related to Neurological Diseases
Zhang, X., Lei, Y., Zhou, H., Liu, H., & Xu, P. (2023) · Molecular Neurobiology · doi:10.1007/s12035-023-03901-y · Cited by 30
Massaro, M., Baudo, G., Lee, H., Liu, H., & Blanco, E. (2024) · Neurotherapeutics · doi:10.1016/j.neurot.2024.e00513 · Cited by 34
Deng, Y.-T., Ma, L., Mei, Y., Wang, J.-S., Bai, X., Zheng, X.-J., Ren, J., Zhong, D., Zhou, B.-L., Dan, J., et al. (2025) · Science Signaling · doi:10.1126/scisignal.adr9397 · Cited by 30
Novel therapeutic approaches to target neurodegeneration
de la Fuente, A. G., Pelucchi, S., Mertens, J., Luca, M. D., Mauceri, D., & Marcello, E. E. (2023) · British Journal of Pharmacology · doi:10.1111/bph.16078 · Cited by 32
Self-citationMicroglial immunometabolism endophenotypes contribute to sex difference in Alzheimer's disease
Hou, Y., Caldwell, J., Lathia, J. D., Leverenz, J. B., Pieper, A. A., Cummings, J. L., & Cheng, F. (2023) · Alzheimer s & Dementia · doi:10.1002/alz.13546 · Cited by 29
de Geus, M. B., Leslie, S. N., Lam, T. T., Wang, W., Roux‐Dalvai, F., Droit, A., Kivisäkk, P., Nairn, A. C., Arnold, S. E., & Carlyle, B. C. (2023) · Scientific Reports · doi:10.1038/s41598-023-49440-3 · Cited by 28
A metabolic atlas of mouse aging
Pilley, S. E., Awad, D., Latumalea, D., New, C., Esparza, E., Wang, S. Y., Shi, X., Zhang, L., Unfried, M., Lee, J. H., et al. (2025) · Cell Metabolism · doi:10.1016/j.cmet.2025.10.016 · Cited by 26
Little, K., Singh, A. P., del Marco, À., Llorián‐Salvador, M., Vargas-Soria, M., Turch, M., Solé, M., Bakker, N., Scullion, S., Comella, J. X., et al. (2023) · Diabetologia · doi:10.1007/s00125-023-05935-2 · Cited by 26
COVID ‐19 and neurodegeneration: The mitochondrial connection
Denaro, C. A., Haloush, Y. I., Hsiao, S. Y., Orgera, J. J., Osorio, T., Riggs, L. M., Sassaman, J. W., Williams, S. A., Carlo, A. R. M., da Costa, R. T., et al. (2022) · Aging Cell · doi:10.1111/acel.13727 · Cited by 23
Liu, Y., Kwok, W., Yoon, H., Ryu, J. C., Stevens, P., Hawkinson, T. R., Shedlock, C. J., Ribas, R. A., Medina, T., Keohane, S. B., et al. (2024) · Journal of Neuroscience · doi:10.1523/jneurosci.1563-23.2024 · Cited by 21
Yang, L., Hu, C., Chen, X., Zhang, J., Feng, Z., Xiao, Y., He, W., Cui, T., Zhang, X., Yang, Y., et al. (2024) · eLife · doi:10.7554/elife.98181 · Cited by 21
Sun, H., Liu, C., Han, F., Lin, X., Cao, L., Liu, C., Ji, Q., Cui, J., Yao, Y., Wang, B., et al. (2023) · Cell Death and Differentiation · doi:10.1038/s41418-023-01118-z · Cited by 22
Qin, Q., Li, M., Fan, L., Zeng, X., Zheng, D., Wang, H., Jiang, Y., Ma, X., Xing, L., Wu, L., et al. (2025) · Molecular Psychiatry · doi:10.1038/s41380-025-02988-0 · Cited by 23
Epigenome–metabolism nexus in the retina: implications for aging and disease
Mondal, A. K., Gaur, M., Advani, J., & Swaroop, A. (2024) · Trends in Genetics · doi:10.1016/j.tig.2024.04.012 · Cited by 20
Rong, S., Dai, B., Yang, C., Lan, Z., Wang, L., Xu, L., Chen, W., Chen, J., & Wu, Z. (2024) · Journal of Translational Medicine · doi:10.1186/s12967-024-05668-9 · Cited by 21
Autophagy regulator ATG5 preserves cerebellar function by safeguarding its glycolytic activity
Tutas, J., Tolve, M., Ozer, E., Ickert, L., Klein, I., Silverman, Q., Liebsch, F., Dethloff, F., Giavalisco, P., Endepols, H., et al. (2025) · Nature Metabolism · doi:10.1038/s42255-024-01196-4 · Cited by 20
da Rocha, J. F., Lance, M. L., Luo, R., Schlachter, P., Moreira, L., Iqbal, M. A., Kuhn, P., Gardner, R. S., Valaris, S., Islam, M. R., et al. (2025) · Nature Neuroscience · doi:10.1038/s41593-025-01971-w · Cited by 22
Paciotti, S., Wojdała, A. L., Bellomo, G., Toja, A., Chipi, E., Piersma, S. R., Pham, T. V., Gaetani, L., Jiménez, C. R., Parnetti, L., et al. (2023) · Alzheimer s Research & Therapy · doi:10.1186/s13195-023-01269-8 · Cited by 20
Javadpour, P., Abbaszadeh, F., Ahmadiani, A., Rezaei, M., & Ghasemi, R. (2024) · Molecular Neurobiology · doi:10.1007/s12035-024-04009-7 · Cited by 21
Wu, Y., Yang, L., Jiang, W., Zhang, X., & Yao, Z. (2024) · Neural Regeneration Research · doi:10.4103/nrr.nrr-d-24-00190 · Cited by 19
A cellular identity crisis? Plasticity changes during aging and rejuvenationPreprint
Gorelov, R. A., & Hochedlinger, K. (2024) · Genes & Development · doi:10.1101/gad.351728.124 · Cited by 18
Ceccarelli, D. C., & Solerte, S. B. (2025) · Metabolites · doi:10.3390/metabo15030159 · Cited by 18
Targeting glycolysis for neuroprotection in early LPS-induced neuroinflammation
Vizuete, A. F. K., Fróes, F. T., Seady, M., Caurio, A. C., Júnior, O. V. R., Leite, A. K. O., Farias, C. P., Wyse, Â. T. D. S., & Gonçalves, C. (2024) · Brain Behavior & Immunity - Health · doi:10.1016/j.bbih.2024.100901 · Cited by 17
Chen, Y., Zhang, M., Jia, R., Qian, B., Jing, C., Caihong, Z., Zhu, D., Liu, Z., Zen, K., & Li, L. (2024) · Redox Biology · doi:10.1016/j.redox.2024.103439 · Cited by 17
Multi-omics and high-spatial-resolution omics: deciphering complexity in neurological disorders
Liu, X., Li, F., Czosnyka, M., Czosnyka, Z. H., Yu, H., Tong, X., Xing, Y., Li, H., Pu, K., Feng, K., et al. (2025) · GigaScience · doi:10.1093/gigascience/giaf137 · Cited by 16
Genetic effects on molecular network states explain complex traits
Weith, M., Großbach, J., Clément‐Ziza, M., Gillet, L. C. J., Rodríguez‐López, M., Marguerat, S., Workman, C. T., Picotti, P., Bähler, J., Aebersold, R. H., et al. (2023) · Molecular Systems Biology · doi:10.15252/msb.202211493 · Cited by 16
Adaptive responses of neuronal cells to chronic endoplasmic reticulum (ER) stress
Pham, T. N. M., Perumal, N., Manicam, C., Başoğlu, M., Eimer, S., Fuhrmann, D. C., Pietrzik, C. U., Clement, A. M., Körschgen, H., Schepers, J., et al. (2023) · Redox Biology · doi:10.1016/j.redox.2023.102943 · Cited by 16
Devrukhkar, P. R., Watson, M. A., Soygur, B., Wu, F., Bons, J., Anvari, H., Atazhanova, T., Martin, N., Tran, T., Schneider, K., et al. (2025) · Aging Cell · doi:10.1111/acel.70111 · Cited by 17
USP28 promotes tumor progression and glycolysis by stabilizing PKM2/Hif1-α in cholangiocarcinoma
Qiao, Q., Wang, J., Liu, S., Chang, J., Zhou, T., Li, C., Zhang, Y., Jiang, W., Chen, Y., Xu, X., et al. (2024) · Cellular Oncology · doi:10.1007/s13402-024-01002-z · Cited by 15
APC/C-Cdh1-targeted substrates as potential therapies for Alzheimer’s disease
Lapresa, R., Agulla, J., Bolaños, J., & Almeida, Á. (2022) · Frontiers in Pharmacology · doi:10.3389/fphar.2022.1086540 · Cited by 10
Huai, J., Chang, E.-E., Zhu, Y., Ma, W., Lv, T.-S., Sun, J., & Zhou, X. (2025) · Frontiers in Cell and Developmental Biology · doi:10.3389/fcell.2025.1701406 · Cited by 15
Metabolomic analysis of Drosophila melanogaster larvae lacking pyruvate kinase
Heidarian, Y., Tourigny, J. P., Fasteen, T. D., Mahmoudzadeh, N. H., Hurlburt, A. J., Nemkov, T. G., Reisz, J. A., D’Alessandro, A., & Tennessen, J. M. (2023) · G3 Genes Genomes Genetics · doi:10.1093/g3journal/jkad228 · Cited by 13
Self-citationNeuronal aerobic glycolysis exacerbates synapse loss in aging mice
Zhou, W., Yang, X., Wang, H., Yao, W., Chu, D., & Wu, F. (2023) · Experimental Neurology · doi:10.1016/j.expneurol.2023.114590 · Cited by 13
Perez, Y., Velmeshev, D., Wang, L., White, M. L., Siebert, C., Baltazar, J., Zuo, G., Moriano, J., Chen, S., Steffen, D. M., et al. (2025) · Nature Communications · doi:10.1038/s41467-025-61184-4 · Cited by 12
Succinate-driven PKM2 succinylation and dimerization accelerates age-associated cardiac fibrosis
Wang, Z., Zhang, Z., Ping, Z., Yang, S., Li, Y., Jiang, T., Zheng, X., Zhang, Q., Liu, Z., Zhang, X., et al. (2025) · Communications Biology · doi:10.1038/s42003-025-09337-5 · Cited by 11
Cancer progression through the lens of age-induced metabolic reprogramming
Lazure, F., & Gomes, A. P. (2025) · Nature reviews. Cancer · doi:10.1038/s41568-025-00845-4 · Cited by 11
Liu, W., Fan, B., Fang, T., Li, H., Zhang, J., Liu, B., & Liu, Z. (2025) · Acta Pharmaceutica Sinica B · doi:10.1016/j.apsb.2025.08.010 · Cited by 10
Liu, M., Ma, S., Tai, W., Zhong, X., Ni, H., Zou, Y., Wang, J., & Zhang, C. (2024) · Cell Death and Disease · doi:10.1038/s41419-023-06395-7 · Cited by 10
Murai, T., & Matsuda, S. (2023) · Biology · doi:10.3390/biology12081081 · Cited by 9
Sharma, B., Koren, D. T., & Ghosh, S. (2023) · Biophysical Chemistry · doi:10.1016/j.bpc.2023.107114 · Cited by 9
Dysfunctional β-cell longevity in diabetes relies on energy conservation and positive epistasis
Raval, K., Jamshidi, N., Seyran, B., Salwiński, Ł., Pillai, R. K., Yang, L., Ma, F., Pellegrini, M. A., Shin, J., Yang, X., et al. (2024) · Life Science Alliance · doi:10.26508/lsa.202402743 · Cited by 8
Li, W., Liu, X., Li, H., Zeng, J., Chen, Y., & Xu, B. (2024) · Scientific Reports · doi:10.1038/s41598-024-81600-x · Cited by 8
Neuronal glycolysis meets mitophagy to govern organismal wellbeing
Jiménez-Blasco, D., Lapresa, R., Agulla, J., Almeida, Á., & Bolaños, J. P. (2025) · Trends in Endocrinology and Metabolism · doi:10.1016/j.tem.2025.05.005 · Cited by 8
Xu, F., Shi, L., Wang, S., Zhang, H., Chen, H., He, S., Chen, M., Fu, J., Yang, M., Wang, Y., et al. (2025) · Journal of Advanced Research · doi:10.1016/j.jare.2025.12.038 · Cited by 8
Human tau promotes Warburg effect–like glycolytic metabolism under acute hyperglycemia conditions
Yao, J., Li, K., Fu, Z., Zheng, J., Chen, Z., Xu, J., Lai, G., Huang, Y., Huang, J., You, G., et al. (2025) · Journal of Biological Chemistry · doi:10.1016/j.jbc.2025.108376 · Cited by 8
Duan, H., Lai, Q., Jiang, Y., Yang, L., Deng, M., Lin, Z., Shan, W., Zhong, M., Yao, J., Zhang, L., et al. (2024) · Experimental Hematology and Oncology · doi:10.1186/s40164-024-00589-1 · Cited by 7
SENP1 inhibits aerobic glycolysis in Aβ1-42-incubated astrocytes by promoting PUM2 deSUMOylation
Liu, Q., Jiang, M., Wang, Z., Meng, J., Jia, H., Li, J., Lin, J., Guo, L., & Gao, L. (2025) · Cell Biology and Toxicology · doi:10.1007/s10565-025-09986-6 · Cited by 7
The complex web of membrane contact sites in brain aging and neurodegeneration
Tehran, D. A., & Pizzo, P. (2025) · Cellular and Molecular Life Sciences · doi:10.1007/s00018-025-05830-6 · Cited by 8
Adeoye, T., Shah, S. I., & Ullah, G. (2024) · Aging and Disease · doi:10.14336/ad.2024.0429 · Cited by 7
Landry, T., Perrault, L., Melville, D., Chen, Z., Li, Y., Dong, P., Farmer, W. T., Asrican, B., Lee, H., Zhang, L., et al. (2025) · Neuron · doi:10.1016/j.neuron.2025.08.016 · Cited by 7
Zhang, Y., Long, X., Yao, B.-F., Tian, J., Peng, J., & Luo, X. (2025) · Free Radical Biology and Medicine · doi:10.1016/j.freeradbiomed.2025.09.026 · Cited by 6
Chen, H., Li, M., Xie, F., Liu, S., Yang, A., Yin, J., Wang, X., Long, Y., Wu, S., Cai, L., et al. (2025) · Molecular Cancer · doi:10.1186/s12943-025-02500-w · Cited by 6
Yao, Y., Wan, R., An, Y., He, B., Tan, Q., Xu, H., Pan, X., Liu, S., Chen, X., & Li, J. (2025) · Biochemical Pharmacology · doi:10.1016/j.bcp.2025.117546 · Cited by 6
Wang, S., Ponnusamy, M., Patel, O., Hansen, M. T., Collier, L. A., Collier, S., & Thinakaran, G. (2026) · Experimental & Molecular Medicine · doi:10.1038/s12276-026-01652-z · Cited by 7
Toxicity of the spike protein of COVID-19 is a redox shift phenomenon: A novel therapeutic approach
Schwartz, L. H., Aparicio-Alonso, M., Henry, M., Radman, M., Attal, R., & Bakkar, A. (2023) · Free Radical Biology and Medicine · doi:10.1016/j.freeradbiomed.2023.05.034 · Cited by 6
Podvin, S., Jones, J. R., Kang, A., Goodman, R., Reed, P., Lietz, C. B., Then, J., Lee, K. C., Eyler, L. T., Jeste, D. V., et al. (2024) · Molecular Psychiatry · doi:10.1038/s41380-024-02422-x · Cited by 6
Self-citationHoufková, A., Schmidt, M., Benek, O., Fabrik, I., Andrýs, R., Zemanová, L., Soukup, O., & Musílek, K. (2025) · Alzheimer s Research & Therapy · doi:10.1186/s13195-025-01821-8 · Cited by 5
Yu, H., & Yan, L. (2025) · Gene · doi:10.1016/j.gene.2025.149685 · Cited by 6
Li, M., Duan, W., Hao, X., Li, S., Wang, C., Liang, Y., Hu, Z., Ma, D., Guo, M., Zuo, C., et al. (2025) · Molecular Psychiatry · doi:10.1038/s41380-025-03198-4 · Cited by 5
Carrera‐Bastos, P., Muskiet, M. H. A., Ordóñez, F. M., Pruimboom, L., Lucía, A., Luque, R. M., & Muskiet, F. A. J. (2025) · Reviews in Endocrine and Metabolic Disorders · doi:10.1007/s11154-025-09996-z · Cited by 5
Aerobic glycolysis in Schizophrenia: Developmental rescue or energetic breakdown?
Memetoglu, O., Goyal, M. S., Chouinard, V., Du, F., & Öngür, D. (2026) · Molecular Psychiatry · doi:10.1038/s41380-026-03460-3 · Cited by 5
Neurodevelopmental origins of age-related neurodegenerative diseases
Chow, H., & Abel, T. G. (2026) · EBioMedicine · doi:10.1016/j.ebiom.2026.106151 · Cited by 6
Cunliffe, G., Lim, Y. T., Chae, W., & Jung, S. (2022) · Biomedicines · doi:10.3390/biomedicines10123064 · Cited by 6
Stochastic Modeling and Simulation of Filament Aggregation in Alzheimer’s Disease
Ojha, V. P., Yarahmadian, S., & Om, M. (2024) · Processes · doi:10.3390/pr12010157 · Cited by 5
Nudix Hydrolase 13 Impairs the Initiation of Colorectal Cancer by Inhibiting PKM1 ADP‐Ribosylation
Lin, J., Yin, Y., Cao, J., Zou, B., Han, K., Chen, Y., Li, S., Huang, C., Chen, J., Lv, Y., et al. (2025) · Advanced Science · doi:10.1002/advs.202410058 · Cited by 5
Jinling, D., Liyuan, F., Wenying, F., Huang, Y., Tang, X., Xiuning, H., Tang, Y., Qianliang, M., Guo, L., Gao, N., et al. (2022) · Frontiers in Pharmacology · doi:10.3389/fphar.2022.1051103 · Cited by 5
Latina, V., Atlante, A., Malerba, F., Regina, F. L., Balzamino, B. O., Micera, A., Pignataro, A., Stigliano, E., Cavallaro, S., Calissano, P., et al. (2023) · International Journal of Molecular Sciences · doi:10.3390/ijms24119683 · Cited by 5
Direct conversion of fibroblast into neurons for Alzheimer's disease research: a systematic review
Sattarov, R., Toresson, H., Orbjörn, C., & Mattsson-Carlgren, N. (2023) · Journal of Alzheimer’s Disease · doi:10.3233/jad-230119 · Cited by 4
Song, Z., He, J., Yu, W., He, C., Yang, M., Li, P., Li, Z., Jian, G., & Cheng, S. (2024) · Frontiers in Microbiology · doi:10.3389/fmicb.2024.1440564 · Cited by 4
Zhou, X., Wu, R., Tang, G., Shen, T., & Li, W. (2025) · BMC Endocrine Disorders · doi:10.1186/s12902-025-01888-2 · Cited by 4
Novel targets for treating neurodegenerative diseases: The PKM2-STAT3-hnRNPA1 feedback loop
Ye, P., Li, Z., & Jiang, H. (2025) · Pharmacological Research · doi:10.1016/j.phrs.2025.107840 · Cited by 4
Targeted tau protein degradation: a promising therapeutic approach for tauopathies
Baazaoui, N., Alfaifi, M. Y., Shati, A. A., Saad, R. B., & Garzoli, S. (2025) · Neuroscience · doi:10.1016/j.neuroscience.2025.11.041 · Cited by 5
Blood Cell Mitochondrial Respiration Increases With Age and Varies by Sex in Healthy Adults
Phang, H. J., Bergstrom, J., Keri, B., Heimler, S., Dozier, S., Scandalis, L., Wing, D., Moreno, D. S.-M., Sun, N., & Molina, A. J. A. (2026) · Aging Cell · doi:10.1111/acel.70387 · Cited by 5
Uemura, K., Hiro, S., Attachaipanich, S., Du, R., Yusof, N. I. S. M., Kinoshita, M., Hikosaka, M., & Ohtsuki, G. (2026) · Frontiers in Cellular Neuroscience · doi:10.3389/fncel.2025.1669272 · Cited by 5
Metadata
- Authors
- Traxler, L., Herdy, J. R., Stefanoni, D., Eichhorner, S., Pelucchi, S., Szücs, A., Santagostino, A., Kim, Y., Agarwal, R. K., Schlachetzki, J. C. M., Glass, C. K., Lagerwall, J., Galasko, D., Gage, F. H., D’Alessandro, A., & Mertens, J.
- Affiliations
- Universität Innsbruck (AT)
- Salk Institute for Biological Studies (US)
- University of Colorado Anschutz (US)
- University of Michigan (US)
- University of California San Diego (US)
- Corresponding author
- Traxler, Larissa
- ORCID
- Venue
- Cell Metabolism
- Publisher
- Elsevier BV
- Published
- 2022-09
- Volume
- 34
- Issue
- 9
- Pages
- 1248-1263.e6
- ISSN
- 1550-4131 (ISSN-L)
- PMC
- PMC9458870
- OpenAlex
- W4292379491
- Cited by
- 179
- References
- 70
- Citations by year
- 2026: 35 · 2025: 56 · 2024: 49 · 2023: 29 · 2022: 10
- FWCI
- 22.29
- Type
- journal article
- Language
- en
- Open access
- hybrid
- doi.org
- Licence
- Locations
- Cell Metabolism (publishedVersion, cc-by)
- PubMed Central (publishedVersion, cc-by)
- PubMed (publishedVersion)
- Archivio Istituzionale della Ricerca (Universita Degli Studi Di Milano) (submittedVersion, other-oa)
- ELTE Digital Institutional Repository (EDIT) (Eötvös Loránd University) (submittedVersion, other-oa)
- Funders
- Alzheimer's Disease Research Center, Emory University (AG062429)
- Leona M. and Harry B. Helmsley Charitable Trust (P30CA23100)
- Marshallplan-Jubiläumsstiftung
- National Institute on Aging (AG056306, AG056511, AG057706)
- BrightFocus Foundation
- European Commission (H2020-MSCA-IF-2017-797205)
- Austrian Science Fund
- Hungarian Scientific Research Fund (ANN-135291)
- European Research Council (ERC-STG-2019-852086)
- Horizon 2020 Marie Skłodowska-Curie Actions
- Milky Way Research Foundation (P30014195)
- Topics
- Life Sciences › Neuroscience › Cellular and Molecular Neuroscience › Alzheimer's disease research and treatments
- Life Sciences › Biochemistry, Genetics and Molecular Biology › Cancer Research › Cancer, Hypoxia, and Metabolism
- Life Sciences › Neuroscience › Neurology › Neuroinflammation and Neurodegeneration Mechanisms
- Keywords
- sporadic Alzheimer's disease, neurodegeneration, aerobic glycolysis, Warburg effect, PKM2, induced neurons, patient-derived fibroblasts, nuclear translocation, STAT3, HIF-1α, neuronal vulnerability, metabolic reprogramming
- MeSH terms
- Alzheimer Disease, Glycolysis, Humans, Neoplasms, Pyruvate Kinase, Protein Isoforms
About these checks
Registry, retraction, Cites and statistics results are computed, not judged, with one exception: a printed reference that no index lists is read once by a model before it counts as a citation error. Claims are extracted by a model and kept only when their quote appears verbatim in the text; each cited source is then checked, with a model’s help, for whether it says what the claim relies on. Those verdicts can be wrong — read the claim’s quote and the cited source before relying on one.
Statistics and arithmetic are recomputed, not judged.
Confidence bands are shown only for fields calibrated on our annotated test set. None is calibrated yet, so no band is shown.
What counts as a claim ›How we measure confidence ›How we check this ›
Are you an author, or do you see a problem with this page? Request a review
