

The DOI matches its Crossref record; 11 of the 12 references it cites were found in a registry or an index.
UCell: Robust and scalable single-cell gene signature scoring
Open accessPublished version of a preprint
Abstract
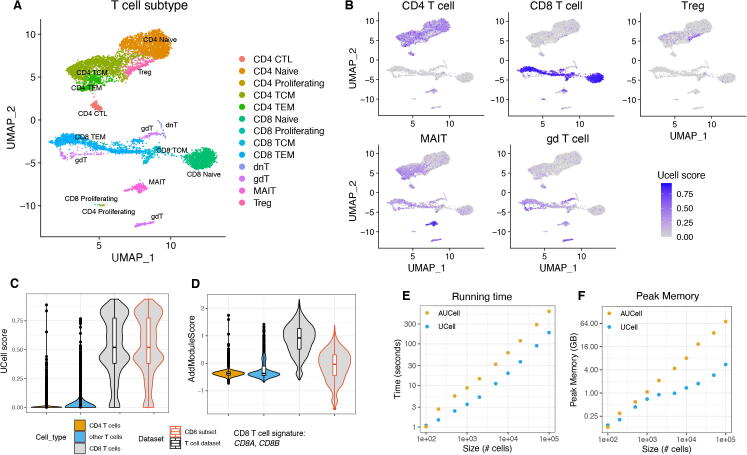
UCell is an R package for evaluating gene signatures in single-cell datasets. UCell signature scores, based on the Mann-Whitney U statistic, are robust to dataset size and heterogeneity, and their calculation demands less computing time and memory than other available methods, enabling the processing of large datasets in a few minutes even on machines with limited computing power. UCell can be applied to any single-cell data matrix, and includes functions to directly interact with Seurat objects. The UCell package and documentation are available on GitHub at https://github.com/carmonalab/UCell.
Overview
The claims and statistics of this paper haven’t been checked yet.
Run the check — free, no account needed. It reads the open-access text and checks the sources it cites.
Integrity signals
Registry
Cites
Statistics
Figures
Verification
Claims the paper makes
The claims and statistics of this paper haven’t been checked yet.
Run the check — free, no account needed. It reads the open-access text and checks the sources it cites.
Claims other papers make about this one
Each is checked against this paper’s own text: does it say what the citing paper says it does?
The cited source says what the claim attributes to it.
In the citing paper
“Optionally, hdWGCNA can use alternative gene scoring methods such as or UCell18 or Seurat’s AddModuleScore function, and we show that these scores are correlated with MEs (Figure S3).”
From hdWGCNA identifies co-expression networks in high-dimensional transcriptomics data (2023) · cites this paper as [18]
Self-check
Percentages, sums and reported differences re-computed from the paper’s own numbers.
The self-check needs the paper’s full text.
Citations
Cites
Integrated analysis of multimodal single-cell data
Hao, Y., Hao, S., Andersen-Nissen, E., Mauck, W. M., Zheng, S., Butler, A., Lee, M. J., Wilk, A. J., Darby, C., Zagar, M., et al. (2020) · doi:10.1101/2020.10.12.335331 · Cited by 15,508
Comprehensive Integration of Single-Cell Data
Stuart, T., Butler, A., Hoffman, P., Hafemeister, C., Papalexi, E., Mauck, W. M., Hao, Y., Stoeckius, M., Smibert, P., & Satija, R. (2019) · Cell · doi:10.1016/j.cell.2019.05.031 · Cited by 15,453
On a Test of Whether one of Two Random Variables is Stochastically Larger than the Other
Mann, H. B., & Whitney, D. R. (1947) · The Annals of Mathematical Statistics · doi:10.1214/aoms/1177730491 · Cited by 14,320
The Molecular Signatures Database Hallmark Gene Set Collection
Liberzon, A., Birger, C., Thorvaldsdóttir, H., Ghandi, M., Mesirov, J. P., & Tamayo, P. (2015) · Cell Systems · doi:10.1016/j.cels.2015.12.004 · Cited by 13,807
Scenic: single-cell regulatory network inference and clustering.
Aibar, S., González-Blas, C. B., Moerman, T., Huynh-Thu, V. A., Imrichova, H., Hulselmans, G., Rambow, F., Marine, J.-C., Geurts, P., Aerts, J., et al. (2017) · Nature Methods · doi:10.1038/nmeth.4463 · Cited by 6,520
Dissecting the multicellular ecosystem of metastatic melanoma by single-cell RNA-seq
Tirosh, I., Izar, B., Prakadan, S. M., Wadsworth, M. H., Treacy, D., Trombetta, J. J., Rotem, A., Rodman, C., Lian, C., Murphy, G., et al. (2016) · Science · doi:10.1126/science.aad0501 · Cited by 4,944
Regev, A., Teichmann, S. A., Lander, E. S., Amit, I., Benoist, C., Birney, E., Bodenmiller, B., Campbell, P., Carninci, P., Clatworthy, M., et al. (2017) · eLife · doi:10.7554/elife.27041 · Cited by 2,232
Regev, A., Teichmann, S. A., Lander, E. S., Amit, I., Benoist, C. O., Birney, E., Bodenmiller, B., & al, E. (2017) · Zurich Open Repository and Archive (University of Zurich) · doi:10.5167/uzh-162597 · Cited by 1,457
Construction of a human cell landscape at single-cell level
Han, X., Zhou, Z., Fei, L., Sun, H., Wang, R., Chen, Y., Chen, H., Wang, J., Tang, H., Ge, W., et al. (2020) · Nature · doi:10.1038/s41586-020-2157-4 · Cited by 1,087
Mason, S. J., & Graham, N. E. (2002) · Quarterly Journal of the Royal Meteorological Society · doi:10.1256/003590002320603584 · Cited by 860
Research works printed but not linked: 1
- 10.1016/j.cell.2021.04.048 · DOI · Paper page
Cited by
Sorted by citations
hdWGCNA identifies co-expression networks in high-dimensional transcriptomics data
Morabito, S., Reese, F., Rahimzadeh, N., Miyoshi, E., & Swarup, V. (2023) · Cell Reports Methods · doi:10.1016/j.crmeth.2023.100498 · Cited by 773
Neutrophil profiling illuminates anti-tumor antigen-presenting potency
Wu, Y. C., Ma, J., Yang, X., Fang, N., Zhang, T., Ji, S., Rao, D., Feng, H., Gao, K., Gu, X., et al. (2024) · Cell · doi:10.1016/j.cell.2024.02.005 · Cited by 453
Deterministic reprogramming of neutrophils within tumors
Ng, M. S. F., Kwok, I., Tan, L., Shi, C., Cerezo‐Wallis, D., Tan, Y., Leong, K. W. K., Calvo, G. F., Yang, K. L., Zhang, Y., et al. (2024) · Science · doi:10.1126/science.adf6493 · Cited by 427
Microglia ferroptosis is regulated by SEC24B and contributes to neurodegeneration
Ryan, S. K., Zelic, M., Han, Y., Teeple, E. A., Chen, L., Sadeghi, M., Shankara, S., Guo, L., Li, C., Pontarelli, F., et al. (2022) · Nature Neuroscience · doi:10.1038/s41593-022-01221-3 · Cited by 377
A single-cell atlas of the normal and malformed human brain vasculature
Winkler, E. A., Kim, C. N., Ross, J. M., Garcia, J. H., Gil, E., Oh, I., Chen, L. Q., Wu, D., Catapano, J. S., Raygor, K. P., et al. (2022) · Science · doi:10.1126/science.abi7377 · Cited by 324
The β1-adrenergic receptor links sympathetic nerves to T cell exhaustion
Globig, A.-M., Zhao, S., Roginsky, J., Maltez, V. I., Güiza, J., Avina-Ochoa, N., Heeg, M., Hoffmann, F. A., Chaudhary, O., Wang, J., et al. (2023) · Nature · doi:10.1038/s41586-023-06568-6 · Cited by 331
Zhao, Y., Chen, J., Andreatta, M., Feng, B., Xie, Y., Wenes, M., Wang, Y., Gao, M., Hu, X., Romero, P. J., et al. (2024) · Nature Biotechnology · doi:10.1038/s41587-023-02060-8 · Cited by 309
Self-citationAndrogen conspires with the CD8 + T cell exhaustion program and contributes to sex bias in cancer
Kwon, H., Schafer, J. M., Song, N., Kaneko, S., Li, A., Xiao, T., Ma, A., Allen, C., Das, K., Zhou, L., et al. (2022) · Science Immunology · doi:10.1126/sciimmunol.abq2630 · Cited by 254
Improved reconstruction of single-cell developmental potential with CytoTRACE 2
Kang, M., Armenteros, J. J. A., Gulati, G. S., Gleyzer, R., Avagyan, S., Brown, E. L., Zhang, W., Usmani, A., Earland, N. J., Wu, Z., et al. (2025) · Nature Methods · doi:10.1038/s41592-025-02857-2 · Cited by 292
Popova, G., Soliman, S. S., Kim, C. N., Keefe, M. G., Hennick, K. M., Jain, S., Li, T., Tejera, D., Shin, D. S., Chhun, B. B., et al. (2021) · Cell stem cell · doi:10.1016/j.stem.2021.08.015 · Cited by 243
A Review of Single-Cell RNA-Seq Annotation, Integration, and Cell–Cell Communication
Cheng, C., Chen, W., Jin, H., & Chen, X. '. (2023) · Cells · doi:10.3390/cells12151970 · Cited by 253
Butenko, S., Nagalla, R. R., Guerrero‐Juarez, C. F., Palomba, F., David, L.-M., Nguyen, R. Q., Gay, D. L., Almet, A. A., Digman, M. A., Nie, Q., et al. (2024) · Nature Communications · doi:10.1038/s41467-024-50072-y · Cited by 236
An atlas of cells in the human tonsil
Massoni-Badosa, R., Aguilar-Fernández, S., Nieto, J. C., Soler-Vila, P., Elosua-Bayés, M., Marchese, D., Kulis, M., Vilas‐Zornoza, A., Bühler, M. M., Rashmi, S., et al. (2024) · Immunity · doi:10.1016/j.immuni.2024.01.006 · Cited by 188
Mitochondrial integrated stress response controls lung epithelial cell fate
Han, S., Lee, M., Shin, Y., Giovanni, R., Chakrabarty, R. P., Herrerias, M. M., Dada, L. A., Flozak, A. S., Reyfman, P. A., Khuder, B., et al. (2023) · Nature · doi:10.1038/s41586-023-06423-8 · Cited by 163
irGSEA: the integration of single-cell rank-based gene set enrichment analysis
Fan, C., Chen, F., Chen, Y., Huang, L., Wang, M., Liu, Y., Wang, Y., Guo, H., Zheng, N., Liu, Y., et al. (2024) · Briefings in Bioinformatics · doi:10.1093/bib/bbae243 · Cited by 168
Cancer cells impair monocyte-mediated T cell stimulation to evade immunity
Elewaut, A., Estivill, G., Bayerl, F., Castillon, L., Novatchkova, M., Pottendorfer, E., Hoffmann-Haas, L., Schönlein, M., Nguyễn, T. C. B., Lauss, M., et al. (2024) · Nature · doi:10.1038/s41586-024-08257-4 · Cited by 167
Multiomic spatial landscape of innate immune cells at human central nervous system borders
Sankowski, R., Süß, P., Benkendorff, A., Böttcher, C., Fernandez-Zapata, C., Chhatbar, C., Cahueau, J., Monaco, G., Gasull, A. D., Khavaran, A., et al. (2024) · Nature Medicine · doi:10.1038/s41591-023-02673-1 · Cited by 156
Early cellular mechanisms of type I interferon-driven susceptibility to tuberculosis
Kotov, D. I., Lee, O. V., Fattinger, S. A., Langner, C. A., Guillen, J. V., Peters, J. M., Moon, A., Burd, E. M., Witt, K. C., Stetson, D. B., et al. (2023) · Cell · doi:10.1016/j.cell.2023.11.002 · Cited by 146
Systematic single-cell pathway analysis to characterize early T cell activation
Bibby, J. A., Agarwal, D., Freiwald, T., Kunz, N., Merle, N. S., West, E. E., Singh, P., Larochelle, A., Chinian, F., Mukherjee, S., et al. (2022) · Cell Reports · doi:10.1016/j.celrep.2022.111697 · Cited by 141
Kang, B., Camps, J., Fan, B., Jiang, H., Ibrahim, M. M., Hu, X., Qin, S., Kirchhoff, D., Chiang, D. Y., Wang, S., et al. (2022) · Genome biology · doi:10.1186/s13059-022-02828-2 · Cited by 142
Metabolic programs of T cell tissue residency empower tumour immunity
Reina-Campos, M., Heeg, M., Kennewick, K., Mathews, I. T., Galletti, G., Luna, V., Nguyen, Q., Huang, H., Milner, J. J., Hu, K. H., et al. (2023) · Nature · doi:10.1038/s41586-023-06483-w · Cited by 132
Distinct myeloid-derived suppressor cell populations in human glioblastoma
Jackson, C., Cherry, C., Bom, S., Dykema, A. G., Wang, R., Thompson, E. A., Zhang, M., Li, R., Ji, Z., Hou, W., et al. (2025) · Science · doi:10.1126/science.abm5214 · Cited by 143
Mosquera, J. V., Auguste, G., Wong, D., Turner, A. W., Hodonsky, C. J., Alvarez-Yela, A. C., Song, Y., Cheng, Q., Lino Cardenas, C. L., Theofilatos, K., et al. (2023) · Cell Reports · doi:10.1016/j.celrep.2023.113380 · Cited by 123
Luo, Y., Xia, Y., Liu, D., Li, X., Li, H., Liu, J., Zhou, D., Dong, Y. J., Li, X., Qian, Y., et al. (2024) · Cell · doi:10.1016/j.cell.2024.06.013 · Cited by 120
Miyoshi, E., Morabito, S., Henningfield, C. M., Das, S., Rahimzadeh, N., Shabestari, S. K., Michael, N., Emerson, N., Reese, F., Shi, Z., et al. (2024) · Nature Genetics · doi:10.1038/s41588-024-01961-x · Cited by 115
An oncogenic phenoscape of colonic stem cell polarization
Qin, X., Rodriguez, F. C., Sufi, J., Vlckova, P., Claus, J., & Tape, C. J. (2023) · Cell · doi:10.1016/j.cell.2023.11.004 · Cited by 124
Brain-wide neuronal circuit connectome of human glioblastoma
Sun, Y. Y., Wang, X., Zhang, D. Y., Zhang, Z., Bhattarai, J. P., Wang, Y., Park, K. H., Dong, W., Hung, Y.-F., Yang, Q., et al. (2025) · Nature · doi:10.1038/s41586-025-08634-7 · Cited by 123
Coulton, A., Murai, J., Qian, D., Thakkar, K., Lewis, C. E., & Litchfield, K. (2024) · Nature Communications · doi:10.1038/s41467-024-49885-8 · Cited by 125
Tissue-resident memory CD8 T cell diversity is spatiotemporally imprinted
Reina‐Campos, M., Monell, A., Ferry, A., Luna, V., Cheung, K. P., Galletti, G., Scharping, N. E., Takehara, K. K., Quon, S., Challita, P. P., et al. (2025) · Nature · doi:10.1038/s41586-024-08466-x · Cited by 111
Liu, X., Hogg, G. D., Zuo, C., Borcherding, N. C., Baer, J. M., Lander, V. E., Kang, L., Knolhoff, B. L., Ahmad, F. F., Osterhout, R. E., et al. (2023) · Cancer Cell · doi:10.1016/j.ccell.2023.04.018 · Cited by 108
Li, G., Liu, L., Lu, T., Sui, Y., Zhang, C., Wang, Y., Zhang, T., Xie, Y., Xiao, P., Zhao, Z., et al. (2023) · Nature Communications · doi:10.1038/s41467-023-41950-y · Cited by 101
Song, J., Zhang, Y., Frieler, R. A., Andren, A. C., Wood, S. C., Tyrrell, D. J., Sajjakulnukit, P., Deng, J. C., Lyssiotis, C. A., Mortensen, R. M., et al. (2023) · Journal of Clinical Investigation · doi:10.1172/jci173034 · Cited by 100
A liver immune rheostat regulates CD8 T cell immunity in chronic HBV infection
Bosch, M., Kallin, N., Donakonda, S., Zhang, J. D., Wintersteller, H., Hegenbarth, S., Heim, K., Ramirez, C., Fürst, A., Lattouf, E. I., et al. (2024) · Nature · doi:10.1038/s41586-024-07630-7 · Cited by 97
scGate: marker-based purification of cell types from heterogeneous single-cell RNA-seq datasets
Andreatta, M., Berenstein, A. J., & Carmona, S. (2021) · bioRxiv · doi:10.1093/bioinformatics/btac141 · Cited by 82
Self-citationZhang, J., Wang, Y., Fan, M., Guan, Y., Zhang, W., Huang, F., Zhang, Z., Li, X., Yuan, B., Liu, W., et al. (2024) · Cell Metabolism · doi:10.1016/j.cmet.2024.05.008 · Cited by 94
Mazet, J. M., Mahale, J. N., Tong, O., Watson, R. A., Lechuga‐Vieco, A. V., Pirgova, G., Lau, V. W. C., Attar, M., Koneva, L. A., Sansom, S. N., et al. (2023) · Nature Communications · doi:10.1038/s41467-023-35948-9 · Cited by 99
McEvoy, C. M., Murphy, J. M., Zhang, L., Clotet‐Freixas, S., Mathews, J. A., An, J., Karimzadeh, M., Pouyabahar, D., Su, S., Zaslaver, O., et al. (2022) · Nature Communications · doi:10.1038/s41467-022-35297-z · Cited by 93
Herzog, B. H., Baer, J. M., Borcherding, N. C., Kingston, N. L., Belle, J. I., Knolhoff, B. L., Hogg, G. D., Ahmad, F. F., Kang, L., Petrone, J., et al. (2023) · Science Translational Medicine · doi:10.1126/scitranslmed.adh8005 · Cited by 92
Chemotherapy induces myeloid-driven spatially confined T cell exhaustion in ovarian cancer
Launonen, I.-M. P., Niemiec, I., Hincapié-Otero, M. M., Erkan, E. P., Junquera, A., Afenteva, D., Falco, M. M., Liang, Z., Salko, M., Chamchougia, F., et al. (2024) · Cancer Cell · doi:10.1016/j.ccell.2024.11.005 · Cited by 103
A pan-cancer single-cell RNA-seq atlas of intratumoral B cells
Fitzsimons, E., Qian, D., Enica, A., Thakkar, K., Augustine, M., Gamble, S., Reading, J. L., & Litchfield, K. (2024) · Cancer Cell · doi:10.1016/j.ccell.2024.09.011 · Cited by 88
Reschke, R., Shapiro, J. W., Yu, J., Rouhani, S. J., Olson, D. J., Zha, Y., & Gajewski, T. F. (2022) · Cancer Immunology Research · doi:10.1158/2326-6066.cir-22-0362 · Cited by 82
Chromatin plasticity predetermines neuronal eligibility for memory trace formation
Santoni, G., Astori, S., Leleu, M., Glauser, L., Zamora, S. A., Schioppa, M., Tarulli, I., Sandi, C., & Gräff, J. (2024) · Science · doi:10.1126/science.adg9982 · Cited by 81
Prediction of tumor-reactive T cell receptors from scRNA-seq data for personalized T cell therapy
Tan, C. L., Lindner, K. A. M., Boschert, T., Meng, Z., Rodriguez-Ehrenfried, A., Roia, A. D., Haltenhof, G., Faenza, A., Imperatore, F., Bunse, L., et al. (2024) · Nature Biotechnology · doi:10.1038/s41587-024-02161-y · Cited by 94
Cohen, M., Brumwell, A. N., Ho, T. C., Garakani, K., Montas, G., Leong, D., Ding, V. W., Golden, J. A., Trinh, B. N., Jablons, D. M., et al. (2024) · Journal of Clinical Investigation · doi:10.1172/jci174598 · Cited by 91
Guimarães, G. R., Maklouf, G. R., Teixeira, C. E., Santos, L. D. O., Tessarollo, N. G., de Toledo, N. E., Serain, A. F., de Lanna, C. A., Pretti, M. A. M., da Cruz, J. G. V., et al. (2024) · Nature Communications · doi:10.1038/s41467-024-49916-4 · Cited by 93
Roider, T., Baertsch, M., Fitzgerald, D., Vöhringer, H. S., Brinkmann, B. J., Czernilofsky, F., Knoll, M., Cid, L. L., Mathioudaki, A., Faßbender, B., et al. (2024) · Nature Cell Biology · doi:10.1038/s41556-024-01358-2 · Cited by 81
CD200+ fibroblasts form a pro-resolving mesenchymal network in arthritis
Rauber, S., Mohammadian, H., Schmidkonz, C., Atzinger, A., Soare, A., Treutlein, C., Kemble, S., Mahony, C. B., Geisthoff, M., Angeli, M. R., et al. (2024) · Nature Immunology · doi:10.1038/s41590-024-01774-4 · Cited by 83
Liu, X., Wang, X. M., Yang, Q., Luo, L., Liu, Z., Ren, X., Lei, K., Li, S., Xie, Z., Zheng, G., et al. (2024) · Cancer Research · doi:10.1158/0008-5472.can-23-2123 · Cited by 80
Phagocytosis increases an oxidative metabolic and immune suppressive signature in tumor macrophages
Gonzalez, M. A., Lu, D., Yousefi, M., Kroll, A. V., Lo, C. H., Briseño, C. G., Watson, J. E. V., Novitskiy, S. V., Arias, V., Zhou, H., et al. (2023) · The Journal of Experimental Medicine · doi:10.1084/jem.20221472 · Cited by 75
Spatiotemporal molecular dynamics of the developing human thalamus
Kim, C. N., Shin, D., Wang, A., & Nowakowski, T. J. (2023) · Science · doi:10.1126/science.adf9941 · Cited by 78
Xu, L., Saunders, K., Huang, S.-P., Knútsdóttir, H., Martinez-Algarin, K., Terrazas, I., Chen, K., McArthur, H., Maués, J., Hodgdon, C., et al. (2024) · Cell Reports Medicine · doi:10.1016/j.xcrm.2024.101511 · Cited by 84
Semi-supervised integration of single-cell transcriptomics data
Andreatta, M., Hérault, L., Gueguen, P., Gfeller, D., Berenstein, A. J., & Carmona, S. J. (2024) · Nature Communications · doi:10.1038/s41467-024-45240-z · Cited by 75
Self-citationDecoder-seq enhances mRNA capture efficiency in spatial RNA sequencing
Cao, J., Zheng, Z., Sun, D., Chen, X., Cheng, R., Lv, T., An, Y., Zheng, J., Song, J., Wu, L., et al. (2024) · Nature Biotechnology · doi:10.1038/s41587-023-02086-y · Cited by 71
Tillé, L., Cropp, D., Charmoy, M., Reichenbach, P., Andreatta, M., Wyss, T., Bodley, G., Crespo, I., Nassiri, S., Lourenço, J., et al. (2023) · Nature Immunology · doi:10.1038/s41590-023-01614-x · Cited by 74
Self-citationSenabouth, A., Daniszewski, M., Lidgerwood, G. E., Liang, H. H., Hernández, D., Mirzaei, M., Keenan, S. N., Zhang, R., Han, X., Neavin, D. R., et al. (2022) · Nature Communications · doi:10.1038/s41467-022-31707-4 · Cited by 75
Peng, X., Sun, B., Tang, C., Shi, C., Xie, X., Wang, X., Jiang, D., Li, S., Jia, Y., Tang, H., et al. (2024) · Developmental Cell · doi:10.1016/j.devcel.2024.12.011 · Cited by 71
Lei, P., Pereira, E. R., Andersson, P., Amoozgar, Z., van Wijnbergen, J. W., O’Melia, M. J., Zhou, H., Chatterjee, S., Ho, W. W., Posada, J. M., et al. (2023) · The Journal of Experimental Medicine · doi:10.1084/jem.20221847 · Cited by 71
Veniaminova, N. A., Jia, Y. Y., Hartigan, A. M., Huyge, T. J., Tsai, S.-Y., Grachtchouk, M. A., Nakagawa, S., Dlugosz, A. A., Atwood, S. X., & Wong, S. Y. (2023) · Cell Reports · doi:10.1016/j.celrep.2023.113121 · Cited by 65
Transcriptional census of epithelial-mesenchymal plasticity in cancer
Cook, D. P., & Vanderhyden, B. C. (2022) · Science Advances · doi:10.1126/sciadv.abi7640 · Cited by 59
Yabo, Y. A., Moreno‐Sanchez, P. M., Pires‐Afonso, Y., Kaoma, T., Nosirov, B., Scafidi, A., Ermini, L., Lipsa, A., Oudin, A., Kyriakis, D., et al. (2024) · Genome Medicine · doi:10.1186/s13073-024-01321-8 · Cited by 61
A reference single-cell regulomic and transcriptomic map of cynomolgus monkeys
Qu, J., Yang, F., Zhu, T., Wang, Y., Fang, W., Ding, Y., Zhao, X. F., Qi, X., Xie, Q.-M., Chen, M., et al. (2022) · Nature Communications · doi:10.1038/s41467-022-31770-x · Cited by 62
Zhou, Y., Tada, M., Cai, Z., Andhey, P. S., Swain, A., Miller, K. R., Gilfillan, S., Artyomov, M. N., Takao, M., Kakita, A., et al. (2023) · Nature Immunology · doi:10.1038/s41590-022-01403-y · Cited by 62
Kim, H., Park, S., Han, K.-Y., Lee, N., Kim, H. M., Jung, H. A., Sun, J., Ahn, J. S., Ahn, M., Lee, S., et al. (2023) · Journal for ImmunoTherapy of Cancer · doi:10.1136/jitc-2022-005509 · Cited by 65
Huang, K. Y., Mishra, K., Park, H., Yi, X., Ouyang, J. F., Petretto, E. G., & Behmoaras, J. V. (2023) · eLife · doi:10.7554/elife.85530 · Cited by 68
Disrupting cellular memory to overcome drug resistance
Harmange, G., Hueros, R. A. R., Schaff, D. L., Emert, B. L., Saint-Antoine, M., Kim, L. C., Niu, Z., Nellore, S., Fane, M. E., Alicea, G. M., et al. (2023) · Nature Communications · doi:10.1038/s41467-023-41811-8 · Cited by 58
Castellanos-Rueda, R., Roberto, R. B. D., Bieberich, F., Schlatter, F. S., Palianina, D., Nguyen, O. T. P., Kapetanovic, E., Laubli, H. P., Hierlemann, A. R., Khanna, N., et al. (2022) · Nature Communications · doi:10.1038/s41467-022-34141-8 · Cited by 61
Jing, S., Liu, D., Feng, N., Dong, H., Wang, H.-Q., Yan, X., Chen, X., Qu, M., Lin, P., Yi, B., et al. (2024) · Genome Medicine · doi:10.1186/s13073-024-01367-8 · Cited by 61
Henriques, A. R., Salvany, M., Nieto, P., Palomo‐Ponce, S., Sevillano, M., Hernando‐Momblona, X., Guerra, E. M., Llanses, M., Haak, E., Nieto, J. C., et al. (2025) · Nature Genetics · doi:10.1038/s41588-025-02380-2 · Cited by 63
Decoding the gene regulatory network of endosperm differentiation in maize
Yuan, Y., Huo, Q., Zhang, Z., Wang, Q., Wang, J., Chang, S., Cai, P., Song, K., Galbraith, D. W., Zhang, W., et al. (2024) · Nature Communications · doi:10.1038/s41467-023-44369-7 · Cited by 59
Jiang, L., Dalgarno, C., Papalexi, E., Mascio, I., Wessels, H., Yun, H., Iremadze, N., Lithwick‐Yanai, G., Lipson, D., & Satija, R. (2025) · Nature Cell Biology · doi:10.1038/s41556-025-01622-z · Cited by 77
Reck, M., Baird, D., Veizades, S. A., Sutherland, C., Bell, R. M. B., Hur, H., Cairns, C., Janas, P. P., Campbell, R., Nam, A., et al. (2025) · Nature Communications · doi:10.1038/s41467-025-59997-4 · Cited by 72
Paradoxical Activation of Oncogenic Signaling as a Cancer Treatment Strategy
Dias, M. H., Friskes, A., Wang, S., Neto, J. M. F., van Gemert, F. P. A., Mourragui, S. M. C., Papagianni, C., Kuiken, H. J., Mainardi, S., Villanueva, D. A., et al. (2024) · Cancer Discovery · doi:10.1158/2159-8290.cd-23-0216 · Cited by 63
An alternative cell cycle coordinates multiciliated cell differentiation
Choksi, S. P., Byrnes, L. E., Konjikusic, M. J., Tsai, B. W. H., Deleon, R., Lü, Q., Westlake, C. J., & Reiter, J. F. (2024) · Nature · doi:10.1038/s41586-024-07476-z · Cited by 61
MarsGT: Multi-omics analysis for rare population inference using single-cell graph transformer
Wang, X., Duan, M., Li, J., Ma, A., Xin, G., Xu, D. H., Li, Z., Liu, B., & Ma, Q. (2024) · Nature Communications · doi:10.1038/s41467-023-44570-8 · Cited by 53
CD163 + Macrophages Induce Endothelial-to-Mesenchymal Transition in Atheroma
Mori, M., Sakamoto, A., Kawakami, R., Guo, L., Slenders, L., Mosquera, J. V., Ghosh, S., Wesseling, M., Shiraki, T., Bellissard, A., et al. (2024) · Circulation Research · doi:10.1161/circresaha.123.324082 · Cited by 57
Fetahu, I. S., Esser‐Skala, W., Dnyansagar, R., Sindelar, S., Rifatbegovic, F., Bileck, A., Skos, L., Bozsaky, E., Lazic, D., Shaw, L. E., et al. (2023) · Nature Communications · doi:10.1038/s41467-023-39210-0 · Cited by 60
Li, Z., Zhang, H., Li, Q., Feng, W., Jia, X., Zhou, R., Huang, Y., Li, Y., Hu, Z., Hu, X., et al. (2023) · Scientific Data · doi:10.1038/s41597-023-02257-1 · Cited by 55
Fandrei, D., Seiffert, S., Rade, M., Rieprecht, S., Gagelmann, N., Born, P., Wiemers, T. C., Weidner, H., Kreuz, M., Schassberger, T., et al. (2024) · Blood Cancer Discovery · doi:10.1158/2643-3230.bcd-24-0118 · Cited by 53
Macrophages harness hepatocyte glutamate to boost liver regeneration
Rigual, M. D. M., Angulo-Aguado, M., Zagorac, S., Álvarez-Díaz, R., Benítez-Mondéjar, M., Yi, F., Martínez-Garay, C., Santos-de-Frutos, K., Kim, E., Campos-Olivas, R., et al. (2025) · Nature · doi:10.1038/s41586-025-08778-6 · Cited by 53
Tao, S., Yu, H., You, T., Kong, X., Wei, X., Zheng, Z., Zheng, L., Feng, Z., Huang, B. H., Zhang, X., et al. (2023) · ACS Nano · doi:10.1021/acsnano.3c03828 · Cited by 55
Sarieva, K., Kagermeier, T., Khakipoor, S., Atay, E., Yentür, Z., Becker, K., & Mayer, S. (2023) · Molecular Psychiatry · doi:10.1038/s41380-023-01997-1 · Cited by 52
Yang, J., Zhang, N., Luo, T., Yang, M., Shen, W., Tan, Z., Xia, Y., Zhang, L., Zhou, X., Lei, Q., et al. (2024) · iMeta · doi:10.1002/imt2.231 · Cited by 58
Myeloid progenitor dysregulation fuels immunosuppressive macrophages in tumours
Hegde, S., Giotti, B., Soong, B. Y., Halász, L., Bérichel, J. L., Schaefer, M. M., Kloeckner, B., Mattiuz, R., Park, M. D., Magen, A., et al. (2025) · Nature · doi:10.1038/s41586-025-09493-y · Cited by 52
Andrieux, G., Das, T., Griffin, M., Straehle, J., Paine, S., Beck, J., Boerries, M., Heiland, D. H., Smith, S. J., Rahman, R., et al. (2023) · Genome Medicine · doi:10.1186/s13073-023-01207-1 · Cited by 52
Chen, G., Qi, H., Jiang, L., Sun, S., Zhang, J., Yu, J., Liu, F., Zhang, Y., & Du, S. (2024) · Journal of Translational Medicine · doi:10.1186/s12967-024-05934-w · Cited by 50
Andreatta, M., Sherman, Z., Tjitropranoto, A., Kelly, M. C., Ciucci, T., & Carmona, S. J. (2022) · eLife · doi:10.7554/elife.76339 · Cited by 52
Self-citationInterferon-γ couples CD8+ T cell avidity and differentiation during infection
Uhl, L. F. K., Cai, H., Oram, S. L., Mahale, J. N., MacLean, A. J., Mazet, J. M., Piccirilli, T., He, A. J., Lau, D., Elliott, T. J., et al. (2023) · Nature Communications · doi:10.1038/s41467-023-42455-4 · Cited by 46
Wu, S., Morotti, A. L. M., Yang, J., Wang, E., & Tatsis, E. C. (2024) · Molecular Plant · doi:10.1016/j.molp.2024.08.003 · Cited by 48
Sena, L. A., Kumar, R., Sanin, D. E., Thompson, E. A., Rosen, D. M., Dalrymple, S. L., Antony, L., Yang, Y., Gomes‐Alexandre, C., Hicks, J. L., et al. (2022) · Journal of Clinical Investigation · doi:10.1172/jci162396 · Cited by 46
Papargyriou, A., Najajreh, M., Cook, D. P., Maurer, C. H., Bärthel, S., Messal, H. A., Ravichandran, S. K., Richter, T., Knolle, M. A., Metzler, T., et al. (2024) · Nature Biomedical Engineering · doi:10.1038/s41551-024-01273-9 · Cited by 45
Age-associated nicotinamide adenine dinucleotide decline drives CAR-T cell failure
Hope, H. C., de Sostoa, J., Ginefra, P., Andreatta, M., Chiang, Y.-H., Ronet, C., Pich-Bavastro, C., Corría-Osorio, J., Kuonen, F., Auwerx, J. H., et al. (2025) · Nature Cancer · doi:10.1038/s43018-025-00982-7 · Cited by 50
Self-citationDifferential activity of MAPK signalling defines fibroblast subtypes in pancreatic cancer
Veghini, L., Pasini, D., Fang, R., Delfino, P., Filippini, D., Neander, C., Vicentini, C., Fiorini, E., Lupo, F., D’Agosto, S. L., et al. (2024) · Nature Communications · doi:10.1038/s41467-024-54975-8 · Cited by 46
Distinct components of mRNA vaccines cooperate to instruct efficient germinal center responses
Castaño, D., Bettini, E., Kumar, B., Chudnovskiy, A., Siv, A., Protti, G., Nakandakari-Higa, S., Ceglia, S., Luna, N. D., Chiu, J. E., et al. (2025) · Cell · doi:10.1016/j.cell.2025.11.023 · Cited by 44
Surface CD52, CD84, and PTGER2 mark mature PMN-MDSCs from cancer patients and G-CSF-treated donors
Pettinella, F., Mariotti, B., Lattanzi, C., Bruderek, K., Donini, M., Costa, S. E., Marini, O., Iannoto, G., Gasperini, S., Caveggion, E., et al. (2024) · Cell Reports Medicine · doi:10.1016/j.xcrm.2023.101380 · Cited by 45
Zhao, S., Zhang, P., Niu, S., Xie, J., Liu, Y., Liu, Y., Zhao, N., Cheng, C., & Lu, P. (2024) · Functional & Integrative Genomics · doi:10.1007/s10142-024-01356-5 · Cited by 44
Uveal melanoma immunogenomics predict immunotherapy resistance and susceptibility
Leonard‐Murali, S., Bhaskarla, C., Yadav, G. S., Maurya, S. K., Galiveti, C. R., Tobin, J. A., Kann, R. J., Ashwat, E., Murphy, P. S., Chakka, A. B., et al. (2024) · Nature Communications · doi:10.1038/s41467-024-46906-4 · Cited by 45
AAV capsid prioritization in normal and steatotic human livers maintained by machine perfusion
Kim, J.-J., Kurial, S. N. T., Choksi, P. K., Nunez, M., Lunow-Luke, T., Bartel, J., Driscoll, J., Her, C. L., Dhillon, S., Yue, W., et al. (2025) · Nature Biotechnology · doi:10.1038/s41587-024-02523-6 · Cited by 46
Dietary protein shapes the profile and repertoire of intestinal CD4+ T cells
Lockhart, A. A. K., Reed, A. C., Castro, T. B. R., Herman, C., Canesso, M. C. C., & Mucida, D. (2023) · The Journal of Experimental Medicine · doi:10.1084/jem.20221816 · Cited by 40
Braun, T., Rade, M., Merz, M., Klepzig, H., Große, F., Fandrei, D., Pham, N.-N., Kreuz, M., Kuhn, C. K., Kuschel, F., et al. (2025) · Nature Medicine · doi:10.1038/s41591-025-03499-9 · Cited by 47
Borcherding, N. C., Kim, W., Quinn, M. A., Han, F., Zhou, J. Q., Sturtz, A. J., Schmitz, A. J., Lei, T., Schattgen, S., Klebert, M. K., et al. (2024) · Nature Immunology · doi:10.1038/s41590-024-01888-9 · Cited by 36
Metadata
- Authors
- Andreatta, M., & Carmona, S. J.
- Affiliations
- SIB Swiss Institute of Bioinformatics (CH)
- Corresponding author
- Andreatta, Massimo
- Venue
- Computational and Structural Biotechnology Journal
- Published
- 2021-01
- Volume
- 19
- Pages
- 3796-3798
- ISSN
- 2001-0370 (ISSN-L)
- PMC
- PMC8271111
- OpenAlex
- W3174072032
- Cited by
- 1,104
- References
- 12
- Citations by year
- 2026: 355 · 2025: 337 · 2024: 255 · 2023: 111 · 2022: 39 · 2021: 6
- FWCI
- 36.03
- Type
- journal article
- Language
- en
- Open access
- gold
- doi.org
- Licence
- Locations
- Computational and Structural Biotechnology Journal (publishedVersion, cc-by)
- bioRxiv (Cold Spring Harbor Laboratory) (acceptedVersion, cc-by)
- PubMed Central (publishedVersion, cc-by)
- PubMed (publishedVersion)
- SERVAL (Université de Lausanne) (publishedVersion, cc-by)
- IRIS (submittedVersion, cc-by)
- DOAJ (DOAJ: Directory of Open Access Journals) (submittedVersion, cc-by-sa)
- Funders
- Schweizerischer Nationalfonds zur Förderung der Wissenschaftlichen Forschung (180010)
- Topics
- Life Sciences › Biochemistry, Genetics and Molecular Biology › Molecular Biology › Single-cell and spatial transcriptomics
- Life Sciences › Biochemistry, Genetics and Molecular Biology › Molecular Biology › Gene expression and cancer classification
- Life Sciences › Biochemistry, Genetics and Molecular Biology › Molecular Biology › Bioinformatics and Genomic Networks
- Keywords
- single-cell RNA sequencing, R package, computational efficiency, scalability, biological heterogeneity
About these checks
Registry, retraction, Cites and statistics results are computed, not judged, with one exception: a printed reference that no index lists is read once by a model before it counts as a citation error. Claims are extracted by a model and kept only when their quote appears verbatim in the text; each cited source is then checked, with a model’s help, for whether it says what the claim relies on. Those verdicts can be wrong — read the claim’s quote and the cited source before relying on one.
Statistics and arithmetic are recomputed, not judged.
Confidence bands are shown only for fields calibrated on our annotated test set. None is calibrated yet, so no band is shown.
What counts as a claim ›How we measure confidence ›How we check this ›
Are you an author, or do you see a problem with this page? Request a review
