

The DOI matches its Crossref record; 53 of the 53 references it cites were found in a registry or an index.
Mixing plant-based proteins: Gel properties of hemp, pea, lentil proteins and their binary mixtures
Abstract
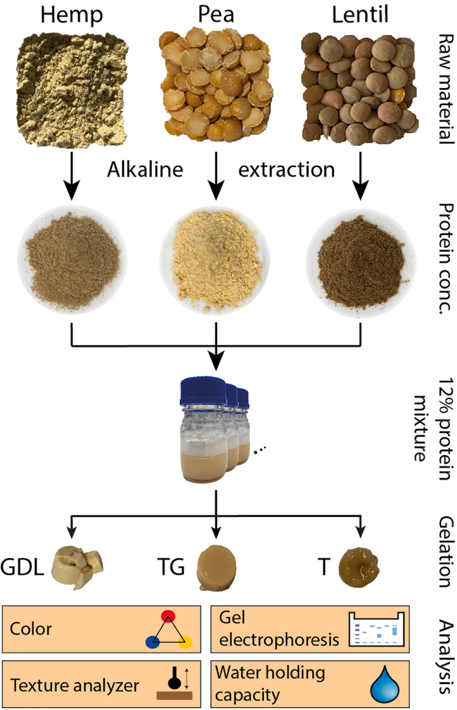
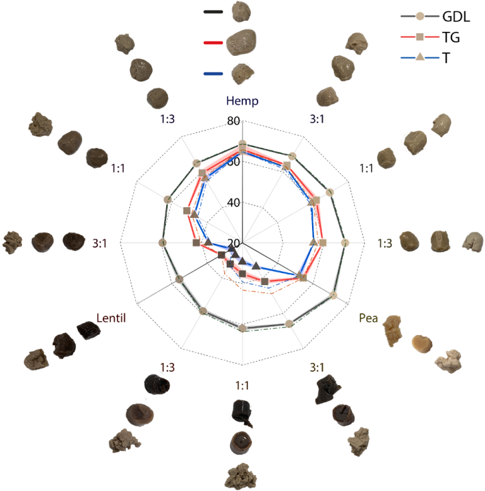
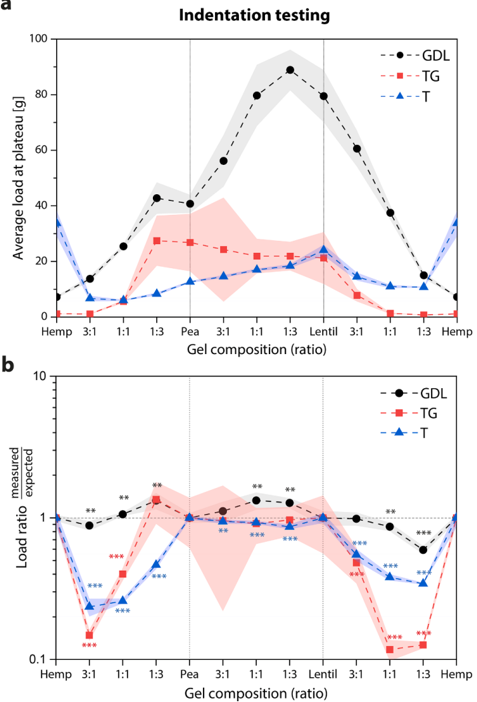
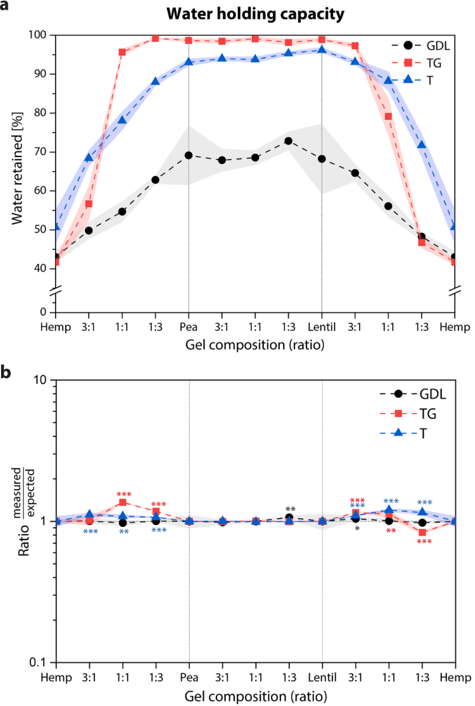
One of the challenges in substituting dairy products by alternative proteins is that the properties of mixed protein gels cannot necessarily be predicted by those of single protein gels, whereas the need of mixing is often driven by nutritional aspects. However, mixing plant proteins could also open a door to new textures. The main goal of this study was to investigate the impact of binary mixing of hemp (H), yellow pea (P), and brown lentil (L) protein concentrates/isolates on their gel and water-holding properties. Dispersions of reconstituted proteins and mixtures thereof were gelled using glucono-δ-lactone (GDL), transglutaminase (TG), and temperature (T) at a protein content of 12% (w/w). Mixtures of pea and lentil proteins showed gel strengths for TG- and T-induced gels that are proportional to the ratio of the mixture constituents (linear mixing behavior), whereas synergistic effects were observed for GDL-induced gelation. In contrast, all mixtures containing hemp exhibited a non-linear mixing behavior for the three gelation methods, usually resulting in lower gel strengths compared to theoretically expected values. The study showed that mixing plant-based proteins of different protein sources can lead to very different mixing behaviors in terms of gel properties, showing either a reinforcing, an indifferent or a weakening effect compared to the theoretically expected properties. The results can help developing more targeted plant protein-based soft gel products such as yogurt alternatives with specific techno-functional properties, while adjusting the nutritional characteristics.
Overview
The claims and statistics of this paper haven’t been checked yet.
Run the check — free, no account needed. It reads the open-access text and checks the sources it cites.
Integrity signals
Registry
Cites
Statistics
Figures
Verification
Claims the paper makes
The claims and statistics of this paper haven’t been checked yet.
Run the check — free, no account needed. It reads the open-access text and checks the sources it cites.
Claims other papers make about this one
Each is checked against this paper’s own text: does it say what the citing paper says it does?
The cited source says what the claim attributes to it.
In the citing paper
“Additionally, some studies indicated that the source and composition of plant proteins also affect gelling properties ( James and Yang 2016; Guidi et al. 2022).”
From A Review of Gelation of Plant Proteins and Their Influencing Factors (2025) · cites this paper as Guidi et al. 2022
Self-check
Percentages, sums and reported differences re-computed from the paper’s own numbers.
The self-check needs the paper’s full text.
Citations
Cites
MMseqs2 enables sensitive protein sequence searching for the analysis of massive data sets
Steinegger, M., & Söding, J. (2017) · Nature Biotechnology · doi:10.1038/nbt.3988 · Cited by 4,840
Khoo, H. E., Azlan, A., Tang, S. T., & Lim, S. M. (2017) · Food & Nutrition Research · doi:10.1080/16546628.2017.1361779 · Cited by 3,205
Converting Nitrogen into Protein—Beyond 6.25 and Jones' Factors
Mariotti, F., Tomé, D., & Mirand, P. P. (2008) · Critical Reviews in Food Science and Nutrition · doi:10.1080/10408390701279749 · Cited by 1,400
Protein content and amino acid composition of commercially available plant-based protein isolates
Gorissen, S. H. M., Crombag, J. J. R., Senden, J. M. G., Waterval, W. A. H., Bierau, J., Verdijk, L. B., & van Loon, L. J. C. (2018) · Amino Acids · doi:10.1007/s00726-018-2640-5 · Cited by 1,169
Plant-based milk alternatives an emerging segment of functional beverages: a review
Sethi, S., Tyagi, S. K., & Anurag, R. K. (2016) · Journal of Food Science and Technology · doi:10.1007/s13197-016-2328-3 · Cited by 1,097
Hempseed as a nutritional resource: An overview
Callaway, J. C. (2004) · Euphytica · doi:10.1007/s10681-004-4811-6 · Cited by 910
Pea protein isolates: Structure, extraction, and functionality
Lam, A. C. Y., Can Karaca, A., Tyler, R. T., & Nickerson, M. T. (2018) · Food Reviews International · doi:10.1080/87559129.2016.1242135 · Cited by 902
Composition, physicochemical properties of pea protein and its application in functional foods
Lu, Z. X., He, J. F., Zhang, Y. C., & Bing, D. J. (2020) · Critical Reviews in Food Science and Nutrition · doi:10.1080/10408398.2019.1651248 · Cited by 529
A review of physical and chemical protein-gel induction
Totosaus, A., Montejano, J. G., Salazar, J. A., & Guerrero, I. (2002) · International Journal of Food Science and Technology · doi:10.1046/j.1365-2621.2002.00623.x · Cited by 488
Physicochemical and Functional Properties of Hemp ( Cannabis sativa L.) Protein Isolate
Tang, C.-H., Ten, Z., Wang, X.-S., & Yang, X.-Q. (2006) · Journal of Agricultural and Food Chemistry · doi:10.1021/jf0619176 · Cited by 405
Food Gels: Gelling Process and New Applications
Banerjee, S., & Bhattacharya, S. (2012) · Critical Reviews in Food Science and Nutrition · doi:10.1080/10408398.2010.500234 · Cited by 388
Wang, X.-S., Tang, C.-H., Yang, X.-Q., & Gao, W.-R. (2008) · Food Chemistry · doi:10.1016/j.foodchem.2007.06.064 · Cited by 296
Li, J., Wu, M., Wang, Y., Li, K., Du, J., & Bai, Y. (2020) · Food Chemistry · doi:10.1016/j.foodchem.2020.126921 · Cited by 293
Composition, Physicochemical and Sensorial Properties of Commercial Plant-Based Yogurts
Grasso, N., Alonso-Miravalles, L., & O’Mahony, J. A. (2020) · Foods · doi:10.3390/foods9030252 · Cited by 284
Sun, X. D., & Arntfield, S. D. (2012) · Food Hydrocolloids · doi:10.1016/j.foodhyd.2011.12.014 · Cited by 279
Microbial transglutaminase-a review of its production and application in food processing
Zhu, Y., Rinzema, A., TRAMPER, J., & Bol, J. B. (1995) · Applied Microbiology and Biotechnology · doi:10.1007/bf00169916 · Cited by 273
Structural and Functional Properties of Hemp Seed Protein Products
Malomo, S. A., He, R., & Aluko, R. E. (2014) · Journal of Food Science · doi:10.1111/1750-3841.12537 · Cited by 272
Seed Protein of Lentils: Current Status, Progress, and Food Applications
Khazaei, H., Subedi, M., Nickerson, M., Martínez-Villaluenga, C., Frias, J., & Vandenberg, A. (2019) · Foods · doi:10.3390/foods8090391 · Cited by 265
Wu, M., Xiong, Y. L., Chen, J., Tang, X., & Zhou, G. (2009) · Journal of Food Science · doi:10.1111/j.1750-3841.2009.01140.x · Cited by 261
Extraction methods significantly impact pea protein composition, structure and gelling properties
Yang, J., Zamani, S., Liang, L., & Chen, L. (2021) · Food Hydrocolloids · doi:10.1016/j.foodhyd.2021.106678 · Cited by 252
Jarpa–Parra, M., Bamdad, F., Wang, Y., Tian, Z., Temelli, F., Han, J., & Chen, L. (2014) · LWT · doi:10.1016/j.lwt.2014.02.035 · Cited by 229
Hadnađev, M., Dapčević-Hadnađev, T., Lazaridou, A., Moschakis, T., Michaelidou, A. M., Popović, S., & Biliaderis, C. G. (2018) · Food Hydrocolloids · doi:10.1016/j.foodhyd.2017.12.015 · Cited by 229
Processing, Nutrition, and Functionality of Hempseed Protein: A Review
Wang, Q., & Xiong, Y. L. (2019) · Comprehensive Reviews in Food Science and Food Safety · doi:10.1111/1541-4337.12450 · Cited by 229
Vargas, M., Cháfer, M., Albors, A., Chiralt, A., & González‐Martínez, C. (2008) · International Dairy Journal · doi:10.1016/j.idairyj.2008.06.007 · Cited by 190
Ben-Harb, S., Panouillé, M., Huc-Mathis, D., Moulin, G., Saint‐Eve, A., Irlinger, F., Bonnarme, P., Michon, C., & Souchon, I. (2017) · Food Hydrocolloids · doi:10.1016/j.foodhyd.2017.09.022 · Cited by 188
Identification of the acidic and basic subunit complexes of glycinin.
Staswick, P., Hermodson, M. A., & Nielsen, N. C. (1981) · Journal of Biological Chemistry · doi:10.1016/s0021-9258(19)68908-8 · Cited by 179
Global production, processing and utilization of lentil: A review
Joshi, M., Timilsena, Y. P., & Adhikari, B. (2017) · Journal of Integrative Agriculture · doi:10.1016/s2095-3119(17)61793-3 · Cited by 179
Lin, D., Zhang, L., Li, R., Zheng, B., Rea, M. C., & Miao, S. (2019) · Food Hydrocolloids · doi:10.1016/j.foodhyd.2019.05.043 · Cited by 143
Lee, H., Lu, Y., Zhang, Y., Fu, C., & Huang, D. (2021) · Food Chemistry · doi:10.1016/j.foodchem.2021.129749 · Cited by 141
Functional properties of protein isolates from different pea cultivars
Stone, A. K., Avarmenko, N. A., Warkentin, T. D., & Nickerson, M. T. (2015) · Food Science and Biotechnology · doi:10.1007/s10068-015-0107-y · Cited by 139
Mixing whey and soy proteins: Consequences for the gel mechanical response and water holding
Jose, J., Pouvreau, L., & Martin, A. H. (2016) · Food Hydrocolloids · doi:10.1016/j.foodhyd.2016.03.031 · Cited by 117
Gelation properties of soya and whey protein isolate mixtures
Comfort, S., & Howell, N. K. (2002) · Food Hydrocolloids · doi:10.1016/s0268-005x(02)00033-4 · Cited by 110
Rheological properties and microstructure of soy-whey protein
McCann, T. H., Guyon, L., Fischer, P., & Day, L. (2018) · Food Hydrocolloids · doi:10.1016/j.foodhyd.2018.04.023 · Cited by 107
Dube, M., Schäfer, C., Neidhart, S., et al. (2006) · European Food Research and Technology · doi:10.1007/s00217-006-0401-2 · Cited by 97
Sun, X. D., & Arntfield, S. D. (2011) · Journal of Food Engineering · doi:10.1016/j.jfoodeng.2011.03.008 · Cited by 90
Thermal gelation of globular proteins: weight-average molecular weight dependence of gel strength
Wang, C. H., & Damodaran, S. (1990) · Journal of Agricultural and Food Chemistry · doi:10.1021/jf00095a001 · Cited by 89
Wu, C., Wang, T., Ren, C., Ma, W., Wu, D., Xu, X., Wang, L., & Du, M. (2020) · Comprehensive Reviews in Food Science and Food Safety · doi:10.1111/1541-4337.12682 · Cited by 83
Synergistic enhancement in the co-gelation of salt-soluble pea proteins and whey proteins
Wong, D., Vasanthan, T., & Ozimek, L. (2013) · Food Chemistry · doi:10.1016/j.foodchem.2013.05.082 · Cited by 78
How biomass composition determines protein extractability
Sari, Y. W., Syafitri, U. D., Sanders, J. P. M., & Bruins, M. E. (2015) · Industrial Crops and Products · doi:10.1016/j.indcrop.2015.03.020 · Cited by 74
Formation and Stability of Pea Proteins Nanoparticles Using Ethanol-Induced Desolvation
Doan, C. D., & Ghosh, S. (2019) · Nanomaterials · doi:10.3390/nano9070949 · Cited by 73
Ainis, W. N., Ersch, C., & Ipsen, R. (2017) · Food Hydrocolloids · doi:10.1016/j.foodhyd.2017.10.016 · Cited by 71
Sun, X., Sun, Y., Li, Y., Wu, Q., & Wang, L. (2021) · Frontiers in Nutrition · doi:10.3389/fnut.2021.678421 · Cited by 63
Combining plant and dairy proteins in food colloid design
Hinderink, E. B. A., Boire, A., Renard, D., Riaublanc, A., Sagis, L. M. C., Schroën, K. G. P. H., Bouhallab, S., Famelart, M., Gagnaire, V., Guyomarc’H, F., et al. (2021) · Current Opinion in Colloid & Interface Science · doi:10.1016/j.cocis.2021.101507 · Cited by 63
Alavi, F., Emam-djomeh, Z., & Chen, L.-Y. (2020) · Food Hydrocolloids · doi:10.1016/j.foodhyd.2020.105960 · Cited by 58
Plant-based food hydrogels: Constitutive characteristics, formation, and modulation
Zha, F., Rao, J., & Chen, B. (2021) · Current Opinion in Colloid & Interface Science · doi:10.1016/j.cocis.2021.101505 · Cited by 56
Sodini, I., Mattas, J., & Tong, P. S. (2006) · International Dairy Journal · doi:10.1016/j.idairyj.2005.03.014 · Cited by 55
Modulating fracture properties of mixed protein systems
Ersch, C., ter Laak, I., van der Linden, E., et al. (2014) · Food Hydrocolloids · doi:10.1016/j.foodhyd.2014.09.009 · Cited by 41
Buffering capacity of wet texturized plant proteins in comparison to pork meat
Ebert, S., Baune, M., Broucke, K., Royen, G. V., Terjung, N., Gibis, M., & Weiß, J. (2021) · Food Research International · doi:10.1016/j.foodres.2021.110803 · Cited by 31
Afoakwa, E. O. (2014) · Journal of Nutritional Health & Food Engineering · doi:10.15406/jnhfe.2014.01.00012 · Cited by 22
Gosukonda, V., Singh, H., & Gosukonda, R. M. (2020) · Journal of Microbiology Biotechnology and Food Sciences · doi:10.15414/jmbfs.2020.9.4.856-860 · Cited by 20
Kinetic study on the irreversible thermal denaturation of lentil lectin
Shnyrov, V. L., Marcos, M. J., & Villar, E. (1996) · IUBMB Life · doi:10.1080/15216549600201711 · Cited by 17
Texture modification of soy-based products
Guo, J., & Yang, X. (2015) · Elsevier eBooks · doi:10.1016/b978-1-78242-333-1.00011-5 · Cited by 16
Research works printed but not linked: 1
- Liu, 2022, Composition and Functional Properties of Hemp Seed Protein Isolates from Various Hemp Cultivars (preprint), Biochemistry
Cited by
Effect of pH-shifting and ultrasound on soy/potato protein structure and gelation
Sun, Y., Wang, L., Wang, H., Zhou, B., Jiang, L., & Zhu, X. (2025) · Food Hydrocolloids · doi:10.1016/j.foodhyd.2024.110672 · Cited by 106
Zhou, H., Hu, X., Xiang, X., & McClements, D. J. (2023) · Food Hydrocolloids · doi:10.1016/j.foodhyd.2023.108909 · Cited by 105
A Review of Gelation of Plant Proteins and Their Influencing Factors
Hui, D., Liang, W., Wang, R., Feng, X., & Tang, X. (2025) · Sustainable Food Proteins · doi:10.1002/sfp2.70037 · Cited by 12
Marinacci, A., Piermaria, J., & Speroni, F. (2024) · Food Biophysics · doi:10.1007/s11483-023-09822-6 · Cited by 10
Metadata
- Authors
- Guidi, S., Formica, F. A., & Denkel, C.
- Venue
- Food Research International
- Publisher
- Elsevier BV
- Published
- 2022-11
- Volume
- 161
- Pages
- 111752
- ISSN
- 0963-9969
- Cited by
- 83
- References
- 53
- Language
- en
- Licence
- www.elsevier.com/tdm/userlicense/1.0/ (tdm)
- www.elsevier.com/legal/tdmrep-license (tdm)
- creativecommons.org/licenses/by/4.0/ (vor)
About these checks
Registry, retraction, Cites and statistics results are computed, not judged, with one exception: a printed reference that no index lists is read once by a model before it counts as a citation error. Claims are extracted by a model and kept only when their quote appears verbatim in the text; each cited source is then checked, with a model’s help, for whether it says what the claim relies on. Those verdicts can be wrong — read the claim’s quote and the cited source before relying on one.
Statistics and arithmetic are recomputed, not judged.
Confidence bands are shown only for fields calibrated on our annotated test set. None is calibrated yet, so no band is shown.
What counts as a claim ›How we measure confidence ›How we check this ›
Are you an author, or do you see a problem with this page? Request a review
Data sources
Bibliographic data: Semantic Scholar, OpenAlex, Crossref.
Contains information from the Semantic Scholar Academic Graph Datasets, made available under the ODC Attribution License (ODC-BY 1.0).
Semantic Scholar’s data is described in: Kinney, R., et al. (2023). The Semantic Scholar Open Data Platform. arXiv:2301.10140.
