

The DOI matches its Crossref record; 28 of the 28 references it cites were found in a registry or an index.
Enhanced Utilization of Induced Pluripotent Stem Cell–Derived Human Intestinal Organoids Using Microengineered Chips
Open accessAbstract
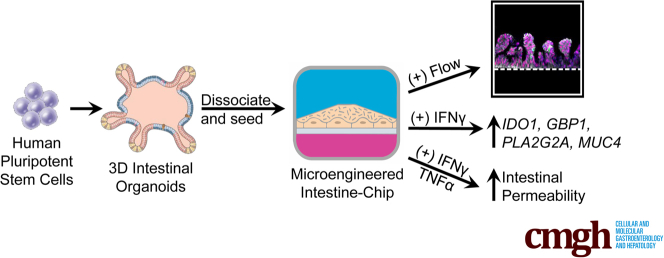
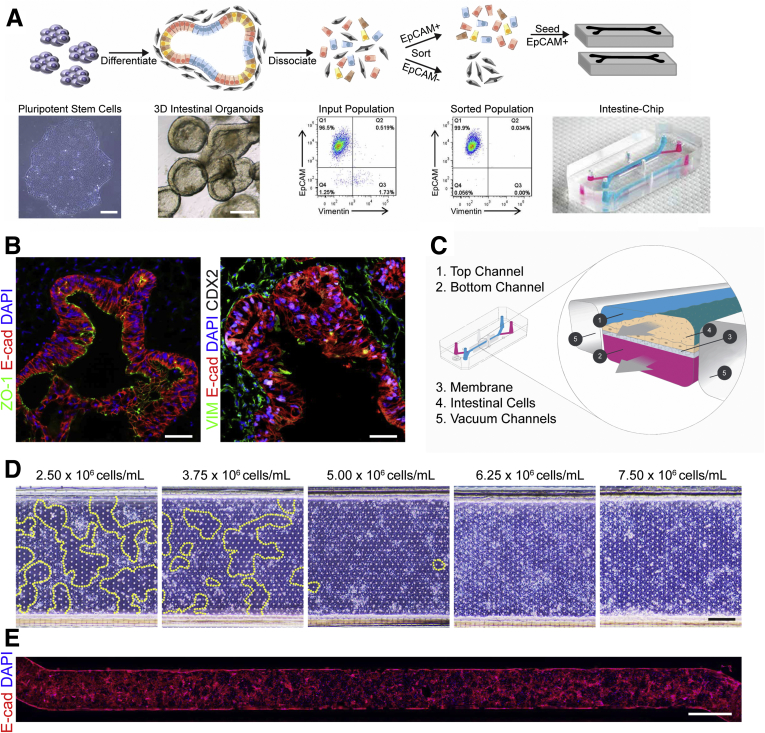
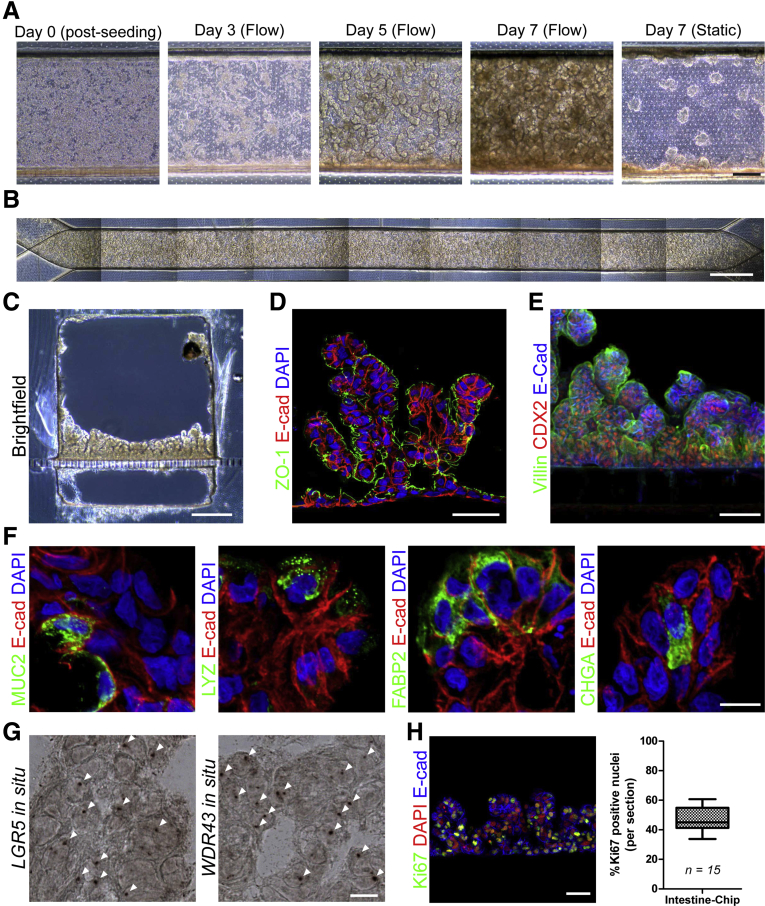
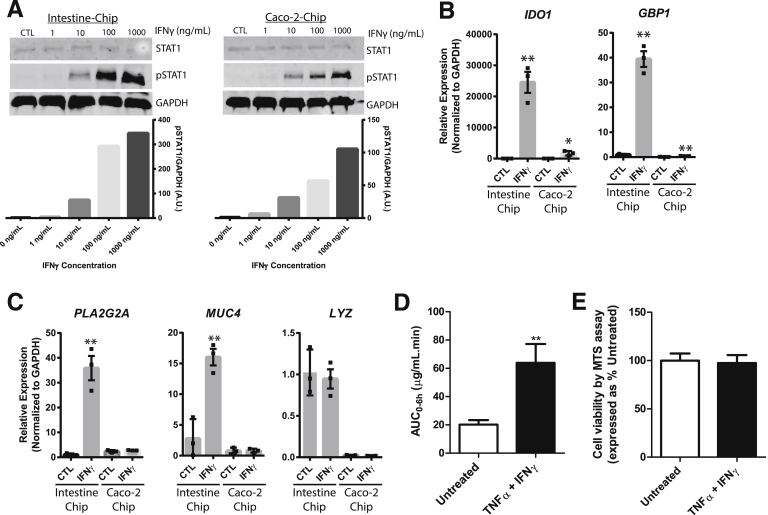
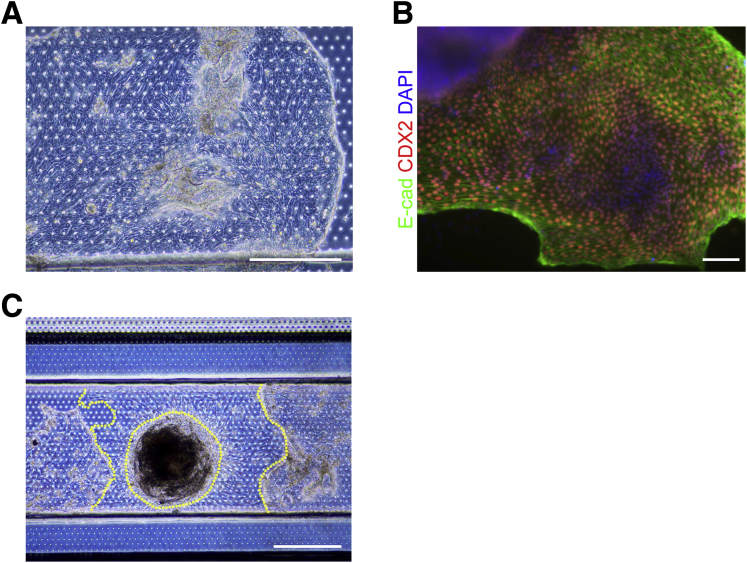
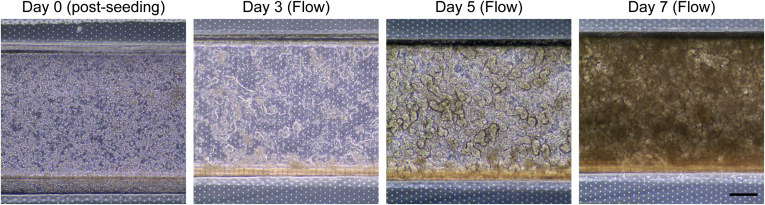
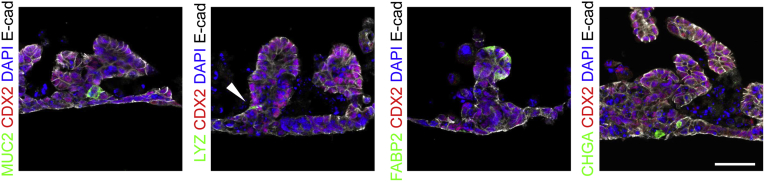
Background and Aims Human intestinal organoids derived from induced pluripotent stem cells have tremendous potential to elucidate the intestinal epithelium's role in health and disease, but it is difficult to directly assay these complex structures. This study sought to make this technology more amenable for study by obtaining epithelial cells from induced pluripotent stem cell–derived human intestinal organoids and incorporating them into small microengineered Chips. We then investigated if these cells within the Chip were polarized, had the 4 major intestinal epithelial subtypes, and were biologically responsive to exogenous stimuli. Methods Epithelial cells were positively selected from human intestinal organoids and were incorporated into the Chip. The effect of continuous media flow was examined. Immunocytochemistry and in situ hybridization were used to demonstrate that the epithelial cells were polarized and possessed the major intestinal epithelial subtypes. To assess if the incorporated cells were biologically responsive, Western blot analysis and quantitative polymerase chain reaction were used to assess the effects of interferon (IFN)-γ, and fluorescein isothiocyanate–dextran 4 kDa permeation was used to assess the effects of IFN-γ and tumor necrosis factor-α on barrier function. Results The optimal cell seeding density and flow rate were established. The continuous administration of flow resulted in the formation of polarized intestinal folds that contained Paneth cells, goblet cells, enterocytes, and enteroendocrine cells along with transit-amplifying and LGR5 + stem cells. Administration of IFN-γ for 1 hour resulted in the phosphorylation of STAT1, whereas exposure for 3 days resulted in a significant upregulation of IFN-γ related genes. Administration of IFN-γ and tumor necrosis factor-α for 3 days resulted in an increase in intestinal permeability. Conclusions We demonstrate that the Intestine-Chip is polarized, contains all the intestinal epithelial subtypes, and is biologically responsive to exogenous stimuli. This represents a more amenable platform to use organoid technology and will be highly applicable to personalized medicine and a wide range of gastrointestinal conditions.
Overview
The claims and statistics of this paper haven’t been checked yet.
Run the check — free, no account needed. It reads the open-access text and checks the sources it cites.
Integrity signals
Registry
Cites
Statistics
Figures
Verification
Claims the paper makes
The claims and statistics of this paper haven’t been checked yet.
Run the check — free, no account needed. It reads the open-access text and checks the sources it cites.
Claims other papers make about this one
Each is checked against this paper’s own text: does it say what the citing paper says it does?
The cited source says what the claim attributes to it.
In the citing paper
“OoC devices have improved the characteristics of hPSC-derived pancreatic islets104, intestinal105, stomach106, and liver77 organoids by supporting physiological flow rates.”
From Organoids (2022) · cites this paper as [104]
Self-check
Percentages, sums and reported differences re-computed from the paper’s own numbers.
The self-check needs the paper’s full text.
Citations
Cites
Identification of stem cells in small intestine and colon by marker gene Lgr5
Barker, N., van Es, J. H., Kuipers, J., Kujala, P., van den Born, M., Cozijnsen, M., Haegebarth, A., Korving, J., Begthel, H., Peters, P. J., et al. (2007) · Nature · doi:10.1038/nature06196 · Cited by 5,687
Reconstituting organ-level lung functions on a chip
Huh, D., Matthews, B. D., Mammoto, A., Montoya-Zavala, M., Hsin, H. Y., & Ingber, D. E. (2010) · Science · doi:10.1126/science.1188302 · Cited by 4,250
Sato, T., Stange, D. E., Ferrante, M., Vries, R. G. J., van Es, J. H., van den Brink, S., van Houdt, W. J., Pronk, A., van Gorp, J., Siersema, P. D., et al. (2011) · Gastroenterology · doi:10.1053/j.gastro.2011.07.050 · Cited by 3,753
Organoid Models and Applications in Biomedical Research
Xinaris, C., Brizi, V., & Remuzzi, G. (2015) · The Nephron journals/Nephron journals · doi:10.1159/000433566 · Cited by 3,519
Bhatia, S. N., & Ingber, D. E. (2014) · Nature Biotechnology · doi:10.1038/nbt.2989 · Cited by 3,305
Directed differentiation of human pluripotent stem cells into intestinal tissue in vitro
Spence, J. R., Mayhew, C. N., Rankin, S. A., Kuhar, M. F., Vallance, J. E., Tolle, K. A., Hoskins, E. E., Kalinichenko, V. V., Wells, S. I., Zorn, A. M., et al. (2010) · Nature · doi:10.1038/nature09691 · Cited by 1,911
Kim, H. J., Huh, D., Hamilton, G., & Ingber, D. E. (2012) · Lab on a Chip · doi:10.1039/c2lc40074j · Cited by 1,734
Self-citationInduced pluripotent stem cell technology: a decade of progress.
Shi, Y., Inoue, H., Wu, J. C., & Yamanaka, S. (2017) · Nature Reviews Drug Discovery · doi:10.1038/nrd.2016.245 · Cited by 1,525
A Human Disease Model of Drug Toxicity–Induced Pulmonary Edema in a Lung-on-a-Chip Microdevice
Huh, D., Leslie, D. C., Matthews, B. D., Fraser, J. P., Jurek, S., Hamilton, G. A., Thorneloe, K. S., McAlexander, M. A., & Ingber, D. E. (2012) · Science Translational Medicine · doi:10.1126/scitranslmed.3004249 · Cited by 993
Self-citationKim, H. J., Li, H., Collins, J. J., & Ingber, D. E. (2016) · Proceedings of the National Academy of Sciences · doi:10.1073/pnas.1522193112 · Cited by 922
Gut-on-a-Chip microenvironment induces human intestinal cells to undergo villus differentiation
Kim, H. J., & Ingber, D. E. (2013) · Integrative Biology · doi:10.1039/c3ib40126j · Cited by 750
Microfabrication of human organs-on-chips
Huh, D., Kim, H. J., Fraser, J. P., Shea, D. E., Khan, M., Bahinski, A., Hamilton, G. A., & Ingber, D. E. (2013) · Nature Protocols · doi:10.1038/nprot.2013.137 · Cited by 712
Self-citationVanDussen, K. L., Marinshaw, J. M., Shaikh, N., Miyoshi, H., Moon, C., Tarr, P. I., Ciorba, M. A., & Stappenbeck, T. S. (2015) · Gut · doi:10.1136/gutjnl-2013-306651 · Cited by 525
Wilgenburg, B. V., Browne, C., Vowles, J., & Cowley, S. A. (2013) · PLoS ONE · doi:10.1371/journal.pone.0071098 · Cited by 353
Senju, S., Haruta, M., Matsumura, K., Matsunaga, Y., Fukushima, S., Ikeda, T., Takamatsu, K., Irie, A., & Nishimura, Y. (2011) · Gene Therapy · doi:10.1038/gt.2011.22 · Cited by 173
Sträter, J., Wedding, U., Barth, T., Koretz, K., Elsing, C., & Möller, P. (1996) · Gastroenterology · doi:10.1053/gast.1996.v110.pm8964403 · Cited by 161
Altered Expression of Interferon-γ and Interleukin-4 in Inflammatory Bowel Disease
Camoglio, L., Velde, A. A. T., Tigges, A. J., Das, P. K., & van Deventer, S. J. H. (1998) · Inflammatory Bowel Diseases · doi:10.1002/ibd.3780040406 · Cited by 132
Grossmann, J., Mohr, S., Lapetina, E. G., Fiocchi, C., & Levine, A. D. (1998) · American Journal of Physiology-Gastrointestinal and Liver Physiology · doi:10.1152/ajpgi.1998.274.6.g1117 · Cited by 119
Lymphoblastoid Cell Lines in Pharmacogenomic Discovery and Clinical Translation
Wheeler, H. E., & Dolan, M. E. (2011) · Pharmacogenomics · doi:10.2217/pgs.11.121 · Cited by 118
Indoleamine 2,3 dioxygenase in intestinal disease
Ciorba, M. A. (2012) · Current Opinion in Gastroenterology · doi:10.1097/mog.0b013e32835c9cb3 · Cited by 117
Reliable Generation of Induced Pluripotent Stem Cells From Human Lymphoblastoid Cell Lines
Barrett, R. J., Ornelas, L., Yeager, N., Mandefro, B., Sahabian, A., Lenaeus, L., Targan, S. R., Svendsen, C. N., & Sareen, D. (2014) · Stem Cells Translational Medicine · doi:10.5966/sctm.2014-0121 · Cited by 94
Self-citationAltered Expression of Interferon-γ and Interleukin-4 in Inflammatory Bowel Disease
Camoglio, L., Velde, A. A. T., Tigges, A. J., et al. (1998) · Inflammatory Bowel Diseases · doi:10.1097/00054725-199811000-00005 · Cited by 79
Michael Schnoor, A., Betanzos, A., Weber, D. A., & Parkos, C. A. (2008) · Mucosal Immunology · doi:10.1038/mi.2008.62 · Cited by 62
Neutrophil differentiation from human‐induced pluripotent stem cells
Morishima, T., Watanabe, K., Niwa, A., Fujino, H., Matsubara, H., Adachi, S., Suemori, H., Nakahata, T., & Heike, T. (2010) · Journal of Cellular Physiology · doi:10.1002/jcp.22456 · Cited by 57
The role of interferon gamma in the pathogenesis of Crohn's disease.
Sasaki, T., Hiwatashi, N., Yamazaki, H., Noguchi, M., & Toyota, T. (1992) · PubMed · Cited by 43
Noguchi, M., Hiwatashi, N., Liu, Z., & Toyota, T. (1995) · PubMed · Cited by 33
Intestinal stem cells and intestinal homeostasis in health and in inflammation: A review
Bloemendaal, A. L. A., Buchs, N. C., George, B. D., & Guy, R. (2016) · Surgery · doi:10.1016/j.surg.2016.01.014 · Cited by 33
The role of interferony in the pathogenesis of Crohn’s disease
Sasaki, T., Hiwatashi, N., Yamazaki, H., Noguchi, M., & Toyota, T. (1992) · Gastroenterologia Japonica · doi:10.1007/bf02775061 · Cited by 31
Cited by
Sorted by citations
Organs-on-chips: into the next decade
Low, L. A., Mummery, C., Berridge, B. R., Austin, C. P., & Tagle, D. A. (2021) · Nature Reviews Drug Discovery · doi:10.1038/s41573-020-0079-3 · Cited by 1,029
Zhao, Z., Chen, X., Dowbaj, A. M., Sljukic, A., Bratlie, K., Lin, L., Fong, E. L. S., Balachander, G. M., Chen, Z., Soragni, A., et al. (2022) · Nature Reviews Methods Primers · doi:10.1038/s43586-022-00174-y · Cited by 1,082
A complex human gut microbiome cultured in an anaerobic intestine-on-a-chip
Jalili-Firoozinezhad, S., Gazzaniga, F. S., Calamari, E. L., Camacho, D. M., Fadel, C. W., Bein, A., Swenor, B., Nestor, B., Cronce, M. J., Tovaglieri, A., et al. (2019) · Nature Biomedical Engineering · doi:10.1038/s41551-019-0397-0 · Cited by 855
Park, S. E., Georgescu, A., & Huh, D. (2019) · Science · doi:10.1126/science.aaw7894 · Cited by 847
Development of a primary human Small Intestine-on-a-Chip using biopsy-derived organoids
Kasendra, M., Tovaglieri, A., Sontheimer-Phelps, A., Jalili-Firoozinezhad, S., Bein, A., Chalkiadaki, A., Scholl, W., Zhang, C., Rickner, H., Richmond, C. A., et al. (2018) · Scientific Reports · doi:10.1038/s41598-018-21201-7 · Cited by 754
Metadata
- Authors
- Workman, M. J., Gleeson, J. P., Troisi, E. J., Estrada, H. Q., Kerns, S. J., Hinojosa, C. D., Hamilton, G. A., Targan, S. R., Svendsen, C. N., & Barrett, R. J.
- Affiliations
- Cedars-Sinai Medical Center (US)
- Emulate (United States) (US)
- Corresponding author
- Barrett, Robert J.
- ORCID
- Venue
- Cellular and Molecular Gastroenterology and Hepatology
- Publisher
- Elsevier BV
- Published
- 2018
- Volume
- 5
- Issue
- 4
- Pages
- 669-677.e2
- ISSN
- 2352-345X (ISSN-L)
- PMC
- PMC6009013
- OpenAlex
- W2780753528
- Cited by
- 246
- References
- 28
- Citations by year
- 2026: 15 · 2025: 23 · 2024: 31 · 2023: 26 · 2022: 23 · 2021: 38 · 2020: 45 · 2019: 32 · 2018: 13
- FWCI
- 11.08
- Type
- journal article
- Language
- en
- Open access
- gold
- doi.org
- Licence
- Locations
- Cellular and Molecular Gastroenterology and Hepatology (publishedVersion, cc-by-nc-nd)
- Europe PMC (PubMed Central) (publishedVersion, cc-by-nc-nd)
- PubMed Central (publishedVersion, cc-by-nc-nd)
- PubMed (publishedVersion)
- DOAJ (DOAJ: Directory of Open Access Journals) (submittedVersion)
- Funders
- National Institutes of Health
- National Institute of Diabetes and Digestive and Kidney Diseases (R56DK106202-01)
- Topics
- Physical Sciences › Engineering › Biomedical Engineering › 3D Printing in Biomedical Research
- Life Sciences › Biochemistry, Genetics and Molecular Biology › Molecular Biology › Pluripotent Stem Cells Research
- Health Sciences › Medicine › Surgery › Tissue Engineering and Regenerative Medicine
- Keywords
- intestinal organoids, induced pluripotent stem cells, Paneth cells, goblet cells, enterocytes, enteroendocrine cells, Lgr5+ stem cells, interferon-gamma, TNF-α, STAT1 phosphorylation, intestinal permeability, barrier function
About these checks
Registry, retraction, Cites and statistics results are computed, not judged, with one exception: a printed reference that no index lists is read once by a model before it counts as a citation error. Claims are extracted by a model and kept only when their quote appears verbatim in the text; each cited source is then checked, with a model’s help, for whether it says what the claim relies on. Those verdicts can be wrong — read the claim’s quote and the cited source before relying on one.
Statistics and arithmetic are recomputed, not judged.
Confidence bands are shown only for fields calibrated on our annotated test set. None is calibrated yet, so no band is shown.
What counts as a claim ›How we measure confidence ›How we check this ›
Are you an author, or do you see a problem with this page? Request a review
