Cited by 70

The DOI matches its Crossref record; 4 of the 4 references it cites were found in a registry or an index.

Macrophage SCAP Contributes to Metaflammation and Lean NAFLD by Activating STING–NF-κB Signaling Pathway

Huang, Xinyu, Yao, Yingcheng, Hou, Xiaoli, Wei, Li, Rao, Yuhan, Su, Yu, Zheng, Guo, Ruan, Xiong Z., Li, Danyang, Chen, Yaxi·2022·Cellular and Molecular Gastroenterology and Hepatology

Overview

The claims and statistics of this paper haven’t been checked yet.

Run the check — free, no account needed. It reads the open-access text and checks the sources it cites.

A few free checks a day · papers already verified open instantly · results are public

Integrity signals

Registry

Crossref · 10.1016/j.jcmgh.2022.03.006

Cites

4 of 4 references verified0 citation errors · 0 not checkable

Statistics

Figures

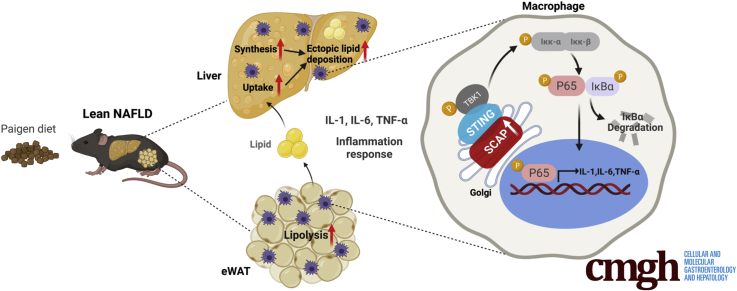
Graphical abstract
Graphical abstract CC BY-NC-ND · PubMed Central
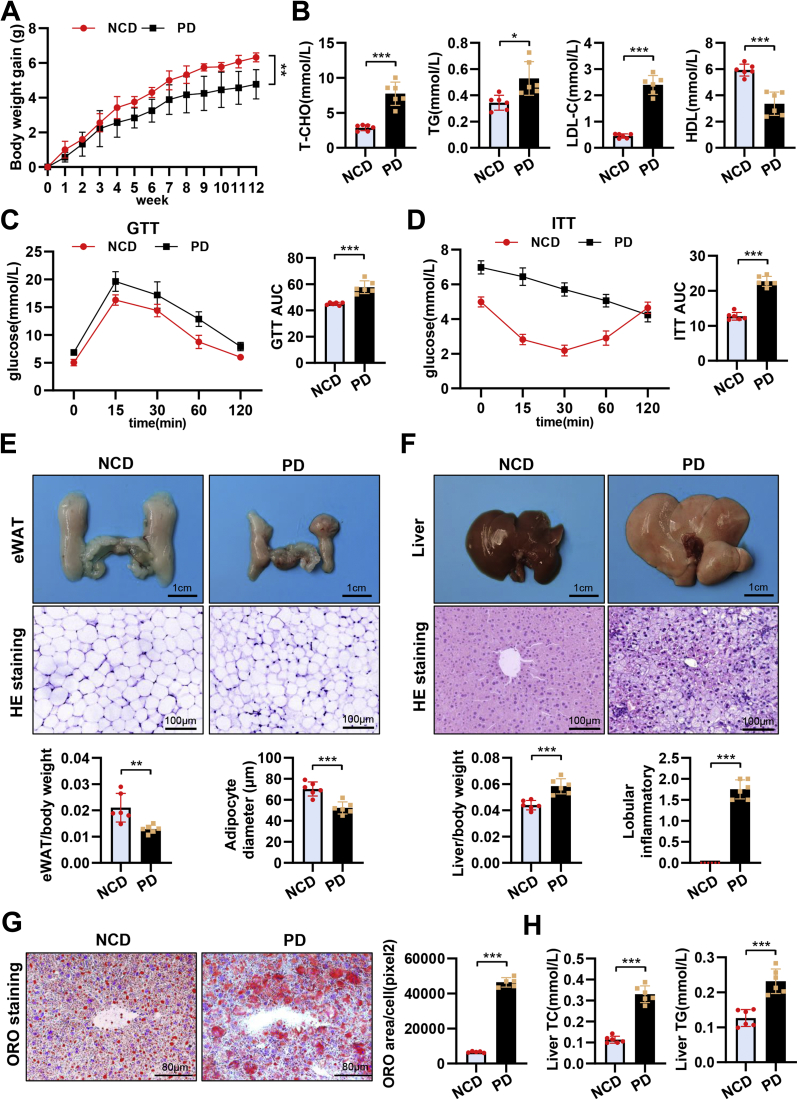
Figure 1 Nonobese metabolic syndrome induced by PD feeding features lean NAFLD. (A) Body weight gain curves of mice fed 12-week NCD and PD (n = 6). (B) Levels of total TG, TC, HDL cholesterol, and LDL in plasma (n = 6). Intraperitoneal GTT levels (C) and intraperitoneal ITT levels (D) in NCD- and PD-fed mice (n = 6). (E) Representative pictures and H&E staining of eWAT, and the histogram represents eWAT/body weight (n = 6). (F) Representative pictures and H&E staining of liver tissues, and the histogram represents liver/body weight (n = 6). (G) Representative images of Oil Red O staining in liver tissues (n = 6). (H) Levels of intrahepatic TC and TG (n = 6). Data are expressed as mean ± SD. ∗P < .05; ∗∗P < .01; ∗∗∗P < .0001; ns, nonsignificant (2-tailed unpaired t test in bar graphs and two-way analysis of variance in body weight, GTT, and ITT curves).
Figure 1 Nonobese metabolic syndrome induced by PD feeding features lean NAFLD. (A) Body weight gain curves of mice fed 12-week NCD and PD (n = 6). (B) Levels of total TG, TC, HDL cholesterol, and LDL in plasma (n = 6). Intraperitoneal GTT levels (C) and intraperitoneal ITT levels (D) in NCD- and PD-fed mice (n = 6). (E) Representative pictures and H&E staining of eWAT, and the histogram represents eWAT/body weight (n = 6). (F) Representative pictures and H&E staining of liver tissues, and the histogram represents liver/body weight (n = 6). (G) Representative images of Oil Red O staining in liver tissues (n = 6). (H) Levels of intrahepatic TC and TG (n = 6). Data are expressed as mean ± SD. ∗P < .05; ∗∗P < .01; ∗∗∗P < .0001; ns, nonsignificant (2-tailed unpaired t test in bar graphs and two-way analysis of variance in body weight, GTT, and ITT curves).CC BY-NC-ND · PubMed Central
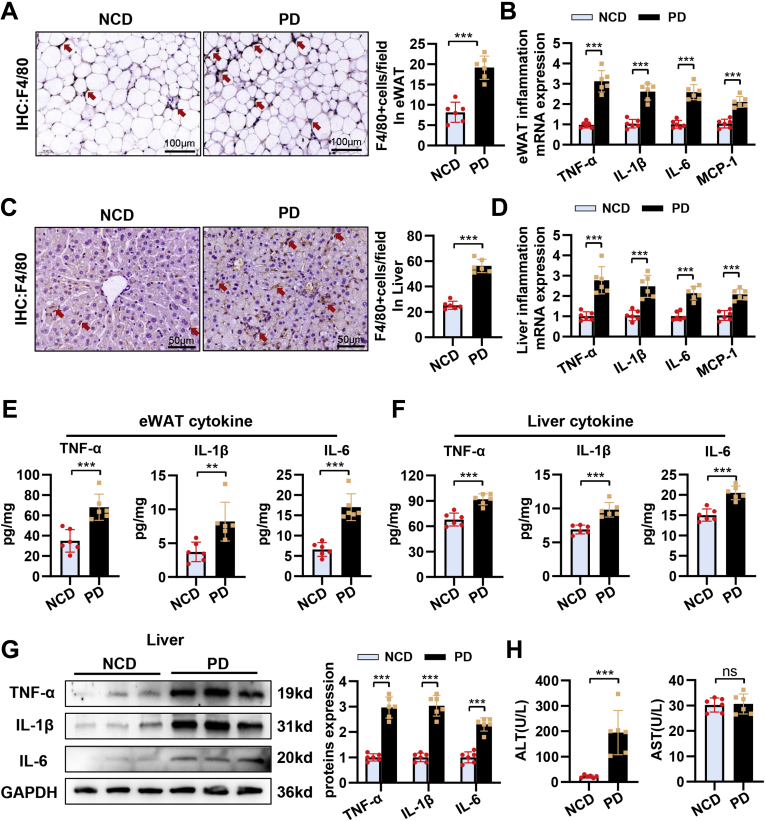
Figure 2 Lean NAFLD induced by PD feeding displays evident inflammation in eWAT and liver. (A) Immunohistochemical staining of F4/80+ cells in eWAT (n = 6). (B) Relative mRNA levels of IL1β, IL6, TNF-α, and MCP-1 in eWAT (n = 6). (C) Immunohistochemical staining of F4/80+ cells in liver tissues (n = 6). (D) Relative mRNA levels of IL1β, IL6, TNF-α, and MCP-1 in liver tissues (n = 6). Enzyme-linked immunosorbent assay analysis of protein expression of IL1β, IL6, and TNF-α in eWAT (E) and in liver tissues (F) (n = 6). (G) Protein levels of TNF-α, IL1β, and IL6 in liver tissues (n = 6). (H) Levels of ALT and aspartate aminotransferase in plasma (n = 6). Data are expressed as mean ± SD. ∗P < .05; ∗∗P < .01; ∗∗∗P < .0001; ns, nonsignificant (2-tailed unpaired t test in bar graphs).
Figure 2 Lean NAFLD induced by PD feeding displays evident inflammation in eWAT and liver. (A) Immunohistochemical staining of F4/80+ cells in eWAT (n = 6). (B) Relative mRNA levels of IL1β, IL6, TNF-α, and MCP-1 in eWAT (n = 6). (C) Immunohistochemical staining of F4/80+ cells in liver tissues (n = 6). (D) Relative mRNA levels of IL1β, IL6, TNF-α, and MCP-1 in liver tissues (n = 6). Enzyme-linked immunosorbent assay analysis of protein expression of IL1β, IL6, and TNF-α in eWAT (E) and in liver tissues (F) (n = 6). (G) Protein levels of TNF-α, IL1β, and IL6 in liver tissues (n = 6). (H) Levels of ALT and aspartate aminotransferase in plasma (n = 6). Data are expressed as mean ± SD. ∗P < .05; ∗∗P < .01; ∗∗∗P < .0001; ns, nonsignificant (2-tailed unpaired t test in bar graphs).CC BY-NC-ND · PubMed Central
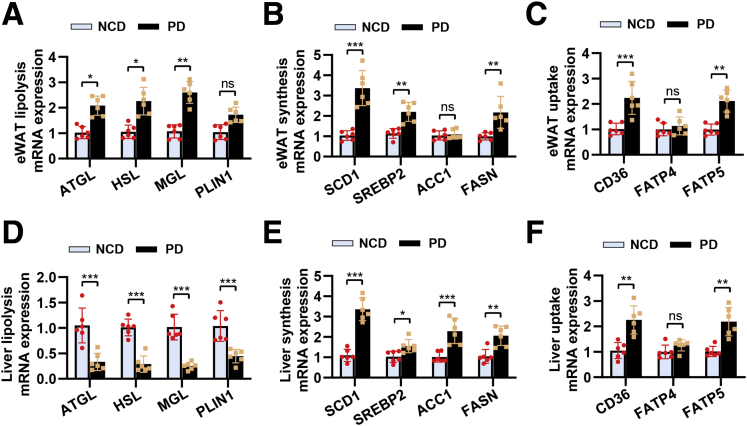
Figure 3 Lean NAFLD induced by PD feeding displays evident lipid metabolism disorders in eWAT and liver. Relative mRNA levels of lipolysis (A), lipid synthesis (B), and lipid uptake (C) in eWAT (n = 6). Relative mRNA levels of lipolysis (D), lipid synthesis (E), and lipid uptake (F) in liver tissues (n = 6). Data are expressed as mean ± SD. ∗P < .05; ∗∗P < .01; ∗∗∗P < .0001; ns, nonsignificant (2-tailed unpaired t test in bar graphs).
Figure 3 Lean NAFLD induced by PD feeding displays evident lipid metabolism disorders in eWAT and liver. Relative mRNA levels of lipolysis (A), lipid synthesis (B), and lipid uptake (C) in eWAT (n = 6). Relative mRNA levels of lipolysis (D), lipid synthesis (E), and lipid uptake (F) in liver tissues (n = 6). Data are expressed as mean ± SD. ∗P < .05; ∗∗P < .01; ∗∗∗P < .0001; ns, nonsignificant (2-tailed unpaired t test in bar graphs).CC BY-NC-ND · PubMed Central
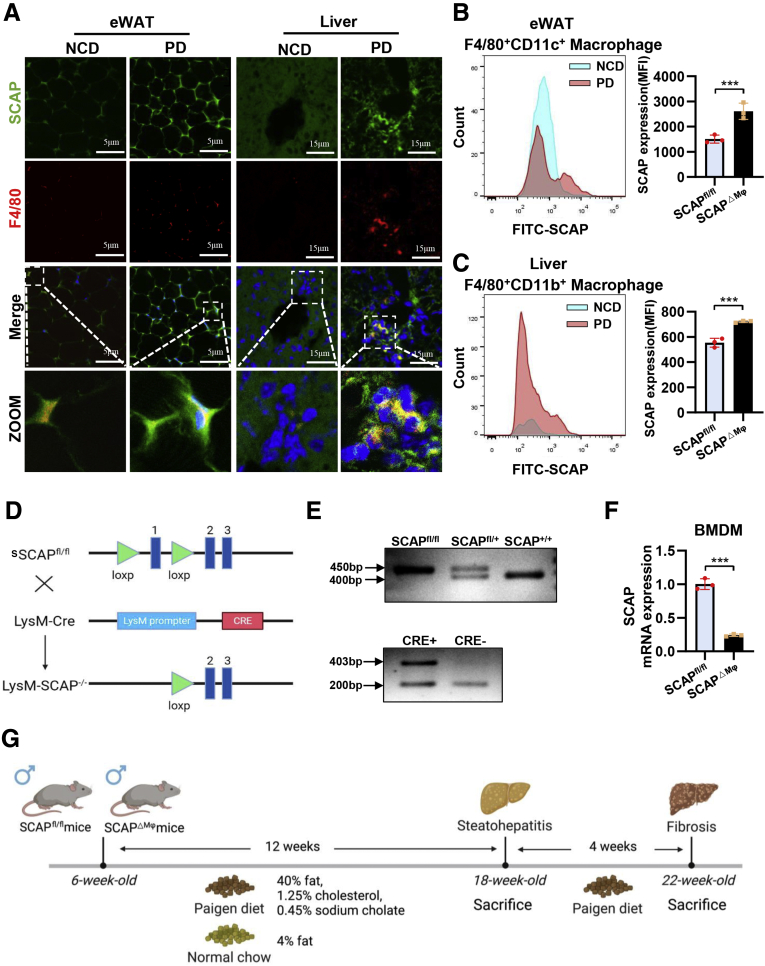
Figure 4 Macrophage SCAP expression is abnormally increased in eWAT and liver tissues of PD-fed mice. (A) Immunofluorescence staining of SCAP and F4/80 in eWAT and liver tissues (n = 3). (B) Flow cytometry was used to analyze expression of SCAP in F4/80+CD11c+ macrophages of eWAT (n = 3). (C) Flow cytometry was used to analyze expression of SCAP in F4/80+CD11b+ macrophages of liver tissues (n = 3). (D) Mice with macrophage/monocyte-specific deletion of SCAP (SCAPΔMϕ mice) were generated by crossing SCAPfl/fl mice with LysM Cre mice. (E) Genotyping SCAP knockout mice by PCR showed different genotypes: SCAP+/+, SCAP+/−, SCAP−/−. (F) Relative mRNA levels of SCAP in bone marrow-derived macrophage cells. (G) Schematic outline of experimental approaches and analyses. Data are expressed as mean ± SD. ∗P < .05; ∗∗P < .01; ∗∗∗P < .0001; ns, nonsignificant (2-tailed unpaired t test in bar graphs).
Figure 4 Macrophage SCAP expression is abnormally increased in eWAT and liver tissues of PD-fed mice. (A) Immunofluorescence staining of SCAP and F4/80 in eWAT and liver tissues (n = 3). (B) Flow cytometry was used to analyze expression of SCAP in F4/80+CD11c+ macrophages of eWAT (n = 3). (C) Flow cytometry was used to analyze expression of SCAP in F4/80+CD11b+ macrophages of liver tissues (n = 3). (D) Mice with macrophage/monocyte-specific deletion of SCAP (SCAPΔMϕ mice) were generated by crossing SCAPfl/fl mice with LysM Cre mice. (E) Genotyping SCAP knockout mice by PCR showed different genotypes: SCAP+/+, SCAP+/−, SCAP−/−. (F) Relative mRNA levels of SCAP in bone marrow-derived macrophage cells. (G) Schematic outline of experimental approaches and analyses. Data are expressed as mean ± SD. ∗P < .05; ∗∗P < .01; ∗∗∗P < .0001; ns, nonsignificant (2-tailed unpaired t test in bar graphs).CC BY-NC-ND · PubMed Central
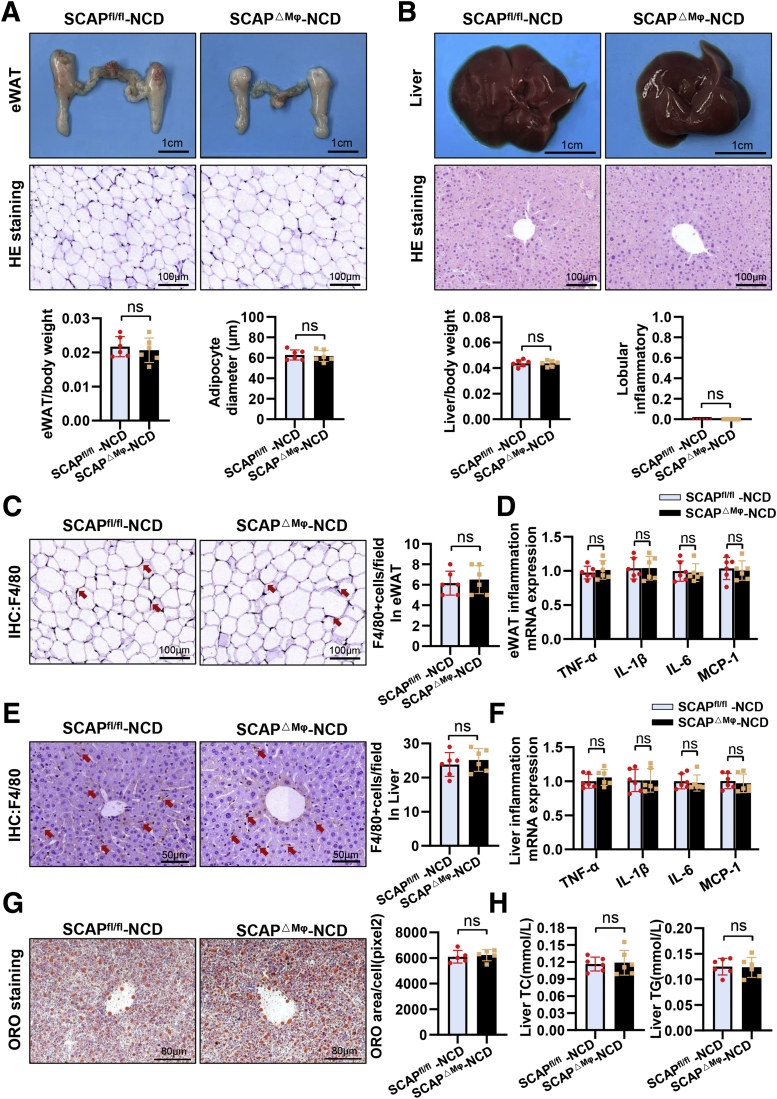
Figure 5 Macrophage SCAP deletion does not alter eWAT and liver phenotype in NCD-fed mice. (A) Representative pictures and H&E staining of eWAT, and the histogram represents eWAT/body weight (n = 6). (B) Representative pictures and H&E staining of liver tissues, and the histogram represents liver/body weight (n = 6). (C) Immunohistochemical staining of F4/80+ cells in eWAT (n = 6). (D) Relative mRNA levels of IL1β, IL6, TNF-α, and MCP-1 in eWAT (n = 6). (E) Immunohistochemical staining of F4/80+ cells in liver tissues (n = 6). (F) Relative mRNA levels of IL1β, IL6, TNF-α, and MCP-1 in liver tissues (n = 6). (G) Representative images of Oil Red O staining in liver tissues (n = 6). (H) Levels of intrahepatic TC and TG (n = 6). Data are expressed as mean ± SD. ∗P < .05; ∗∗P < .01; ∗∗∗P < .0001; ns, nonsignificant (2-tailed unpaired t test in bar graphs).
Figure 5 Macrophage SCAP deletion does not alter eWAT and liver phenotype in NCD-fed mice. (A) Representative pictures and H&E staining of eWAT, and the histogram represents eWAT/body weight (n = 6). (B) Representative pictures and H&E staining of liver tissues, and the histogram represents liver/body weight (n = 6). (C) Immunohistochemical staining of F4/80+ cells in eWAT (n = 6). (D) Relative mRNA levels of IL1β, IL6, TNF-α, and MCP-1 in eWAT (n = 6). (E) Immunohistochemical staining of F4/80+ cells in liver tissues (n = 6). (F) Relative mRNA levels of IL1β, IL6, TNF-α, and MCP-1 in liver tissues (n = 6). (G) Representative images of Oil Red O staining in liver tissues (n = 6). (H) Levels of intrahepatic TC and TG (n = 6). Data are expressed as mean ± SD. ∗P < .05; ∗∗P < .01; ∗∗∗P < .0001; ns, nonsignificant (2-tailed unpaired t test in bar graphs).CC BY-NC-ND · PubMed Central
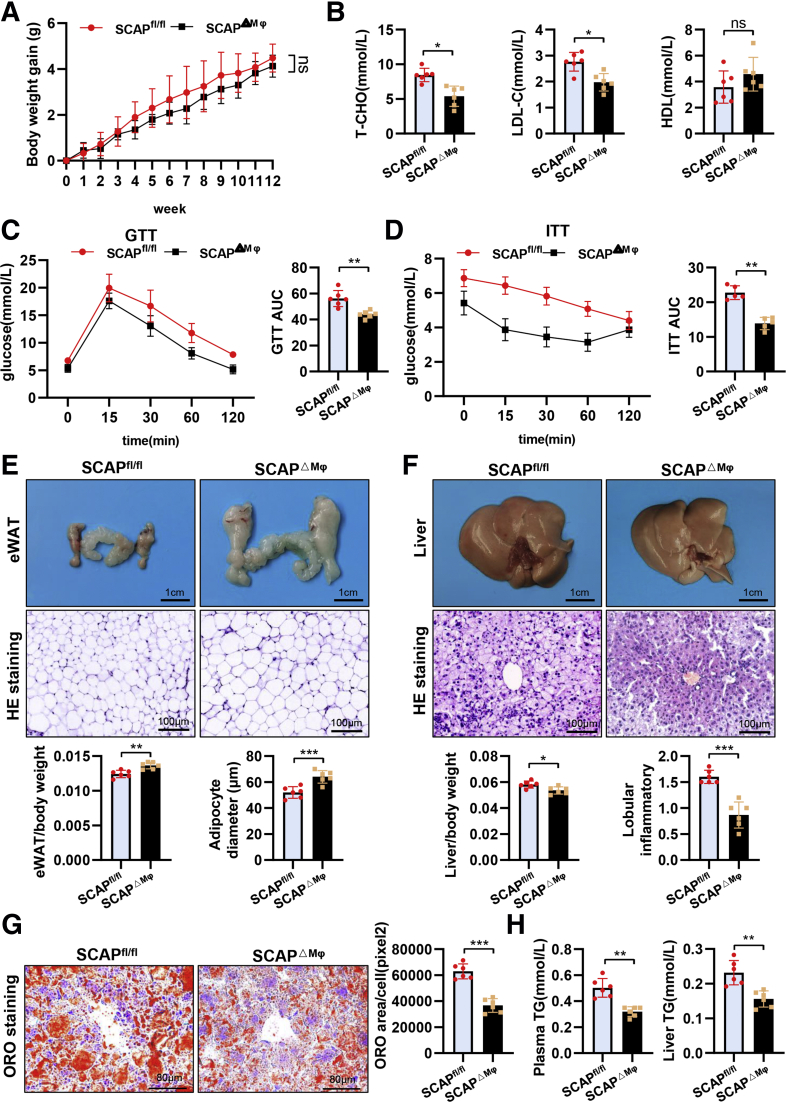
Figure 6 Macrophage SCAP deletion improves metabolic syndrome and lean NAFLD in PD-fed mice. (A) Body weight gain curves of SCAPfl/fl and SCAPΔMϕ mice fed 12 weeks of PD (n = 6). (B) Levels of TC, HDL, and LDL in plasma (n = 6). GTT levels (C) and ITT levels (D) in SCAPΔMϕ and SCAPfl/fl mice (n = 6). (E) Representative pictures and H&E staining of eWAT, and the histogram represents eWAT/body weight (n = 6). (F) Representative pictures and H&E staining of liver tissues, and the histogram represents liver/body weight (n = 6). (G) Representative images of Oil Red O staining in liver tissues (n = 6). (H) Levels of TG in plasma and intrahepatic TG levels (n = 6). Data are expressed as mean ± SD. ∗P < .05; ∗∗P < .01; ∗∗∗P < .0001; ns, nonsignificant (2-tailed unpaired t test in bar graphs and two-way analysis of variance in body weight, GTT, and ITT curves).
Figure 6 Macrophage SCAP deletion improves metabolic syndrome and lean NAFLD in PD-fed mice. (A) Body weight gain curves of SCAPfl/fl and SCAPΔMϕ mice fed 12 weeks of PD (n = 6). (B) Levels of TC, HDL, and LDL in plasma (n = 6). GTT levels (C) and ITT levels (D) in SCAPΔMϕ and SCAPfl/fl mice (n = 6). (E) Representative pictures and H&E staining of eWAT, and the histogram represents eWAT/body weight (n = 6). (F) Representative pictures and H&E staining of liver tissues, and the histogram represents liver/body weight (n = 6). (G) Representative images of Oil Red O staining in liver tissues (n = 6). (H) Levels of TG in plasma and intrahepatic TG levels (n = 6). Data are expressed as mean ± SD. ∗P < .05; ∗∗P < .01; ∗∗∗P < .0001; ns, nonsignificant (2-tailed unpaired t test in bar graphs and two-way analysis of variance in body weight, GTT, and ITT curves).CC BY-NC-ND · PubMed Central
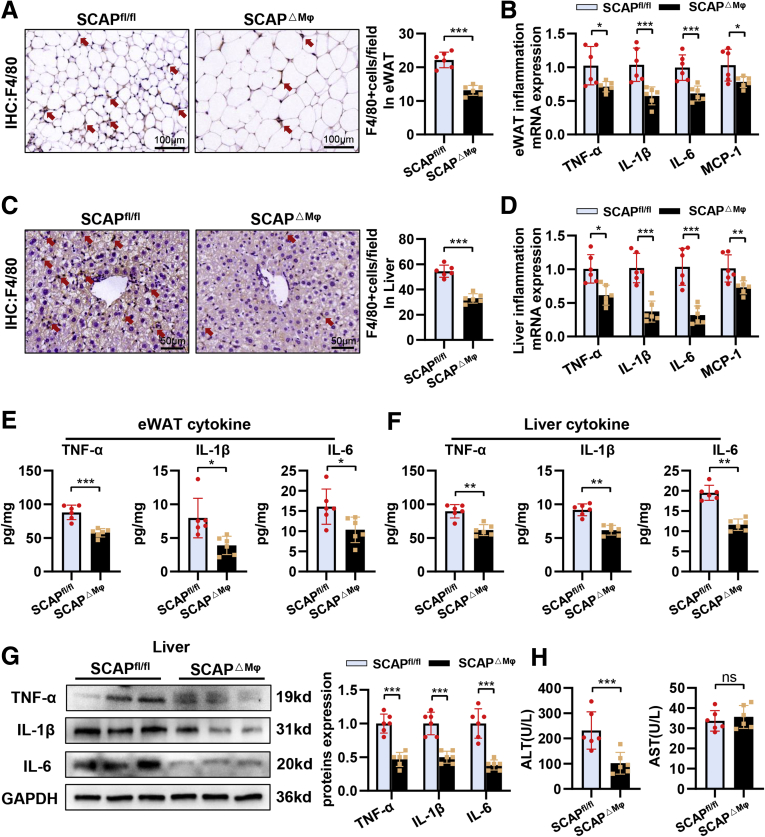
Figure 7 Macrophage SCAP deletion has ameliorative effects on metaflammation in eWAT and liver tissue of PD-fed mice. (A) Immunohistochemical staining of F4/80+ cells in eWAT (n = 6). (B) Relative mRNA levels of IL1β, IL6, TNF-α, and MCP-1 in eWAT (n = 6). (C) Immunohistochemical staining of F4/80+ cells in liver tissues (n = 6). (D) Relative mRNA levels of IL1β, IL6, TNF-α, and MCP-1 in liver tissues (n = 6). Enzyme-linked immunosorbent assay analysis of protein expression of IL1β, IL6, and TNF-α in eWAT (E) and in liver tissues (F) (n = 6). (G) Protein levels of TNF-α, IL1β, and IL6 in liver tissues (n = 6). (H) Levels of ALT and aspartate aminotransferase in plasma (n = 6). Data are expressed as mean ± SD. ∗P < .05; ∗∗P < .01; ∗∗∗P < .0001; ns, nonsignificant (2-tailed unpaired t test in bar graphs).
Figure 7 Macrophage SCAP deletion has ameliorative effects on metaflammation in eWAT and liver tissue of PD-fed mice. (A) Immunohistochemical staining of F4/80+ cells in eWAT (n = 6). (B) Relative mRNA levels of IL1β, IL6, TNF-α, and MCP-1 in eWAT (n = 6). (C) Immunohistochemical staining of F4/80+ cells in liver tissues (n = 6). (D) Relative mRNA levels of IL1β, IL6, TNF-α, and MCP-1 in liver tissues (n = 6). Enzyme-linked immunosorbent assay analysis of protein expression of IL1β, IL6, and TNF-α in eWAT (E) and in liver tissues (F) (n = 6). (G) Protein levels of TNF-α, IL1β, and IL6 in liver tissues (n = 6). (H) Levels of ALT and aspartate aminotransferase in plasma (n = 6). Data are expressed as mean ± SD. ∗P < .05; ∗∗P < .01; ∗∗∗P < .0001; ns, nonsignificant (2-tailed unpaired t test in bar graphs).CC BY-NC-ND · PubMed Central
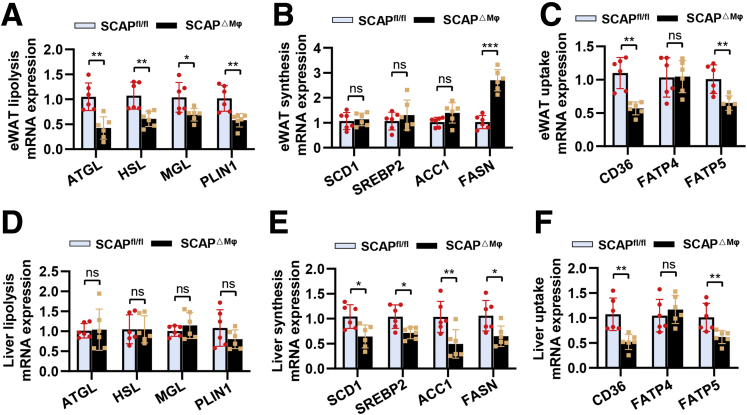
Figure 8 Macrophage SCAP deletion has ameliorative effects on lipid disorders in eWAT and liver tissue of PD-fed mice. Relative mRNA levels of lipolysis (A), lipid synthesis (B), and lipid uptake (C) in eWAT (n = 6). Relative mRNA levels of lipolysis (D), lipid synthesis (E), and lipid uptake (F) in liver tissues (n = 6). Data are expressed as mean ± SD. ∗P < .05; ∗∗P < .01; ∗∗∗P < .0001; ns, nonsignificant (2-tailed unpaired t test in bar graphs).
Figure 8 Macrophage SCAP deletion has ameliorative effects on lipid disorders in eWAT and liver tissue of PD-fed mice. Relative mRNA levels of lipolysis (A), lipid synthesis (B), and lipid uptake (C) in eWAT (n = 6). Relative mRNA levels of lipolysis (D), lipid synthesis (E), and lipid uptake (F) in liver tissues (n = 6). Data are expressed as mean ± SD. ∗P < .05; ∗∗P < .01; ∗∗∗P < .0001; ns, nonsignificant (2-tailed unpaired t test in bar graphs).CC BY-NC-ND · PubMed Central
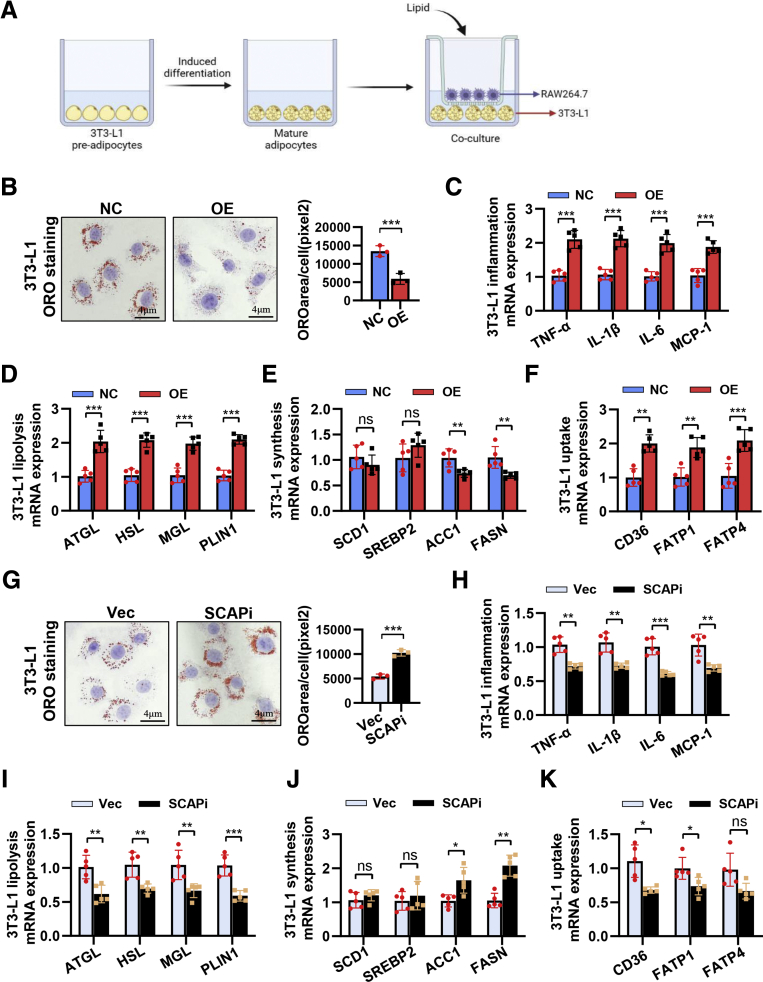
Figure 9 Expression levels of SCAP in macrophages also influences lipid homeostasis and inflammatory response of adipocytes in vitro. (A) Schematic diagram of cocultivation of 3T3-L1 cells and RAW264.7 cells. (B) Oil Red O staining of LDL-treated 3T3-L1 cells cocultured with NC-SCAP or OE-SCAP RAW264.7 cells (n = 3). Relative mRNA levels of inflammation cytokine (C), lipolysis (D), lipid synthesis (E), and lipid uptake (F) in LDL-treated 3T3-L1 cells cocultured with NC-SCAP or OE-SCAP RAW264.7 cells (n = 5). (G) Oil Red O staining of LDL-treated 3T3-L1 cells cocultured with Vec-SCAP or SCAPi-RAW264.7 cells (n = 3). Relative mRNA levels of inflammation cytokine (H), lipolysis (I), lipid synthesis (J), and lipid uptake (K) in LDL-treated 3T3-L1 cells cocultured with Vec-SCAP or SCAPi-RAW264.7 cells (n = 5). Data are expressed as mean ± SD. ∗P < .05; ∗∗P < .01; ∗∗∗P < .0001; ns, nonsignificant (2-tailed unpaired t test in bar graphs).
Figure 9 Expression levels of SCAP in macrophages also influences lipid homeostasis and inflammatory response of adipocytes in vitro. (A) Schematic diagram of cocultivation of 3T3-L1 cells and RAW264.7 cells. (B) Oil Red O staining of LDL-treated 3T3-L1 cells cocultured with NC-SCAP or OE-SCAP RAW264.7 cells (n = 3). Relative mRNA levels of inflammation cytokine (C), lipolysis (D), lipid synthesis (E), and lipid uptake (F) in LDL-treated 3T3-L1 cells cocultured with NC-SCAP or OE-SCAP RAW264.7 cells (n = 5). (G) Oil Red O staining of LDL-treated 3T3-L1 cells cocultured with Vec-SCAP or SCAPi-RAW264.7 cells (n = 3). Relative mRNA levels of inflammation cytokine (H), lipolysis (I), lipid synthesis (J), and lipid uptake (K) in LDL-treated 3T3-L1 cells cocultured with Vec-SCAP or SCAPi-RAW264.7 cells (n = 5). Data are expressed as mean ± SD. ∗P < .05; ∗∗P < .01; ∗∗∗P < .0001; ns, nonsignificant (2-tailed unpaired t test in bar graphs).CC BY-NC-ND · PubMed Central
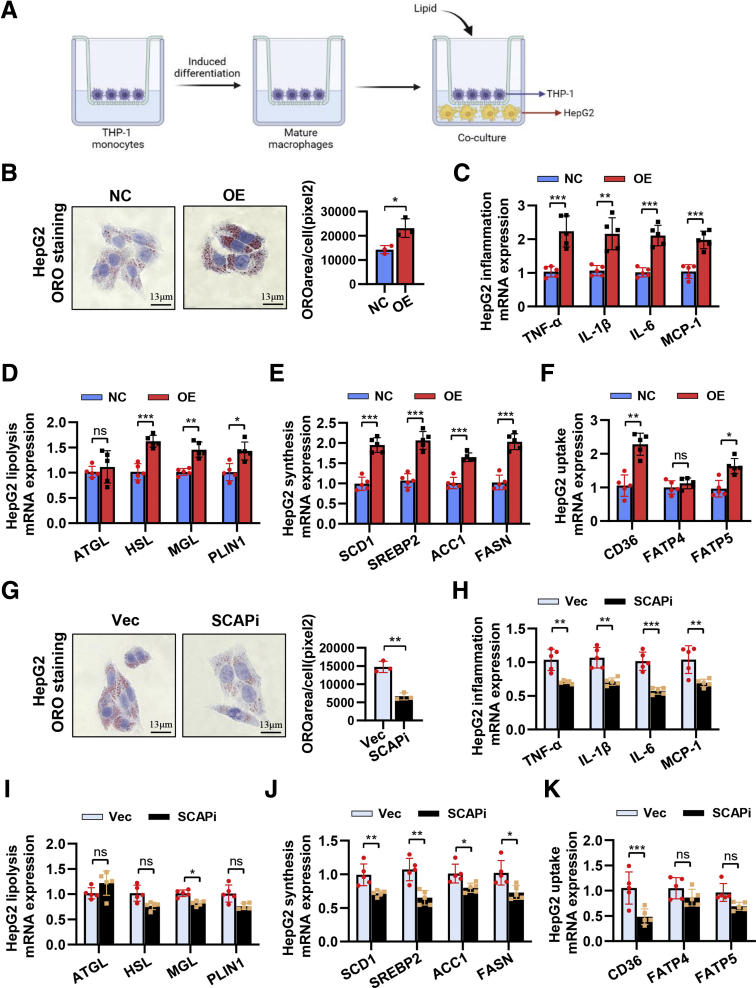
Figure 10 Expression levels of SCAP in macrophages also influences lipid homeostasis and inflammatory response of adipocytes in vitro. (A) Schematic diagram of cocultivation of HepG2 cells and THP-1 cells. (B) Oil Red O staining of LDL-treated HepG2 cells cocultured with NC-SCAP or OE-SCAP THP-1 cells (n = 3). Relative mRNA levels of inflammation cytokine (C), lipolysis (D), lipid synthesis (E), and lipid uptake (F) in LDL-treated HepG2 cells cocultured with NC-SCAP or OE-SCAP THP-1 cells (n = 5). (G) Oil Red O staining of LDL-treated HepG2 cells cocultured with Vec-SCAP or SCAPi-THP-1 cells (n = 3). Relative mRNA levels of inflammation cytokine (H), lipolysis (I), lipid synthesis (J), and lipid uptake (K) in LDL-treated HepG2 cells cocultured with Vec-SCAP or SCAPi-THP-1 cells (n = 5). Data are expressed as mean ± SD. ∗P < .05; ∗∗P < .01; ∗∗∗P < .0001; ns, nonsignificant (2-tailed unpaired t test in bar graphs).
Figure 10 Expression levels of SCAP in macrophages also influences lipid homeostasis and inflammatory response of adipocytes in vitro. (A) Schematic diagram of cocultivation of HepG2 cells and THP-1 cells. (B) Oil Red O staining of LDL-treated HepG2 cells cocultured with NC-SCAP or OE-SCAP THP-1 cells (n = 3). Relative mRNA levels of inflammation cytokine (C), lipolysis (D), lipid synthesis (E), and lipid uptake (F) in LDL-treated HepG2 cells cocultured with NC-SCAP or OE-SCAP THP-1 cells (n = 5). (G) Oil Red O staining of LDL-treated HepG2 cells cocultured with Vec-SCAP or SCAPi-THP-1 cells (n = 3). Relative mRNA levels of inflammation cytokine (H), lipolysis (I), lipid synthesis (J), and lipid uptake (K) in LDL-treated HepG2 cells cocultured with Vec-SCAP or SCAPi-THP-1 cells (n = 5). Data are expressed as mean ± SD. ∗P < .05; ∗∗P < .01; ∗∗∗P < .0001; ns, nonsignificant (2-tailed unpaired t test in bar graphs).CC BY-NC-ND · PubMed Central
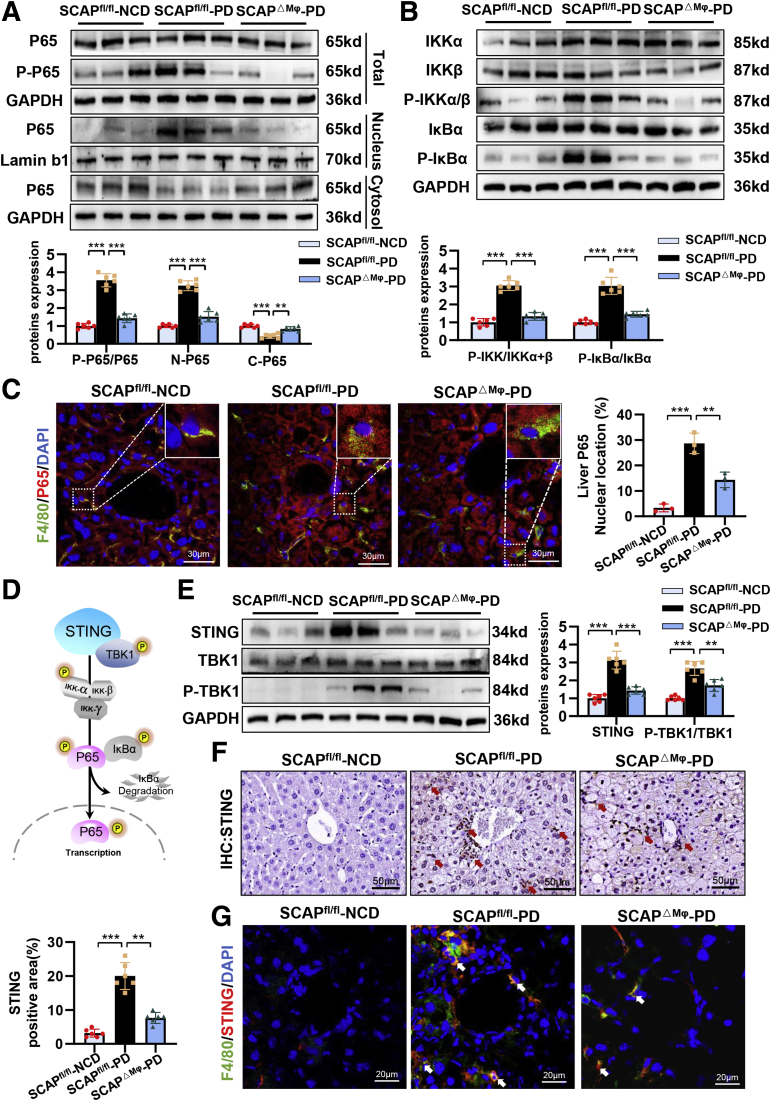
Figure 11 Macrophage SCAP deletion alleviates inflammatory response in liver tissue of PD-fed mice via inhibition of STING–NF-κB signaling. (A) Protein levels of P65 and P-P65 in total liver tissues, P65 in liver nuclear and cytosol (n = 6). (B) Protein levels of IKKα, IKKβ, P-IKKα/β, IκBα, and P-IκBα in liver tissues (n = 6). (C) Immunofluorescence staining of F4/80 and P65 in liver tissues (n = 3). (D) Schematic diagram of mechanisms by which STING activates NF-κB signaling. (E) Protein levels of STING, P-TBK1, and TBK1 in liver tissues (n = 6). (F) Immunohistochemical staining of STING in liver tissues (n = 6). (G) Immunofluorescence staining of F4/80 and STING in liver tissues (n = 3). Data are expressed as mean ± SD. ∗P < .05; ∗∗P < .01; ∗∗∗P < .0001; ns, nonsignificant (2-tailed unpaired t test in bar graphs).
Figure 11 Macrophage SCAP deletion alleviates inflammatory response in liver tissue of PD-fed mice via inhibition of STING–NF-κB signaling. (A) Protein levels of P65 and P-P65 in total liver tissues, P65 in liver nuclear and cytosol (n = 6). (B) Protein levels of IKKα, IKKβ, P-IKKα/β, IκBα, and P-IκBα in liver tissues (n = 6). (C) Immunofluorescence staining of F4/80 and P65 in liver tissues (n = 3). (D) Schematic diagram of mechanisms by which STING activates NF-κB signaling. (E) Protein levels of STING, P-TBK1, and TBK1 in liver tissues (n = 6). (F) Immunohistochemical staining of STING in liver tissues (n = 6). (G) Immunofluorescence staining of F4/80 and STING in liver tissues (n = 3). Data are expressed as mean ± SD. ∗P < .05; ∗∗P < .01; ∗∗∗P < .0001; ns, nonsignificant (2-tailed unpaired t test in bar graphs).CC BY-NC-ND · PubMed Central
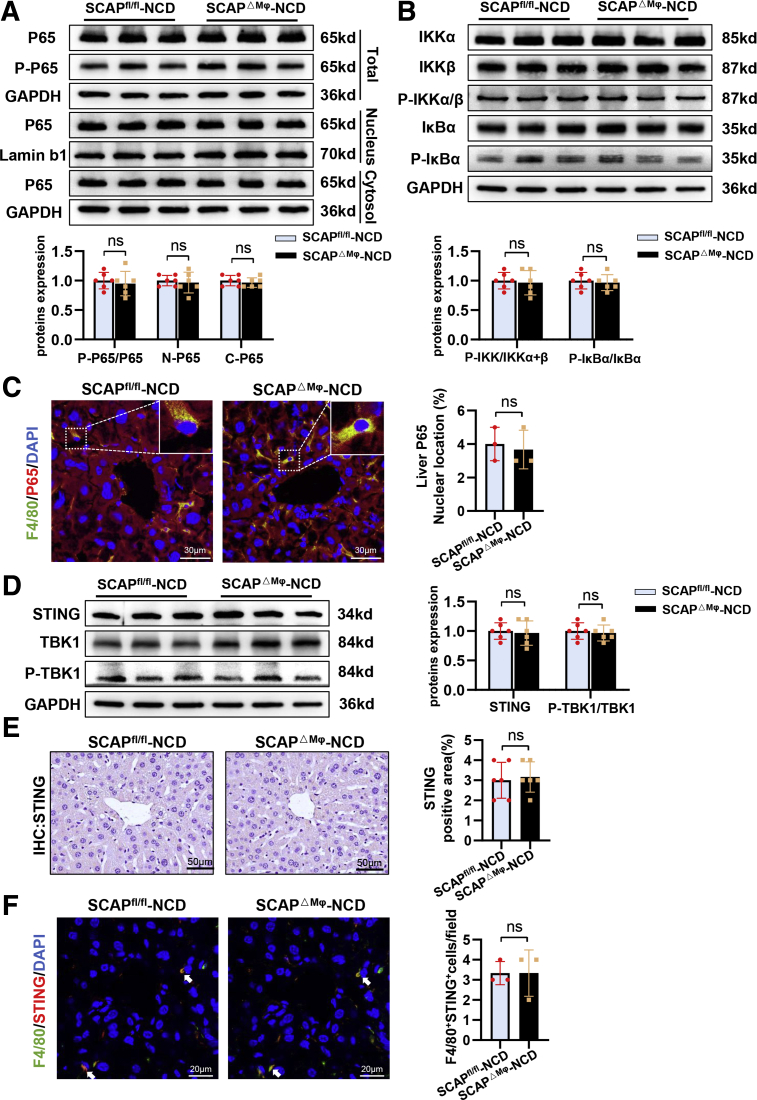
Figure 12 Macrophage SCAP deletion does not alter STING–NF-κB signaling in liver tissue of NCD-fed mice. (A) Protein levels of P65 and P-P65 in total liver tissues, P65 in liver nuclear and cytosol (n = 6). (B) Protein levels of IKKα, IKKβ, P-IKKα/β, IκBα, and P-IκBα in liver tissues (n = 6). (C) Immunofluorescence staining of F4/80 and P65 in liver tissues (n = 3). (D) Protein levels of STING, P-TBK1, and TBK1 in liver tissues (n = 6). (E) Immunohistochemical staining of STING in liver tissues (n = 6). (F) Immunofluorescence staining of F4/80 and STING in liver tissues (n = 3). Data are expressed as mean ± SD. ∗P < .05; ∗∗P < .01; ∗∗∗P < .0001; ns, nonsignificant (2-tailed unpaired t test in bar graphs).
Figure 12 Macrophage SCAP deletion does not alter STING–NF-κB signaling in liver tissue of NCD-fed mice. (A) Protein levels of P65 and P-P65 in total liver tissues, P65 in liver nuclear and cytosol (n = 6). (B) Protein levels of IKKα, IKKβ, P-IKKα/β, IκBα, and P-IκBα in liver tissues (n = 6). (C) Immunofluorescence staining of F4/80 and P65 in liver tissues (n = 3). (D) Protein levels of STING, P-TBK1, and TBK1 in liver tissues (n = 6). (E) Immunohistochemical staining of STING in liver tissues (n = 6). (F) Immunofluorescence staining of F4/80 and STING in liver tissues (n = 3). Data are expressed as mean ± SD. ∗P < .05; ∗∗P < .01; ∗∗∗P < .0001; ns, nonsignificant (2-tailed unpaired t test in bar graphs).CC BY-NC-ND · PubMed Central
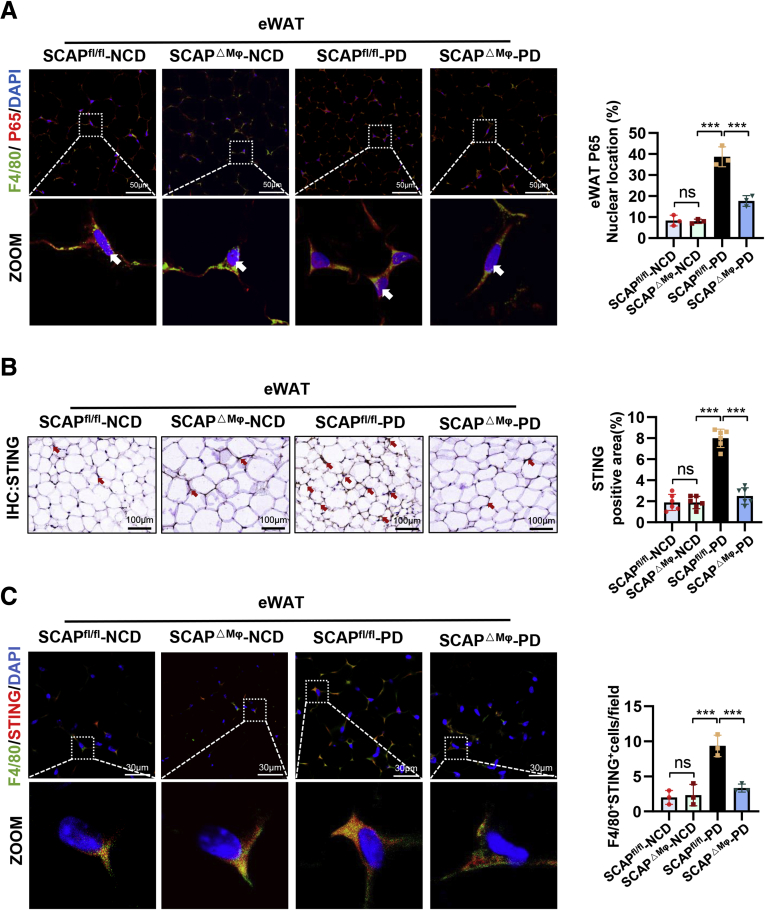
Figure 13 Macrophage SCAP deficiency inhibits expression of STING and P65 in eWAT of PD-fed mice. (A) Immunofluorescence staining of F4/80 and P65 in eWAT (n = 3). (B) Immunohistochemical staining of STING in eWAT (n = 6). (C) Immunofluorescence staining of F4/80 and STING in eWAT (n = 3). Data are expressed as mean ± SD. ∗P < .05; ∗∗P < .01; ∗∗∗P < .0001; ns, nonsignificant (2-tailed unpaired t test in bar graphs).
Figure 13 Macrophage SCAP deficiency inhibits expression of STING and P65 in eWAT of PD-fed mice. (A) Immunofluorescence staining of F4/80 and P65 in eWAT (n = 3). (B) Immunohistochemical staining of STING in eWAT (n = 6). (C) Immunofluorescence staining of F4/80 and STING in eWAT (n = 3). Data are expressed as mean ± SD. ∗P < .05; ∗∗P < .01; ∗∗∗P < .0001; ns, nonsignificant (2-tailed unpaired t test in bar graphs).CC BY-NC-ND · PubMed Central
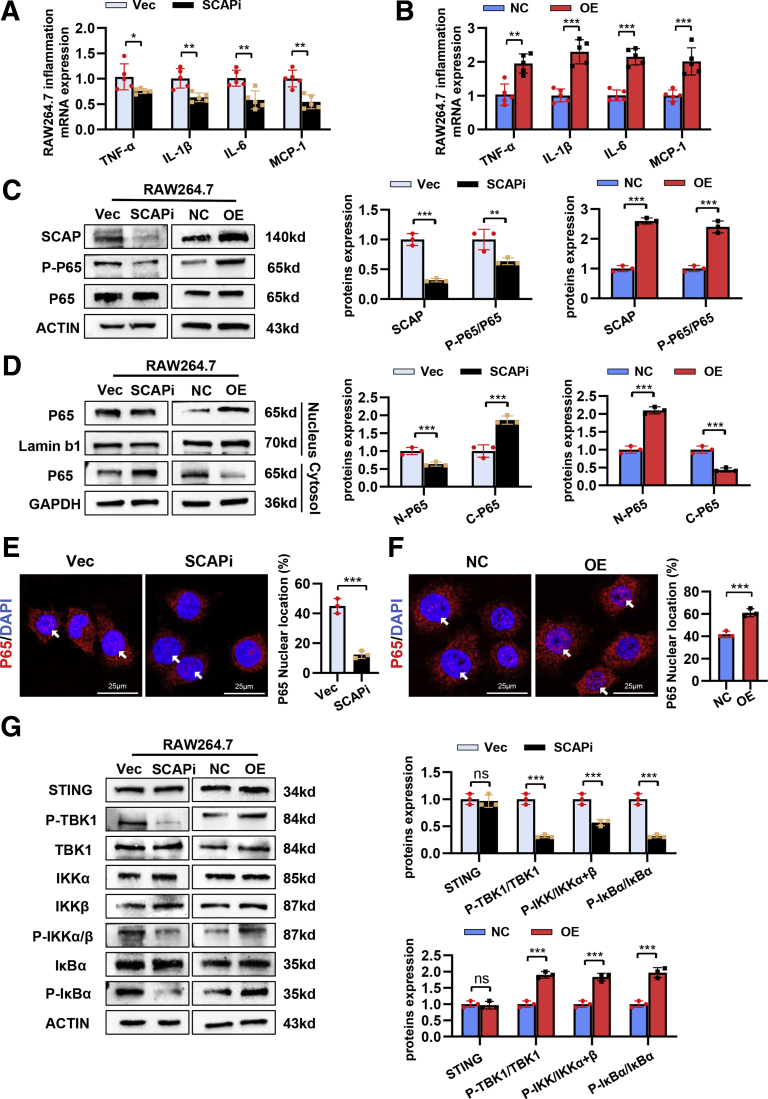
Figure 14 SCAP promotes inflammatory response through STING–NF-κB signaling activation in vitro. RAW264.7 macrophages were stimulated with LPS (300 ng mL−1) for 16 hours. (A) Relative mRNA levels of IL1β, IL6, TNF-α, and MCP-1 in Vec-SCAP and SCAPi-RAW264.7 cells (n = 5). (B) Relative mRNA levels of IL1β, IL6, TNF-α, and MCP-1 in NC-SCAP and OE-SCAP RAW264.7 cells (n = 5). (C) Protein levels of P-P65, P65, and SCAP in RAW264.7 cells (n = 3). (D) Protein levels of P65 in cytosolic and nuclear fractions (n = 3). Immunofluorescence staining of p65 nuclear translocation in SCAPi-RAW264.7 cells (E) and OE-SCAP RAW264.7 cells (F) (n = 3). (G) Protein levels of STING, P-TBK1, TBK1, IKKα, IKKβ, P-IKKα/β, IκBα, and P-IκBα in RAW264.7 cells (n = 3). Data are expressed as mean ± SD. ∗P < .05; ∗∗P < .01; ∗∗∗P < .0001; ns, nonsignificant (2-tailed unpaired t test in bar graphs).
Figure 14 SCAP promotes inflammatory response through STING–NF-κB signaling activation in vitro. RAW264.7 macrophages were stimulated with LPS (300 ng mL−1) for 16 hours. (A) Relative mRNA levels of IL1β, IL6, TNF-α, and MCP-1 in Vec-SCAP and SCAPi-RAW264.7 cells (n = 5). (B) Relative mRNA levels of IL1β, IL6, TNF-α, and MCP-1 in NC-SCAP and OE-SCAP RAW264.7 cells (n = 5). (C) Protein levels of P-P65, P65, and SCAP in RAW264.7 cells (n = 3). (D) Protein levels of P65 in cytosolic and nuclear fractions (n = 3). Immunofluorescence staining of p65 nuclear translocation in SCAPi-RAW264.7 cells (E) and OE-SCAP RAW264.7 cells (F) (n = 3). (G) Protein levels of STING, P-TBK1, TBK1, IKKα, IKKβ, P-IKKα/β, IκBα, and P-IκBα in RAW264.7 cells (n = 3). Data are expressed as mean ± SD. ∗P < .05; ∗∗P < .01; ∗∗∗P < .0001; ns, nonsignificant (2-tailed unpaired t test in bar graphs).CC BY-NC-ND · PubMed Central
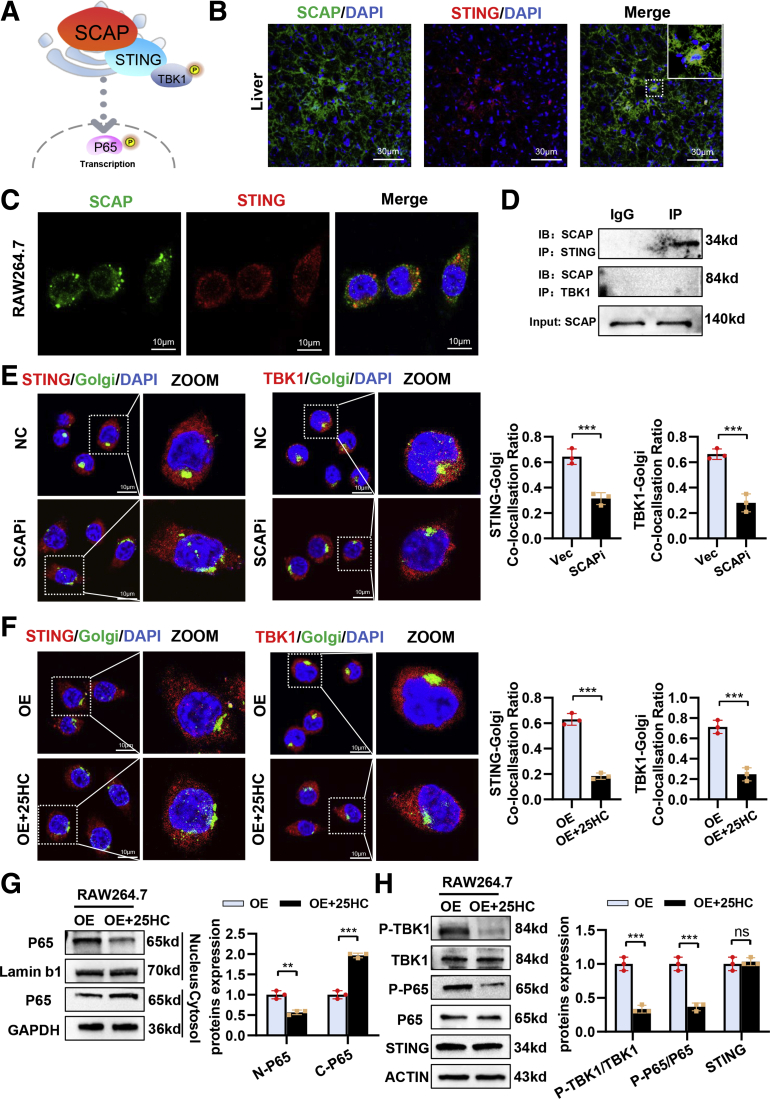
Figure 15 SCAP recruits STING and TBK1 to the Golgi and activates NF-κB signaling. RAW264.7 macrophages were stimulated with LPS (300 ng ml−1) for 16 hours and 50 μmol/L 25-HC for 3 hours. (A) Schematic diagram of mechanisms by which macrophage SCAP activates STING–NF-κB. Immunofluorescence staining of STING and SCAP in liver tissues (B) or RAW264.7 cells (C). (D) Immunoblotting of immunoprecipitation with anti-SCAP, anti-TBK1, and anti-STING in OE-SCAP RAW264.7 cells. (n = 3). (E) Immunofluorescence staining of STING, TBK1, and Golgi 97 in RAW264.7 cells treated with LPS (n = 3). (F) Immunofluorescence staining of STING, TBK1, and Golgi 97 in RAW264.7 cells treated with LPS (n = 3). (G) Protein levels of P65 in cytosolic and nuclear fractions (n = 3). (H) Protein levels of TBK1, P-TBK1, P-P65, P65, and STING in RAW264.7 cells (n = 3). Data are expressed as mean ± SD. ∗P < .05; ∗∗P < .01; ∗∗∗P < .0001; ns, nonsignificant (2-tailed unpaired t test in bar graphs).
Figure 15 SCAP recruits STING and TBK1 to the Golgi and activates NF-κB signaling. RAW264.7 macrophages were stimulated with LPS (300 ng ml−1) for 16 hours and 50 μmol/L 25-HC for 3 hours. (A) Schematic diagram of mechanisms by which macrophage SCAP activates STING–NF-κB. Immunofluorescence staining of STING and SCAP in liver tissues (B) or RAW264.7 cells (C). (D) Immunoblotting of immunoprecipitation with anti-SCAP, anti-TBK1, and anti-STING in OE-SCAP RAW264.7 cells. (n = 3). (E) Immunofluorescence staining of STING, TBK1, and Golgi 97 in RAW264.7 cells treated with LPS (n = 3). (F) Immunofluorescence staining of STING, TBK1, and Golgi 97 in RAW264.7 cells treated with LPS (n = 3). (G) Protein levels of P65 in cytosolic and nuclear fractions (n = 3). (H) Protein levels of TBK1, P-TBK1, P-P65, P65, and STING in RAW264.7 cells (n = 3). Data are expressed as mean ± SD. ∗P < .05; ∗∗P < .01; ∗∗∗P < .0001; ns, nonsignificant (2-tailed unpaired t test in bar graphs).CC BY-NC-ND · PubMed Central
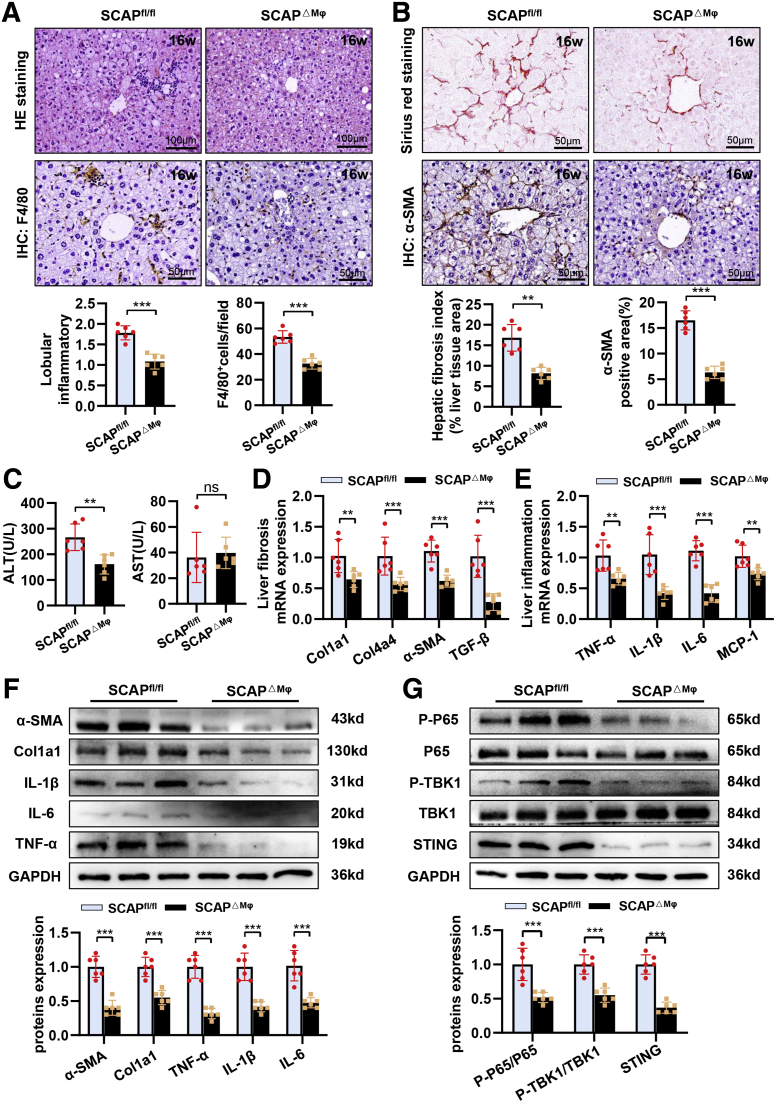
Figure 16 Macrophage SCAP deletion ameliorates the degree of liver fibrosis in PD-fed mice. (A) Representative pictures of H&E staining and immunohistochemical staining of F4/80+ cells in mice fed a 16-week PD (n = 6). (B) Representative pictures of Sirius red staining and immunohistochemical staining of α-SMA in mice fed a 16-week PD (n = 6). (C) Levels of ALT and aspartate aminotransferase in plasma (n = 6). (D) Relative mRNA levels of fibrosis in liver tissues (n = 6). (E) Relative mRNA levels of inflammation cytokine in liver tissues (n = 6). (F) Protein levels of α-SMA, Col1a1, IL1β, IL6, TNF-α, and MCP-1 in liver tissues (n = 6). (G) Protein levels of P-P65, P65, P-TBK1, TBK1, and STING in liver tissues (n = 6). Data are expressed as mean ± SD. ∗P < .05; ∗∗P < .01; ∗∗∗P < .0001; ns, nonsignificant (2-tailed unpaired t test in bar graphs).
Figure 16 Macrophage SCAP deletion ameliorates the degree of liver fibrosis in PD-fed mice. (A) Representative pictures of H&E staining and immunohistochemical staining of F4/80+ cells in mice fed a 16-week PD (n = 6). (B) Representative pictures of Sirius red staining and immunohistochemical staining of α-SMA in mice fed a 16-week PD (n = 6). (C) Levels of ALT and aspartate aminotransferase in plasma (n = 6). (D) Relative mRNA levels of fibrosis in liver tissues (n = 6). (E) Relative mRNA levels of inflammation cytokine in liver tissues (n = 6). (F) Protein levels of α-SMA, Col1a1, IL1β, IL6, TNF-α, and MCP-1 in liver tissues (n = 6). (G) Protein levels of P-P65, P65, P-TBK1, TBK1, and STING in liver tissues (n = 6). Data are expressed as mean ± SD. ∗P < .05; ∗∗P < .01; ∗∗∗P < .0001; ns, nonsignificant (2-tailed unpaired t test in bar graphs).CC BY-NC-ND · PubMed Central

Verification

Claims the paper makes

The claims and statistics of this paper haven’t been checked yet.

Run the check — free, no account needed. It reads the open-access text and checks the sources it cites.

A few free checks a day · papers already verified open instantly · results are public

Claims other papers make about this one

Each is checked against this paper’s own text: does it say what the citing paper says it does?

Self-check

Percentages, sums and reported differences re-computed from the paper’s own numbers.

The self-check needs the paper’s full text.

Citations

Cites

Show all 4 references

Research works printed but not linked: 39

  1. Wang, 2019, Lean non-alcoholic fatty liver disease, Clinical Nutrition (Edinburgh, Scotland), 38, 975, 10.1016/j.clnu.2018.08.008 · DOI
  2. Mellinger, 2015, Hepatic steatosis and cardiovascular disease outcomes: an analysis of the Framingham Heart Study, J Hepatol, 63, 470, 10.1016/j.jhep.2015.02.045 · DOI
  3. Sinn, 2012, Ultrasonographically detected non-alcoholic fatty liver disease is an independent predictor for identifying patients with insulin resistance in non-obese, non-diabetic middle-aged Asian adults, Am J Gastroenterol, 107, 561, 10.1038/ajg.2011.400 · DOI
  4. Ye, 2020, Global prevalence, incidence, and outcomes of non-obese or lean non-alcoholic fatty liver disease: a systematic review and meta-analysis, Lancet Gastroenterol, 5, 739
  5. Das, 2010, Nonobese population in a developing country has a high prevalence of nonalcoholic fatty liver and significant liver disease, Hepatology, 51, 1593, 10.1002/hep.23567 · DOI
  6. Fan, 2017, New trends on obesity and NAFLD in Asia, J Hepatol, 67, 862, 10.1016/j.jhep.2017.06.003 · DOI
  7. Younossi, 2012, Nonalcoholic fatty liver disease in lean individuals in the United States, Medicine, 91, 319, 10.1097/MD.0b013e3182779d49 · DOI
  8. Iacobini, 2019, Metabolically healthy versus metabolically unhealthy obesity, Metabolism, 92, 51, 10.1016/j.metabol.2018.11.009 · DOI · Paper page
  9. Feng, 2014, Lean-non-alcoholic fatty liver disease increases risk for metabolic disorders in a normal weight Chinese population, World J Gastroenterol, 20, 17932, 10.3748/wjg.v20.i47.17932 · DOI
  10. Zou, 2020, Prevalence, characteristics and mortality outcomes of obese, nonobese and lean NAFLD in the United States, 1999-2016, J Intern Med, 288, 139, 10.1111/joim.13069 · DOI
  11. Wang, 2019, Non-obese histologically confirmed NASH patients with abnormal liver biochemistry have more advanced fibrosis, Hepatol Int, 13, 766, 10.1007/s12072-019-09982-z · DOI
  12. Denkmayr, 2018, Lean patients with non-alcoholic fatty liver disease have a severe histological phenotype similar to obese patients, J Clin Med, 7
  13. Feldman, 2017, Clinical and metabolic characterization of lean Caucasian subjects with non-alcoholic fatty liver, Am J Gastroenterol, 112, 102, 10.1038/ajg.2016.318 · DOI
  14. Musso, 2003, Dietary habits and their relations to insulin resistance and postprandial lipemia in nonalcoholic steatohepatitis, Hepatology, 37, 909, 10.1053/jhep.2003.50132 · DOI
  15. Yasutake, 2009, Nutritional investigation of non-obese patients with non-alcoholic fatty liver disease: the significance of dietary cholesterol, Scand J Gastroenterol, 44, 471, 10.1080/00365520802588133 · DOI
  16. Younes, 2021, Caucasian lean subjects with non-alcoholic fatty liver disease share long-term prognosis of non-lean: time for reappraisal of BMI-driven approach?, Gut
  17. Pindjakova, 2017, Gut dysbiosis and adaptive immune response in diet-induced obesity vs systemic inflammation, Front Microbiol, 8, 10.3389/fmicb.2017.01157 · DOI
  18. Goldstein, 2006, Protein sensors for membrane sterols, Cell, 124, 35, 10.1016/j.cell.2005.12.022 · DOI · Paper page
  19. Guo, 2019, Cholesterol homeostatic regulator SCAP-SREBP2 integrates NLRP3 inflammasome activation and cholesterol biosynthetic signaling in macrophages, Eur J Immunol, 49, 1278
  20. Chen, 2014, Inflammatory stress induces statin resistance by disrupting 3-hydroxy-3-methylglutaryl-CoA reductase feedback regulation, Arterioscler Thromb Vasc, 34, 365, 10.1161/ATVBAHA.113.301301 · DOI · Paper page
  21. Ye, 2009, Inflammatory stress increases unmodified LDL uptake via LDL receptor: an alternative pathway for macrophage foam-cell formation, Inflamm Res, 58, 809, 10.1007/s00011-009-0052-4 · DOI · Paper page
  22. Ma, 2008, Inflammatory stress exacerbates lipid accumulation in hepatic cells and fatty livers of apolipoprotein E knockout mice, Hepatology, 48, 770, 10.1002/hep.22423 · DOI · Paper page
  23. Li, 2013, Cross-talk between TLR4-MyD88-NF-κB and SCAP-SREBP2 pathways mediates macrophage foam cell formation, Am J Physiol Heart Circ Physiol, 304, H874, 10.1152/ajpheart.00096.2012 · DOI · Paper page
  24. Ouyang, 2018, Dysfunction of cholesterol sensor SCAP promotes inflammation activation in THP-1 macrophages, Exp Cell Res, 367, 162, 10.1016/j.yexcr.2018.03.032 · DOI · Paper page
  25. Li, 2021, Sterol-resistant SCAP overexpression in vascular smooth muscle cells accelerates atherosclerosis by increasing local vascular inflammation through activation of the NLRP3 inflammasome in mice, Aging Dis, 12, 747, 10.14336/AD.2020.1120 · DOI · Paper page
  26. Perkins, 2012, The diverse and complex roles of NF-κB subunits in cancer, Nature Reviews Cancer, 12, 121, 10.1038/nrc3204 · DOI
  27. Zhao, 2018, TBK1 at the crossroads of inflammation and energy homeostasis in adipose tissue, Cell, 172, 731, 10.1016/j.cell.2018.01.007 · DOI · Paper page
  28. Luo, 2018, Expression of STING is increased in liver tissues from patients with NAFLD and promotes macrophage-mediated hepatic inflammation and fibrosis in mice, Gastroenterology, 155, 1971, 10.1053/j.gastro.2018.09.010 · DOI · Paper page
  29. Yu, 2019, STING-mediated inflammation in Kupffer cells contributes to progression of nonalcoholic steatohepatitis, J Clin Invest, 129, 546, 10.1172/JCI121842 · DOI
  30. Li, 2019, STING-IRF3 contributes to lipopolysaccharide-induced cardiac dysfunction, inflammation, apoptosis and pyroptosis by activating NLRP3, Redox Biology, 24, 10.1016/j.redox.2019.101215 · DOI
  31. Tojima, 2000, NAK is an IkappaB kinase-activating kinase, Nature, 404, 778, 10.1038/35008109 · DOI
  32. Vergnes, 2003, Cholesterol and cholate components of an atherogenic diet induce distinct stages of hepatic inflammatory gene expression, J Biol Chem, 278, 42774, 10.1074/jbc.M306022200 · DOI
  33. Abate, 2012, Adipocyte maturation arrest: a determinant of systemic insulin resistance to glucose disposal, J Clin Endocr Metab, 97, 760, 10.1210/jc.2012-1140 · DOI
  34. van Hall, 2003, Interleukin-6 stimulates lipolysis and fat oxidation in humans, J Clin Endocr Metab, 88, 3005, 10.1210/jc.2002-021687 · DOI · Paper page
  35. Yang, 2011, Relative contribution of adipose triglyceride lipase and hormone-sensitive lipase to tumor necrosis factor-α (TNF-α)-induced lipolysis in adipocytes, J Biol Chem, 286, 40477, 10.1074/jbc.M111.257923 · DOI
  36. Smith, 2013, Liver disease: Kupffer cells regulate the progression of ALD and NAFLD, Nature Reviews Gastroenterology Hepatology, 10, 503, 10.1038/nrgastro.2013.140 · DOI
  37. Ning, 2020, Cytosolic DNA-STING-NLRP3 axis is involved in murine acute lung injury induced by lipopolysaccharide, Clinical and Translational Medicine, 10, e228, 10.1002/ctm2.228 · DOI
  38. Piperno, 2020, Wiskott-Aldrich syndrome protein restricts cGAS/STING activation by dsDNA immune complexes, JCI insight, 5, 10.1172/jci.insight.132857 · DOI
  39. Shang, 2019, Cryo-EM structures of STING reveal its mechanism of activation by cyclic GMP-AMP, Nature, 567, 389, 10.1038/s41586-019-0998-5 · DOI

Cited by

Sorted by citations

Metadata

Authors
Huang, X., Yao, Y., Hou, X., Wei, L., Rao, Y., Su, Y., Zheng, G., Ruan, X. Z., Li, D., & Chen, Y.
Venue
Cellular and Molecular Gastroenterology and Hepatology
Publisher
Elsevier BV
Published
2022
Volume
14
Issue
1
Pages
1-26
ISSN
2352-345X
Cited by
70
References
4
Language
en
Funders
  • Higher Education Discipline Innovation Project (D20028)
  • National Natural Science Foundation of China (81900406, 82170586)
  • China Postdoctoral Science Foundation (2019M663448)
  • Chongqing Medical University
  • Natural Science Foundation of Chongqing (CSTC2019JCYJ-BSHX0094)
  • Chongqing Research Program of Basic Research and Frontier Technology (cstc2020jcyj-zdxmX0007)

About these checks

Registry, retraction, Cites and statistics results are computed, not judged, with one exception: a printed reference that no index lists is read once by a model before it counts as a citation error. Claims are extracted by a model and kept only when their quote appears verbatim in the text; each cited source is then checked, with a model’s help, for whether it says what the claim relies on. Those verdicts can be wrong — read the claim’s quote and the cited source before relying on one.

Statistics and arithmetic are recomputed, not judged.

Confidence bands are shown only for fields calibrated on our annotated test set. None is calibrated yet, so no band is shown.

What counts as a claim ›How we measure confidence ›How we check this ›

Are you an author, or do you see a problem with this page? Request a review