

The DOI matches its Crossref record; 83 of the 87 references it cites were found in a registry or an index.
Dual-drug loaded nanoparticles of Epigallocatechin-3-gallate (EGCG)/Ascorbic acid enhance therapeutic efficacy of EGCG in a APPswe/PS1dE9 Alzheimer's disease mice model
Open accessAbstract
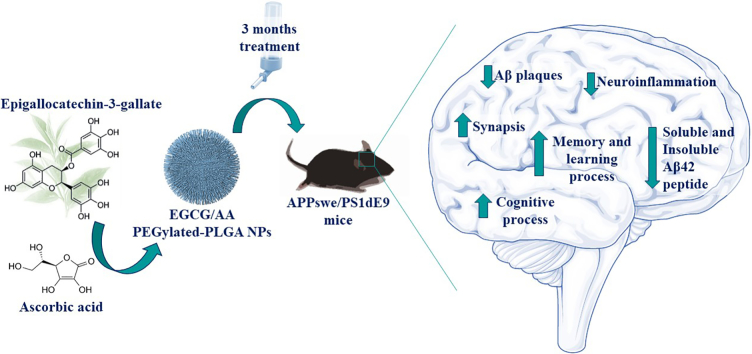
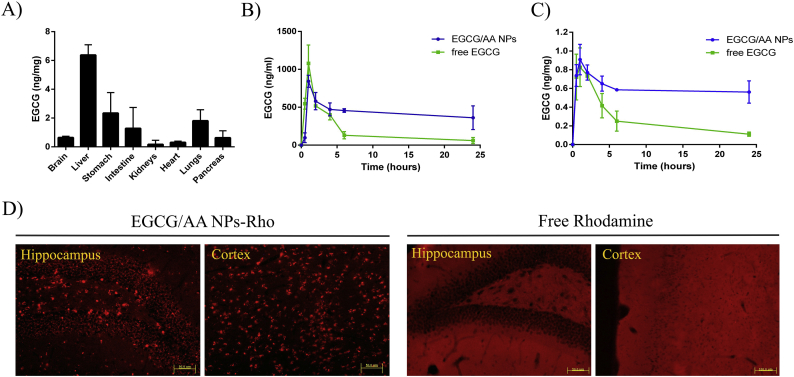
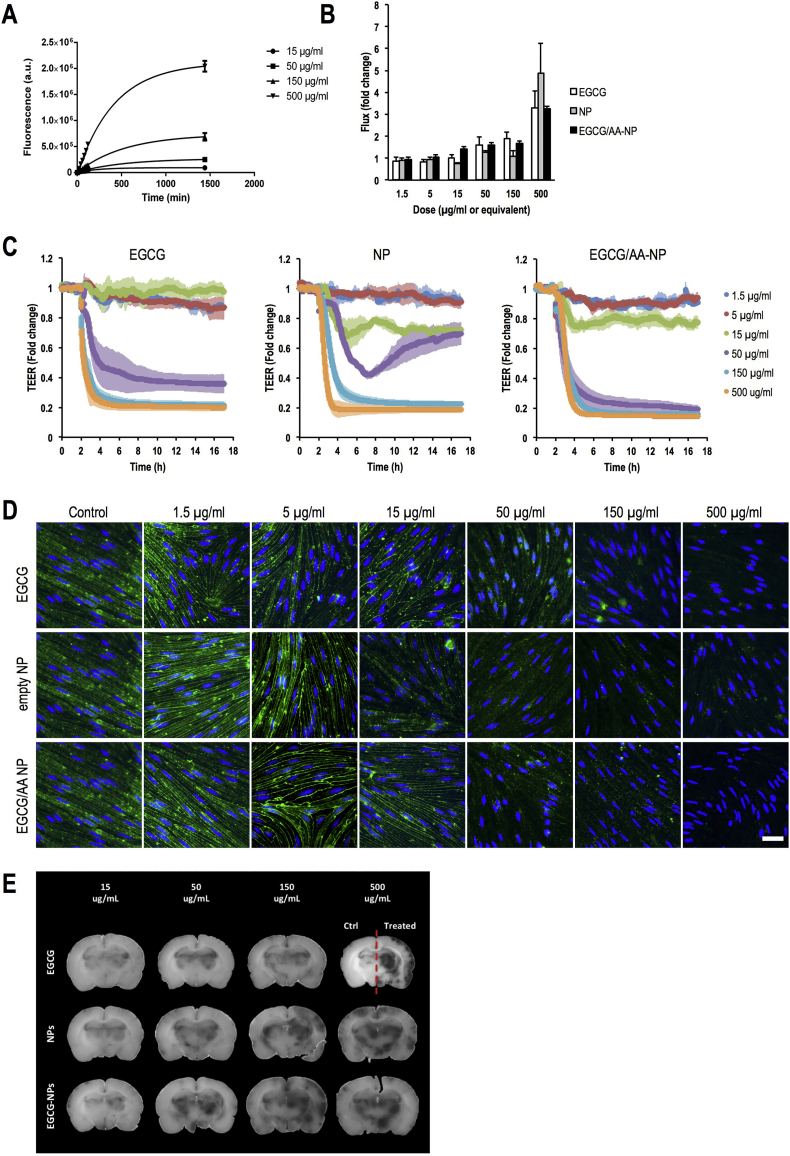
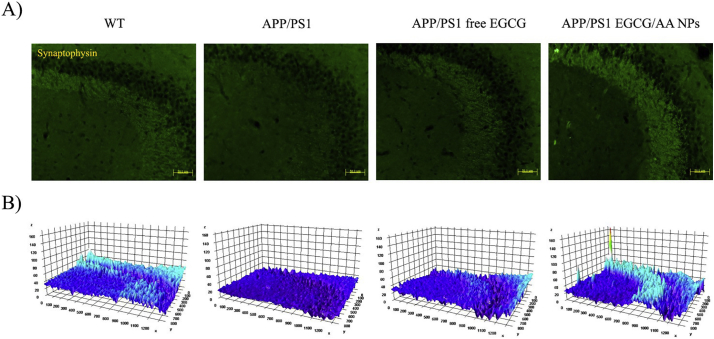
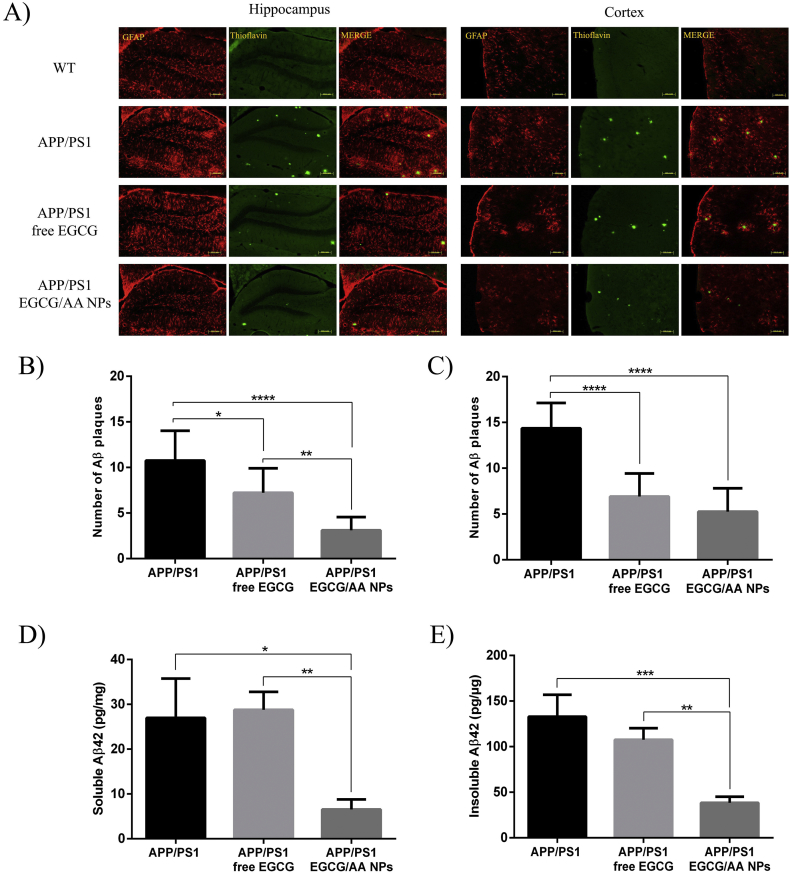
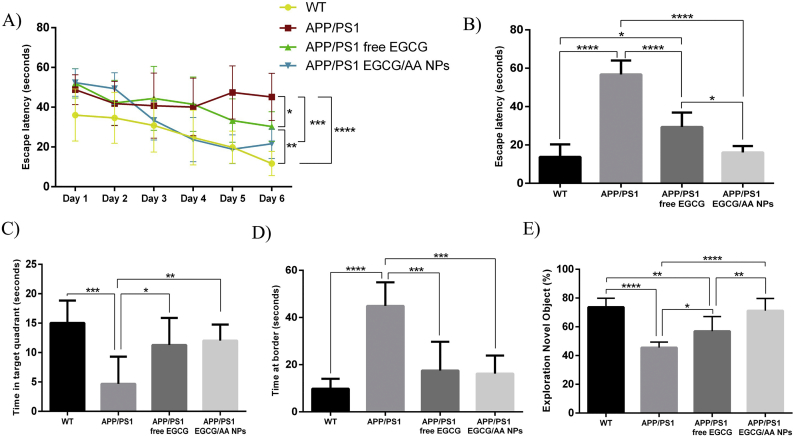
Epigallocatechin-3-gallate (EGCG) is a candidate for treatment of Alzheimer's disease (AD) but its inherent instability limits bioavailability and effectiveness. We found that EGCG displayed increased stability when formulated as dual-drug loaded PEGylated PLGA nanoparticles (EGCG/AA NPs). Oral administration of EGCG/AA NPs in mice resulted in EGCG accumulation in all major organs, including the brain. Pharmacokinetic comparison of plasma and brain accumulation following oral administration of free or EGCG/AA NPs showed that, whilst in both cases initial EGCG concentrations were similar, long-term (5–25 h) concentrations were ca. 5 fold higher with EGCG/AA NPs. No evidence was found that EGCG/AA NPs utilised a specific pathway across the blood-brain barrier (BBB). However, EGCG, empty NPs and EGCG/AA NPs all induced tight junction disruption and opened the BBB in vitro and ex vivo. Oral treatment of APPswe/PS1dE9 (APP/PS1) mice, a familial model of AD, with EGCG/AA NPs resulted in a marked increase in synapses, as judged by synaptophysin (SYP) expression, and reduction of neuroinflammation as well as amyloid β (Aβ) plaque burden and cortical levels of soluble and insoluble Aβ(1-42) peptide. These morphological changes were accompanied by significantly enhanced spatial learning and memory. Mechanistically, we propose that stabilisation of EGCG in NPs complexes and a destabilized BBB led to higher therapeutic EGCG concentrations in the brain. Thus EGCG/AA NPs have the potential to be developed as a safe and strategy for the treatment of AD.
Overview
The claims and statistics of this paper haven’t been checked yet.
Run the check — free, no account needed. It reads the open-access text and checks the sources it cites.
Integrity signals
Registry
Cites
Statistics
Figures
Verification
Claims the paper makes
The claims and statistics of this paper haven’t been checked yet.
Run the check — free, no account needed. It reads the open-access text and checks the sources it cites.
Claims other papers make about this one
Each is checked against this paper’s own text: does it say what the citing paper says it does?
In the citing paper
“In an interesting in vivo study, oral delivery of epigallocatechin-3-gallate (EGCG) NP formulation in an APP/PS1 AD mouse model reduced neuroinflammation and AB plaque (Fig. 3a–c).”
From Targeted therapy in chronic diseases using nanomaterial-based drug delivery vehicles (2019) · cites this paper as [114]
In the citing paper
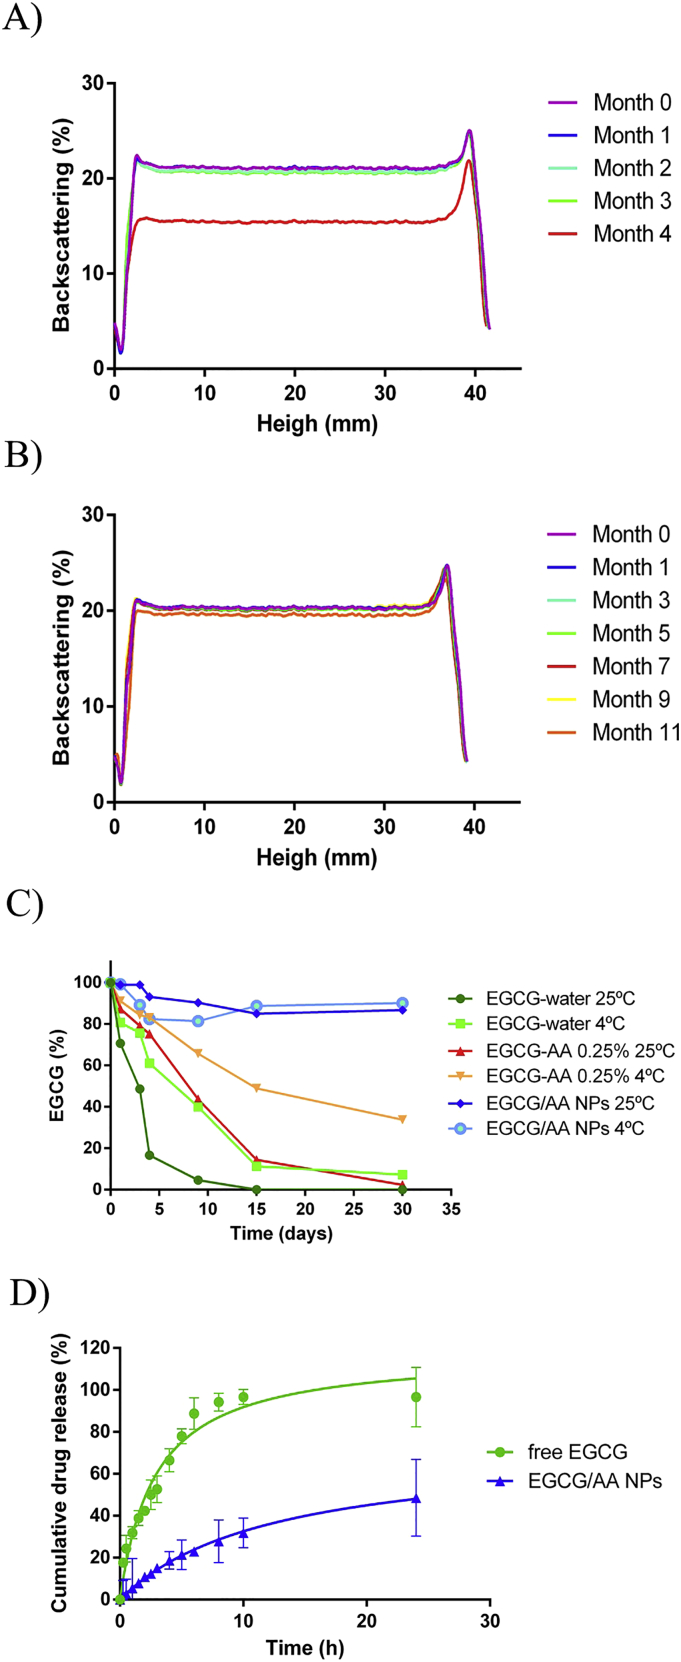
“EGCG in combination with PEGylated PLGA NPs (EGCG/AA NPs) displayed increased stability and sustained release with high bioavailability compared to that of free EGCG.”
From Targeted therapy in chronic diseases using nanomaterial-based drug delivery vehicles (2019) · cites this paper as [114]
In the citing paper
“Furthermore, these data were supported by significantly improved spatial learning and memory (Fig. 3d, e).114”
From Targeted therapy in chronic diseases using nanomaterial-based drug delivery vehicles (2019) · cites this paper as [114]
Self-check
Percentages, sums and reported differences re-computed from the paper’s own numbers.
The self-check needs the paper’s full text.
Citations
Cites
Polazzi, E., Mengoni, I., Caprini, M., Peña‐Altamira, E., Kurtys, E., & Monti, B. (2012) · Neurosignals · doi:10.1159/000337115 · Cited by 9,023
Place navigation impaired in rats with hippocampal lesions
Morris, R. G. M., Garrud, P., Rawlins, J. N. P., & O'Keefe, J. (1982) · Nature · doi:10.1038/297681a0 · Cited by 6,340
Global prevalence of dementia: a Delphi consensus study
Ferri, C. P., Prince, M. J., Brayne, C., Brodaty, H., Fratiglioni, L., Ganguli, M., Hall, K. S., Hasegawa, K., Hendrie, H. C., Huang, Y., et al. (2005) · The Lancet · doi:10.1016/s0140-6736(05)67889-0 · Cited by 5,336
2016 Alzheimer's disease facts and figures
Alzheimer's Association (2016) · Alzheimer's & Dementia · doi:10.1016/j.jalz.2016.03.001 · Cited by 5,069
Soluble protein oligomers in neurodegeneration: lessons from the Alzheimer's amyloid β-peptide
Haass, C., & Selkoe, D. J. (2007) · Nature Reviews Molecular Cell Biology · doi:10.1038/nrm2101 · Cited by 4,744
Microglia: Active sensor and versatile effector cells in the normal and pathologic brain
Hanisch, U.-K., & Kettenmann, H. (2007) · Nature Neuroscience · doi:10.1038/nn1997 · Cited by 3,676
Biodegradable polymeric nanoparticles as drug delivery devices
Soppimath, K. S., Aminabhavi, T. M., Kulkarni, A. R., & Rudzinski, W. E. (2001) · Journal of Controlled Release · doi:10.1016/s0168-3659(00)00339-4 · Cited by 3,549
Biodegradation and biocompatibility of PLA and PLGA microspheres
Anderson, J. M., & Shive, M. S. (1997) · Advanced Drug Delivery Reviews · doi:10.1016/s0169-409x(97)00048-3 · Cited by 2,617
Ballard, C., Gauthier, S., Corbett, A., Brayne, C., Aarsland, D., & Jones, E. (2011) · The Lancet · doi:10.1016/s0140-6736(10)61349-9 · Cited by 2,336
Saraiva, C., Praça, C., Ferreira, R., Santos, T., Ferreira, L., & Bernardino, L. (2016) · Journal of Controlled Release · doi:10.1016/j.jconrel.2016.05.044 · Cited by 1,609
Research works printed but not linked: 1
- 2009, Development and validation of in vitro release testing methods for semisolid formulations, vol. 10, 1
Cited by
Sorted by citations
Polymeric Nanoparticles: Production, Characterization, Toxicology and Ecotoxicology
Zielińska, A., Carreiró, F., Oliveira, A. M., Neves, A., Pires, B., Venkatesh, D. N., Durazzo, A., Lucarini, M., Eder, P., Silva, A. M., et al. (2020) · Molecules · doi:10.3390/molecules25163731 · Cited by 1,560
Self-citationTargeted therapy in chronic diseases using nanomaterial-based drug delivery vehicles
Singh, A. P., Biswas, A., Shukla, A., & Maiti, P. (2019) · Signal Transduction and Targeted Therapy · doi:10.1038/s41392-019-0068-3 · Cited by 645
Zhao, X., Pei, D., Yang, Y., Xu, K., Yu, J. X., Zhang, Y., Zhang, Q., He, G., Zhang, Y., Li, A., et al. (2021) · Advanced Functional Materials · doi:10.1002/adfm.202009442 · Cited by 510
Functionalized Nanomaterials Capable of Crossing the Blood–Brain Barrier
Zha, S., Liu, H., Li, H., Li, H., Wong, K.-L., & All, A. H. (2024) · ACS Nano · doi:10.1021/acsnano.3c10674 · Cited by 378
Applications of Phyto-Nanotechnology for the Treatment of Neurodegenerative Disorders
Bhattacharya, T., Soares, G. A. B. E., Chopra, H., Rahman, M. M., Hasan, Z., Swain, S. S., & Cavalu, S. D. (2022) · Materials · doi:10.3390/ma15030804 · Cited by 267
Metadata
- Authors
- Cano, A., Ettcheto, M., Chang, J.-H., Barroso, E., Espina, M., Kühne, B. A., Barenys, M., Auladell, C., Folch, J., Souto, E. B., Camins, A., Turowski, P., & García, M. L.
- Affiliations
- Biomedical Research Networking Center on Neurodegenerative Diseases (ES)
- University College London (GB)
- Hospital Sant Joan de Déu Barcelona (ES)
- Institut de Nanociència i Nanotecnologia de la Universitat de Barcelona (ES)
- Universitat de Barcelona (ES)
- University of Coimbra (PT)
- Corresponding author
- Turowski, Patric
- García, Maria Luisa
- ORCID
- Venue
- Journal of Controlled Release
- Publisher
- Elsevier BV
- Published
- 2019-05
- Volume
- 301
- Pages
- 62-75
- ISSN
- 0168-3659 (ISSN-L)
- PMC
- PMC6510952
- OpenAlex
- W2920901214
- Cited by
- 337
- References
- 87
- Citations by year
- 2026: 31 · 2025: 55 · 2024: 45 · 2023: 52 · 2022: 58 · 2021: 49 · 2020: 38 · 2019: 8
- FWCI
- 26.22
- Type
- journal article
- Language
- en
- Open access
- hybrid
- doi.org
- Licence
- Locations
- Journal of Controlled Release (publishedVersion, cc-by)
- PubMed Central (publishedVersion, cc-by)
- PubMed (publishedVersion)
- Dipòsit Digital de la Universitat de Barcelona (Universitat de Barcelona) (submittedVersion, cc-by-nc-nd)
- UCL Discovery (University College London) (submittedVersion)
- Funders
- British Heart Foundation (FS/16/26/32193)
- Ministerio de Ciencia e Innovación (PI2016/01, SAF2017-84283-R, MAT 2014-59134-R, CB06/05/0024)
- Centro de Investigación Biomédica en Red sobre Enfermedades Neurodegenerativas
- European Regional Development Fund
- Generalitat de Catalunya (CVE-DOGC-B-14206020-2014)
- Topics
- Life Sciences › Neuroscience › Cellular and Molecular Neuroscience › Alzheimer's disease research and treatments
- Physical Sciences › Materials Science › Biomaterials › Nanoparticle-Based Drug Delivery
- Life Sciences › Agricultural and Biological Sciences › Food Science › Tea Polyphenols and Effects
- Keywords
- epigallocatechin gallate, vitamin C, Alzheimer's disease, APP/PS1 mice, blood-brain barrier disruption, tight junctions, oral bioavailability, brain accumulation, amyloid-beta, neuroinflammation, synaptophysin, spatial learning and memory, drug stability
- MeSH terms
- Polylactic Acid-Polyglycolic Acid Copolymer, Alzheimer Disease, Animals, Antioxidants, Ascorbic Acid, Brain, Catechin, Disease Models, Animal, Drug Carriers, Male, Mice, Inbred C57BL, Mice, Transgenic, Polyethylene Glycols, Amyloid beta-Peptides, Endothelial Cells, Rats, Nanoparticles, Drug Liberation
About these checks
Registry, retraction, Cites and statistics results are computed, not judged, with one exception: a printed reference that no index lists is read once by a model before it counts as a citation error. Claims are extracted by a model and kept only when their quote appears verbatim in the text; each cited source is then checked, with a model’s help, for whether it says what the claim relies on. Those verdicts can be wrong — read the claim’s quote and the cited source before relying on one.
Statistics and arithmetic are recomputed, not judged.
Confidence bands are shown only for fields calibrated on our annotated test set. None is calibrated yet, so no band is shown.
What counts as a claim ›How we measure confidence ›How we check this ›
Are you an author, or do you see a problem with this page? Request a review
