

The DOI matches its Crossref record; 74 of the 75 references it cites were found in a registry or an index.
Systematic analysis of intrinsic enhancer-promoter compatibility in the mouse genome
Open accessPublished version of a preprint
Abstract
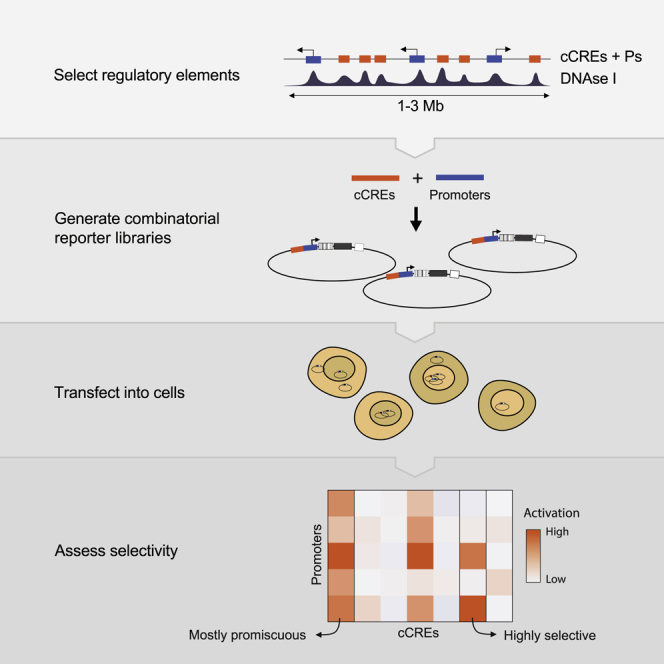
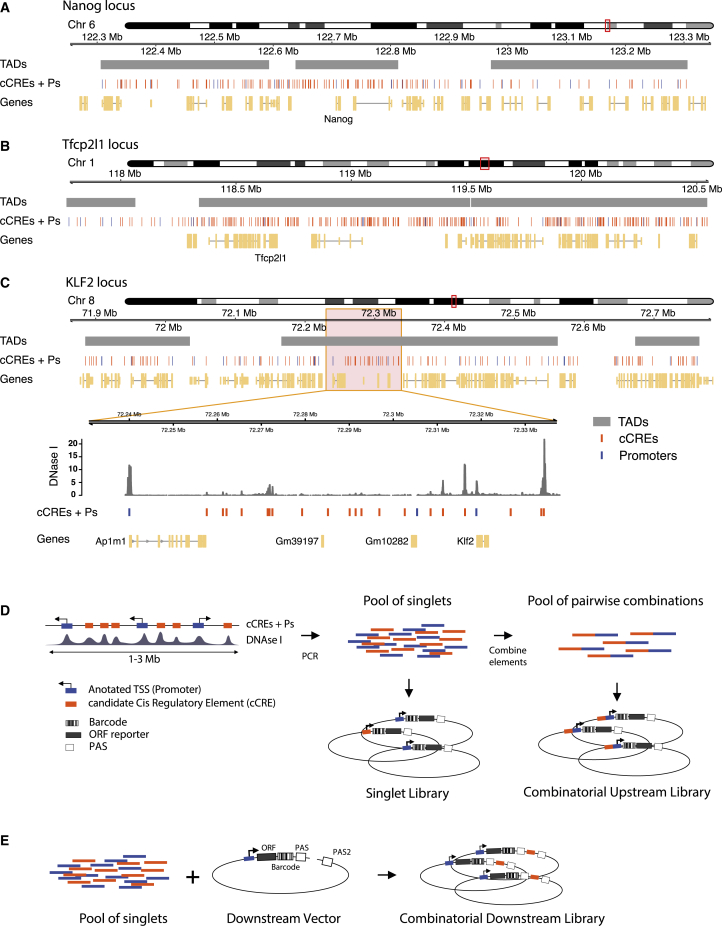
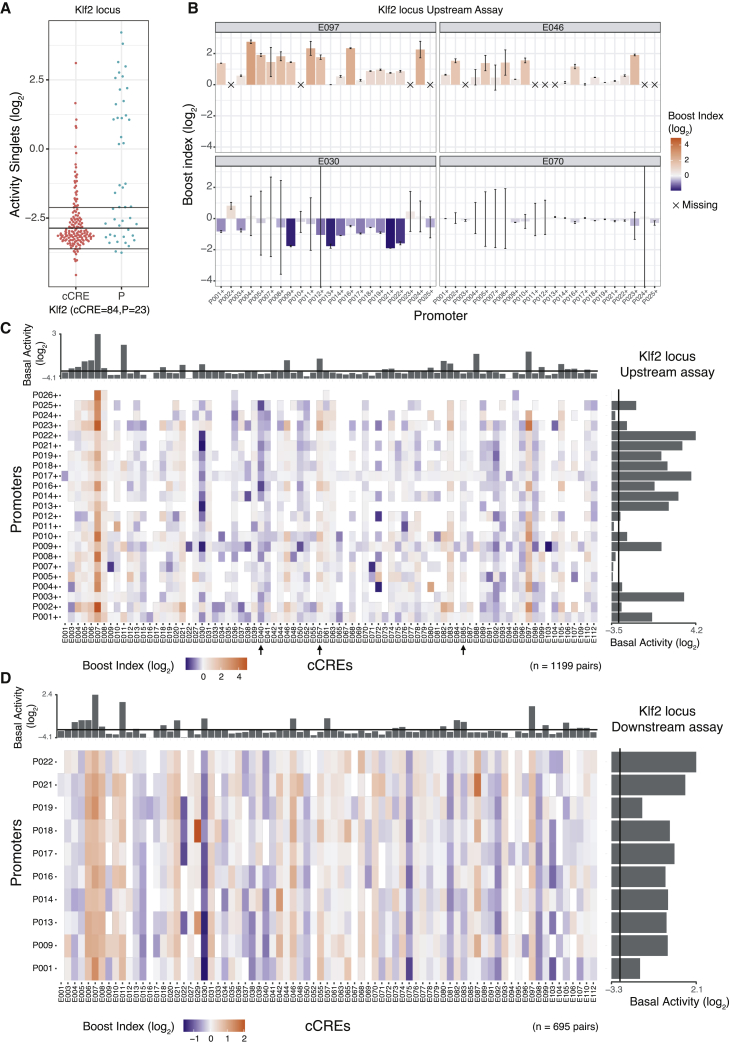
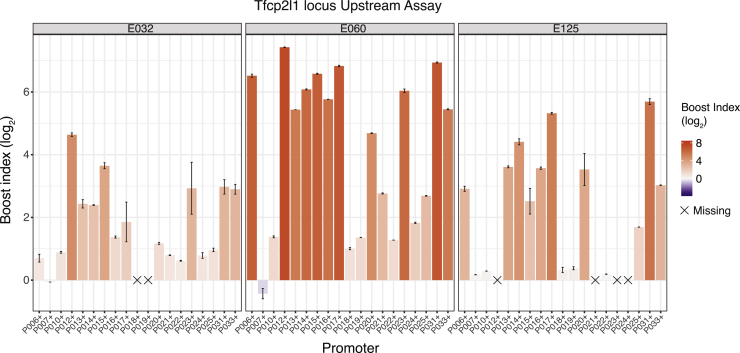
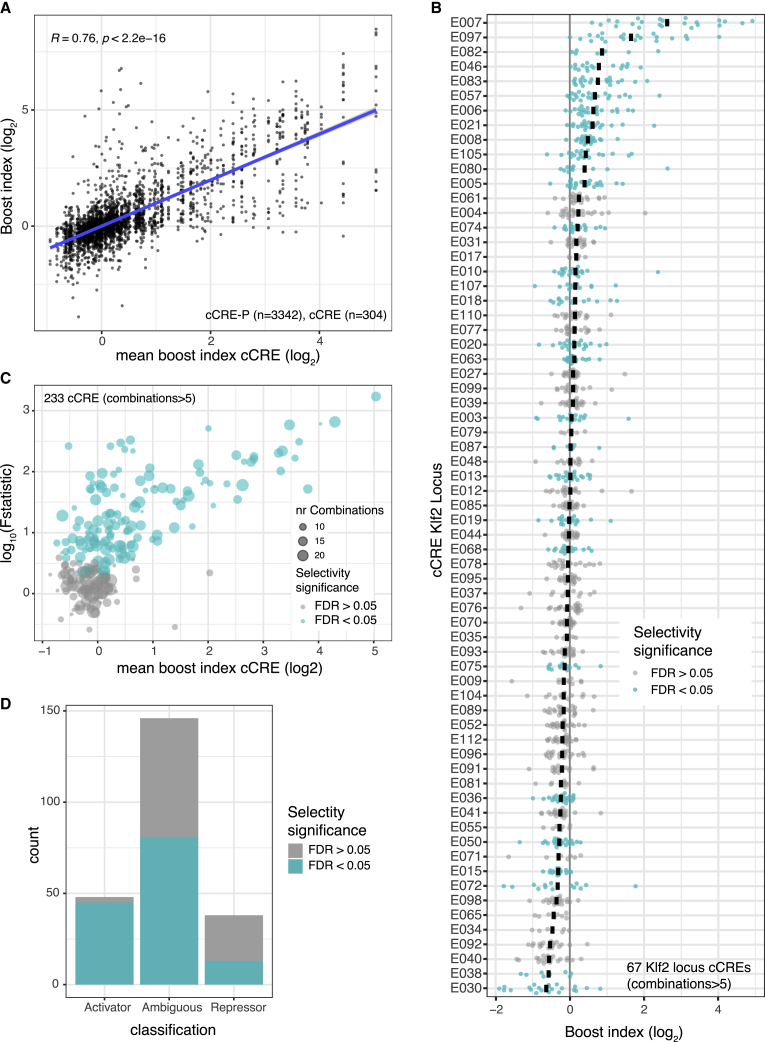
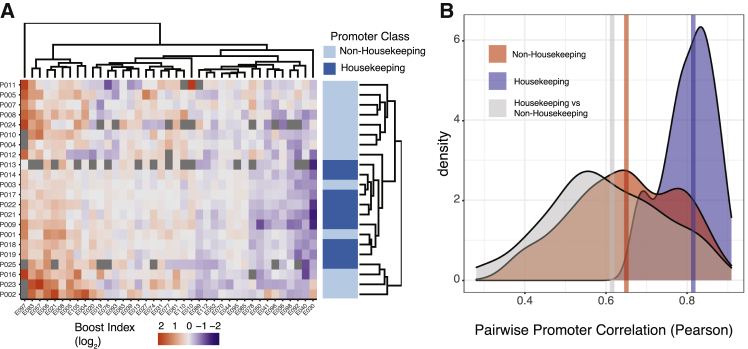
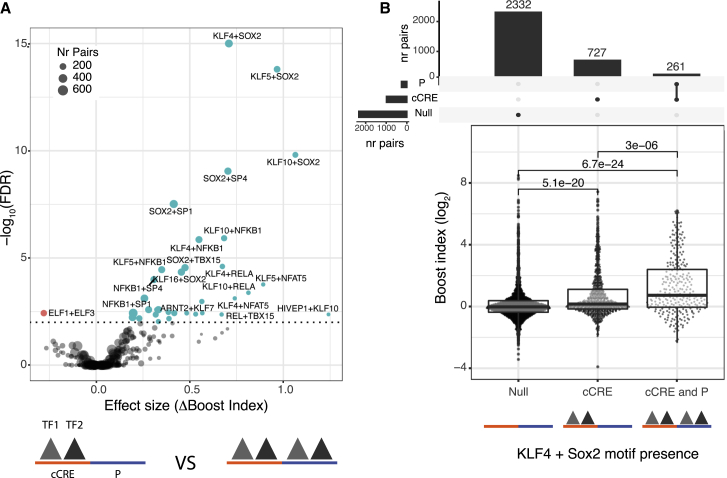
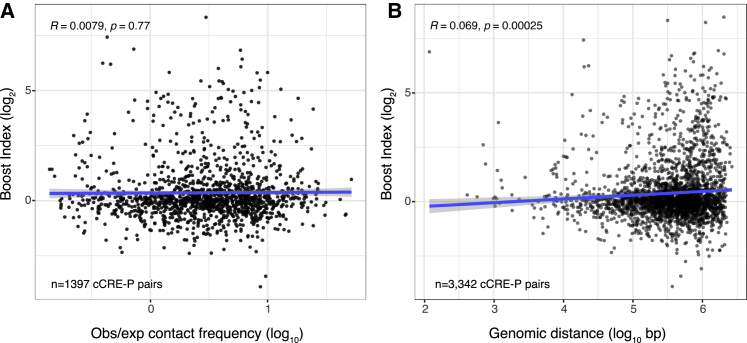
Gene expression is in part controlled by cis-regulatory elements (CREs) such as enhancers and repressive elements. Anecdotal evidence has indicated that a CRE and a promoter need to be biochemically compatible for promoter regulation to occur, but this compatibility has remained poorly characterized in mammalian cells. We used high-throughput combinatorial reporter assays to test thousands of CRE-promoter pairs from three Mb-sized genomic regions in mouse cells. This revealed that CREs vary substantially in their promoter compatibility, ranging from striking specificity to broad promiscuity. More than half of the tested CREs exhibit significant promoter selectivity. Housekeeping promoters tend to have similar CRE preferences, but other promoters exhibit a wide diversity of compatibilities. Higher-order transcription factors (TF) motif combinations may account for compatibility. CRE-promoter selectivity does not correlate with looping interactions in the native genomic context, suggesting that chromatin folding and compatibility are two orthogonal mechanisms that confer specificity to gene regulation.
Overview
The claims and statistics of this paper haven’t been checked yet.
Run the check — free, no account needed. It reads the open-access text and checks the sources it cites.
Integrity signals
Registry
Cites
Statistics
Figures
Verification
Claims the paper makes
The claims and statistics of this paper haven’t been checked yet.
Run the check — free, no account needed. It reads the open-access text and checks the sources it cites.
Claims other papers make about this one
Each is checked against this paper’s own text: does it say what the citing paper says it does?
The cited source says what the claim attributes to it.
In the citing paper
“Analysis of a number of enhancer-promoter pairs in the mouse genome has demonstrated that different enhancers show various levels of specificity, ranging from the ability to activate a wide range of promoters to highly specific activation of a particular promoter [136].”
From Enhancer Function in the 3D Genome (2023) · cites this paper as [136]
Self-check
Percentages, sums and reported differences re-computed from the paper’s own numbers.
The self-check needs the paper’s full text.
Citations
Cites
R: A Language and Environment for Statistical Computing
R Core Team (2000) · doi:10.32614/r.manuals · Cited by 355,893
Fast gapped-read alignment with Bowtie 2
Langmead, B., & Salzberg, S. L. (2012) · Nature Methods · doi:10.1038/nmeth.1923 · Cited by 56,400
An integrated encyclopedia of DNA elements in the human genome
The ENCODE Project Consortium (2012) · Nature · doi:10.1038/nature11247 · Cited by 18,072
ggplot2: Elegant Graphics for Data Analysis
Ginestet, C. E. (2011) · Journal of the Royal Statistical Society Series A (Statistics in Society) · doi:10.1111/j.1467-985x.2010.00676_9.x · Cited by 14,511
Heinz, S., Benner, C., Spann, N., Bertolino, E., Lin, Y. C., Laslo, P., Cheng, J. X., Murre, C., Singh, H., & Glass, C. K. (2010) · Molecular Cell · doi:10.1016/j.molcel.2010.05.004 · Cited by 13,382
MEME SUITE: tools for motif discovery and searching
Bailey, T. L., Boden, M., Buske, F. A., Frith, M., Grant, C. E., Clementi, L., Ren, J., Li, W. W., & Noble, W. S. (2009) · Nucleic Acids Research · doi:10.1093/nar/gkp335 · Cited by 10,648
Landscape of transcription in human cells
Djebali, S., Davis, C. A., Merkel, A., Dobin, A., Lassmann, T., Mortazavi, A., Tanzer, A., Lagarde, J., Lin, W., Schlesinger, F., et al. (2012) · Nature · doi:10.1038/nature11233 · Cited by 5,187
GENCODE reference annotation for the human and mouse genomes
Frankish, A., Diekhans, M., Ferreira, A.-M., Johnson, R., Jungreis, I., Loveland, J. E., Mudge, J. M., Sisu, C., Wright, J. C., Armstrong, J. C., et al. (2018) · Nucleic Acids Research · doi:10.1093/nar/gky955 · Cited by 3,006
Snakemake—a scalable bioinformatics workflow engine
Köster, J., & Rahmann, S. (2012) · Bioinformatics · doi:10.1093/bioinformatics/bts480 · Cited by 2,780
An atlas of active enhancers across human cell types and tissues
The FANTOM Consortium, Andersson, R., Gebhard, C., Miguel-Escalada, I., Hoof, I., Bornholdt, J., Boyd, M., Chen, Y., Zhao, X., Schmidl, C., et al. (2014) · Nature · doi:10.1038/nature12787 · Cited by 2,550
Cited by
Sorted by citations
Deciphering the multi-scale, quantitative cis-regulatory code
Kim, S., & Wysocka, J. (2023) · Molecular Cell · doi:10.1016/j.molcel.2022.12.032 · Cited by 302
Enhancer selectivity in space and time: from enhancer–promoter interactions to promoter activation
Yang, J. H., & Hansen, A. S. (2024) · Nature Reviews Molecular Cell Biology · doi:10.1038/s41580-024-00710-6 · Cited by 191
Compatibility rules of human enhancer and promoter sequences
Bergman, D. T., Jones, T. R., Liu, V., Ray, J., Jagoda, E., Siraj, L., Kang, H. Y., Nasser, J., Kane, M., Rios, A., et al. (2022) · Nature · doi:10.1038/s41586-022-04877-w · Cited by 169
An encyclopedia of enhancer-gene regulatory interactions in the human genome
Gschwind, A. R., Mualim, K. S., Karbalayghareh, A., Sheth, M. U., Dey, K. K., Jagoda, E., Nurtdinov, R. N., Xi, W., Tan, A. S., Jones, H., et al. (2023) · doi:10.1101/2023.11.09.563812 · Cited by 119
Identification of non-coding silencer elements and their regulation of gene expression
Pang, B., van Weerd, J. H., Hamoen, F. L., & Snyder, M. P. (2022) · Nature Reviews Molecular Cell Biology · doi:10.1038/s41580-022-00549-9 · Cited by 103
Increased enhancer–promoter interactions during developmental enhancer activation in mammals
Chen, Z., Snetkova, V., Bower, G., Jacinto, S. H., Clock, B., Dizehchi, A., Barozzi, I., Mannion, B. J., Alcaina‐Caro, A., López-Ríos, J., et al. (2024) · Nature Genetics · doi:10.1038/s41588-024-01681-2 · Cited by 98
Current challenges in understanding the role of enhancers in disease
Zaugg, J. B., Sahlén, P., Andersson, R., Alberich-Jordà, M., de Laat, W. L., Deplancke, B., Ferrer, J. P., Mandrup, S., Natoli, G., Plewczyński, D., et al. (2022) · Nature Structural & Molecular Biology · doi:10.1038/s41594-022-00896-3 · Cited by 86
The chromatin signatures of enhancers and their dynamic regulation
Barral, A., & Déjardin, J. (2023) · Nucleus · doi:10.1080/19491034.2022.2160551 · Cited by 78
Enhancer-gene specificity in development and disease
Pachano, T., Haro, E., & Rada-Iglesias, Á. (2022) · Development · doi:10.1242/dev.186536 · Cited by 58
Regulating specificity in enhancer–promoter communication
Galouzis, C. C., & Furlong, E. E. M. (2022) · Current Opinion in Cell Biology · doi:10.1016/j.ceb.2022.01.010 · Cited by 61
Lalanne, J., Regalado, S. G., Domcke, S., Calderon, D., Martin, B., Li, X., Li, T., Suiter, C. C., Lee, C., Trapnell, C., et al. (2024) · Nature Methods · doi:10.1038/s41592-024-02260-3 · Cited by 57
Repression and 3D-restructuring resolves regulatory conflicts in evolutionarily rearranged genomes
Ringel, A. R., Szabo, Q., Chiariello, A. M., Chudzik, K., Schöpflin, R., Rothe, P., Mattei, A. L., Zehnder, T., Harnett, D., Laupert, V., et al. (2022) · Cell · doi:10.1016/j.cell.2022.09.006 · Cited by 50
Pioneer activity distinguishes activating from non‐activating SOX2 binding sites
Maresca, M., van den Brand, T., Li, H., Teunissen, H., Davies, J. O. J., & de Wit, E. (2023) · The EMBO Journal · doi:10.15252/embj.2022113150 · Cited by 39
Mechanisms of Interaction between Enhancers and Promoters in Three Drosophila Model Systems
Kyrchanova, O., Sokolov, V., & Georgiev, P. G. (2023) · International Journal of Molecular Sciences · doi:10.3390/ijms24032855 · Cited by 32
Cohesin-mediated 3D contacts tune enhancer-promoter regulationPreprint
Guckelberger, P., Doughty, B. R., Munson, G., Rao, S. S. P., Tan, Y., Cai, X. S., Fulco, C. P., Nasser, J., Mualim, K. S., Bergman, D. T., et al. (2024) · bioRxiv (Cold Spring Harbor Laboratory) · doi:10.1101/2024.07.12.603288 · Cited by 33
Interpreting cis-regulatory interactions from large-scale deep neural networks
Toneyan, S., & Koo, P. K. (2024) · Nature Genetics · doi:10.1038/s41588-024-01923-3 · Cited by 38
Bell, C. C., Balic, J. J., Talarmain, L., Gillespie, A., Scolamiero, L., Lam, E. Y. N., Ang, C.-S., Faulkner, G. J., Gilan, O., & Dawson, M. A. (2024) · Nature Genetics · doi:10.1038/s41588-024-01749-z · Cited by 30
Regulatory landscape of enhancer-mediated transcriptional activation
Kawasaki, K., & Fukaya, T. (2024) · Trends in Cell Biology · doi:10.1016/j.tcb.2024.01.008 · Cited by 32
Function and Evolution of the Loop Extrusion Machinery in Animals
Kabirova, E., Nurislamov, A. R., Shadskiy, A., Smirnov, A. V., Popov, A., Salnikov, P., Баттулин, Н. Р., & Fishman, V. (2023) · International Journal of Molecular Sciences · doi:10.3390/ijms24055017 · Cited by 27
Thomas, H., & Buecker, C. (2023) · BioEssays · doi:10.1002/bies.202300044 · Cited by 28
Noncoding RNA-chromatin association: Functions and mechanisms
Yin, Y., & Shen, X. (2023) · Fundamental Research · doi:10.1016/j.fmre.2023.03.006 · Cited by 28
Genetic factors mediating long-range enhancer–promoter communication in mammalian development
Bower, G., & Kvon, E. Z. (2024) · Current Opinion in Genetics & Development · doi:10.1016/j.gde.2024.102282 · Cited by 30
Nair, S. J., Suter, T., Wang, S. S., Lu, Y., Yang, F., & Rosenfeld, M. G. (2022) · Trends in Genetics · doi:10.1016/j.tig.2022.05.015 · Cited by 27
Long-range enhancer-controlled genes are hypersensitive to regulatory factor perturbations
Tjalsma, S. J. D., Rinzema, N. J., Verstegen, M. J. A. M., Robers, M. J., Nieto-Aliseda, A., Gremmen, R., Allahyar, A., Muraro, M. J., Krijger, P. H. L., & de Laat, W. L. (2025) · Cell Genomics · doi:10.1016/j.xgen.2025.100778 · Cited by 30
Large-scale analysis of the integration of enhancer-enhancer signals by promotersPreprint
Martinez-Ara, M., Comoglio, F., & van Steensel, B. (2023) · eLife · doi:10.7554/elife.91994 · Cited by 30
Self-citationWeischenfeldt, J., & Ibrahim, D. M. (2023) · Current Opinion in Genetics & Development · doi:10.1016/j.gde.2023.102048 · Cited by 19
Barbosa, I. A. M., Gopalakrishnan, R., Mercan, S., Mourikis, T. P., Martin, T., Wengert, S., Sheng, C., Ji, F., Lopes, R., Knehr, J., et al. (2023) · Nature Communications · doi:10.1038/s41467-023-39527-w · Cited by 23
Modelling and design of transcriptional enhancers
Winter, S. D., Konstantakos, V., & Aerts, S. (2025) · Nature Reviews Bioengineering · doi:10.1038/s44222-025-00280-y · Cited by 21
Li, Y., Tan, M., Akkari-Henić, A., Zhang, L. S., Kip, M., Sun, S., Sepers, J. J., Xu, N., Ariyürek, Y., Kloet, S. L., et al. (2024) · Nature Biomedical Engineering · doi:10.1038/s41551-024-01204-8 · Cited by 18
Challenges and considerations for reproducibility of STARR-seq assaysPreprint
Das, M., Hossain, A., Banerjee, D., Praul, C. A., & Girirajan, S. (2023) · Genome Research · doi:10.1101/gr.277204.122 · Cited by 18
Emerging insights into enhancer biology and function
Arnold, M., & Stengel, K. R. (2023) · Transcription · doi:10.1080/21541264.2023.2222032 · Cited by 20
Li, Z., Zhang, Y., Peng, B., Qin, S., Zhang, Q., Chen, Y., Chen, C., Bao, Y., Zhu, Y. S., Hong, Y., et al. (2024) · Nucleic Acids Research · doi:10.1093/nar/gkae912 · Cited by 22
The logic of native enhancer-promoter compatibility and cell-type-specific gene expression variationPreprint
Narita, T., Higashijima, Y., Kilic, S., Maskey, E., Neumann, K., & Choudhary, C. (2022) · bioRxiv (Cold Spring Harbor Laboratory) · doi:10.1101/2022.07.18.500456 · Cited by 17
Mechanisms of Enhancer-Mediated Gene Activation in the Context of the 3D Genome
Papantonis, A., & Oudelaar, A. M. (2025) · Annual Review of Genomics and Human Genetics · doi:10.1146/annurev-genom-120423-012301 · Cited by 19
Genomic context sensitizes regulatory elements to genetic disruption
Ordóñez, R., Zhang, W., Ellis, G., Zhu, Y., Ashe, H. J., Ribeiro-dos-Santos, A. M., Brosh, R., Huang, E., Hogan, M. S., Boeke, J. D., et al. (2024) · Molecular Cell · doi:10.1016/j.molcel.2024.04.013 · Cited by 22
Enhancer Function in the 3D Genome
Razin, S. V., Ulianov, S. V., & Iarovaia, O. V. (2023) · Genes · doi:10.3390/genes14061277 · Cited by 15
Enhancers: A Focus on Synthetic Biology and Correlated Gene Expression
Bohrer, C. H., Fursova, N. A., & Larson, D. R. (2024) · ACS Synthetic Biology · doi:10.1021/acssynbio.4c00244 · Cited by 14
Örd, T., Örd, D., Adler, P., & Örd, T. (2023) · PLoS Genetics · doi:10.1371/journal.pgen.1011014 · Cited by 15
Hofbauer, L., Pleyer, L., Reiter, F., Schleiffer, A., Vlasova, A. V., Serebreni, L., Huang, A., & Stark, A. (2024) · Molecular Cell · doi:10.1016/j.molcel.2024.10.041 · Cited by 14
Frontiers and techniques in plant gene regulation
Jores, T., Hamm, M. O., Cuperus, J. T., & Queitsch, C. (2023) · Current Opinion in Plant Biology · doi:10.1016/j.pbi.2023.102403 · Cited by 15
The α-globin super-enhancer acts in an orientation-dependent manner
Kassouf, M. T., Francis, H. S., Gosden, M. E., Suciu, M., Downes, D. J., Harrold, C. L., Larke, M., Oudelaar, A. M., Cornell, L., Blayney, J., et al. (2025) · Nature Communications · doi:10.1038/s41467-025-56380-1 · Cited by 16
Massively parallel characterization of insulator activity across the genome
Hong, C. K., Wu, Y., Erickson, A., Li, J., Federico, A. J., & Cohen, B. A. (2024) · Nature Communications · doi:10.1038/s41467-024-52599-6 · Cited by 14
From variants to mechanisms: Neurogenomics in the post-GWAS era
Margolis, M. P., Tang, M., Gagliardi, M., Wen, C. H., Wu, Y., Wray, N. R., Ziller, M. J., & Gandal, M. J. (2025) · Neuron · doi:10.1016/j.neuron.2025.10.014 · Cited by 14
An encyclopedia of human enhancer–gene regulatory interactions
Gschwind, A. R., Mualim, K. S., Karbalayghareh, A., Sheth, M. U., Dey, K. K., Jagoda, E., Nurtdinov, R., Xi, W., Tan, A. S., Galante, J., et al. (2026) · Nature · doi:10.1038/s41586-026-10781-4 · Cited by 161
A Sox2 enhancer cluster regulates region-specific neural fates from mouse embryonic stem cells
Tobias, I. C., Moorthy, S. D., Shchuka, V. M., Langroudi, L., Cherednychenko, M., Gillespie, Z. E., Duncan, A. G., Tian, R., Gajewska, N. A., Roberto, R. B. D., et al. (2025) · G3 Genes Genomes Genetics · doi:10.1093/g3journal/jkaf012 · Cited by 13
Stolper, R. J., Tsang, F. H., Georgiades, E., Hansen, L. L. P., Downes, D. J., Harrold, C. L., Hughes, J. R., Beagrie, R. A., Davies, B., Kassouf, M. T., et al. (2023) · bioRxiv (Cold Spring Harbor Laboratory) · doi:10.1101/2023.09.07.556660 · Cited by 11
The enhancer RNA, AANCR, regulates APOE expression in astrocytes and microglia
Wan, M., Liu, Y., Li, D., Snyder, R. J., Elkin, L. B., Day, C. R., Rodriguez, J., Grunseich, C., Mahley, R. W., Watts, J. A., et al. (2024) · Nucleic Acids Research · doi:10.1093/nar/gkae696 · Cited by 10
Optimized reporters for multiplexed detection of transcription factor activity
Trauernicht, M., Filipovska, T., Rastogi, C., & van Steensel, B. (2024) · Cell Systems · doi:10.1016/j.cels.2024.11.003 · Cited by 10
Integrative approaches to study enhancer–promoter communication
Mach, P., & Giorgetti, L. (2023) · Current Opinion in Genetics & Development · doi:10.1016/j.gde.2023.102052 · Cited by 10
Functional genomic assays to annotate enhancer–promoter interactions genome wide
Leung, A. K.-Y., Li, Y., & Yu, H. (2022) · Human Molecular Genetics · doi:10.1093/hmg/ddac204 · Cited by 9
From Genotype to Phenotype: How Enhancers Control Gene Expression and Cell Identity in Hematopoiesis
Mulet‐Lazaro, R., & Delwel, R. (2023) · HemaSphere · doi:10.1097/hs9.0000000000000969 · Cited by 11
Core promoterome of barley embryo
Pavlu, S., Nikumbh, S., Kovačik, M., An, T., Lenhard, B., Šimková, H., & Navrátilová, P. (2023) · Computational and Structural Biotechnology Journal · doi:10.1016/j.csbj.2023.12.003 · Cited by 9
Claxton, M., Pulix, M., Seah, M. K. Y., Bernardo, R., Zhou, P., Aljuraysi, S., Liloglou, T., Arnaúd, P., Kelsey, G., Messerschmidt, D. M., et al. (2022) · Frontiers in Cell and Developmental Biology · doi:10.3389/fcell.2022.1022422 · Cited by 9
Schofield, J. A., & Hahn, S. (2023) · Cell Reports · doi:10.1016/j.celrep.2023.112387 · Cited by 9
Kribelbauer, J. F., Gardeux, V., Llimos, G., Faltejsková, K., Russeil, J., Grenningloh, N., Levassor, L., Steiner, C., Vondrášek, J., & Deplancke, B. (2024) · bioRxiv (Cold Spring Harbor Laboratory) · doi:10.1101/2024.12.08.627402 · Cited by 6
Zhang, J., Leung, A. K.-Y., Zhu, Y., Yao, L., Willis, A., Pan, X., Ozer, A., Zhou, Z., Siklenka, K., Barrera, A., et al. (2025) · Genome biology · doi:10.1186/s13059-025-03828-8 · Cited by 7
Huang, Y., Verstegen, M. J. A. M., Tjalsma, S. J. D., Krijger, P. H. L., Gupta, K., Park, M., Boettiger, A. N., & de Laat, W. L. (2025) · Genes & Development · doi:10.1101/gad.352235.124 · Cited by 7
Long-range massively parallel reporter assay reveals rules of distal enhancer-promoter interactionsPreprint
Wu, Y., Li, J., Bartley-Dier, E. L., Pitts, C., & Cohen, B. A. (2025) · bioRxiv (Cold Spring Harbor Laboratory) · doi:10.1101/2025.04.21.649048 · Cited by 9
Ray, J., Jagoda, E., Sheth, M. U., Galante, J., Amgalan, D., Mattei, E., Gschwind, A. R., Munger, C. J., Huang, J., Munson, G., et al. (2025) · bioRxiv (Cold Spring Harbor Laboratory) · doi:10.1101/2025.09.16.676677 · Cited by 11
Dual promoter–enhancer activities reflect a unified regulatory logic
Paramo, M. I., Leung, A. K.-Y., Shah, S. R., Zhang, J., Tippens, N. D., Liang, J. H., Yao, L., Jin, Y., Pan, X., Ozer, A., et al. (2026) · Nature Communications · doi:10.1038/s41467-026-68780-y · Cited by 7
Large-scale analysis of the integration of enhancer-enhancer signals by promoters
Martinez-Ara, M., Comoglio, F., & van Steensel, B. (2024) · eLife · doi:10.7554/elife.91994.3 · Cited by 5
Self-citationEbeed, H. T., & El-helely, A. A. (2024) · Plant Gene · doi:10.1016/j.plgene.2024.100483 · Cited by 4
HDI-STARR-seq: Condition-specific enhancer discovery in mouse liver in vivo
Chang, T.-Y., & Waxman, D. J. (2024) · BMC Genomics · doi:10.1186/s12864-024-11162-9 · Cited by 4
Tovar, A., Kyono, Y., Nishino, K., Bose, M., Varshney, A., Parker, S. C. J., & Kitzman, J. O. (2026) · Human Genetics and Genomics Advances · doi:10.1016/j.xhgg.2026.100606 · Cited by 4
Optimization of mammalian expression vector by cis-regulatory element combinations
Zhou, L., Zhang, S., Li, L., Yang, G., & Zeng, L. (2023) · Molecular Genetics and Genomics · doi:10.1007/s00438-023-02042-0 · Cited by 4
Interpreting Cis-Regulatory Interactions from Large-Scale Deep Neural Networks for GenomicsPreprint
Toneyan, S., & Koo, P. K. (2023) · bioRxiv · doi:10.1101/2023.07.03.547592 · Cited by 3
Sloutskin, A., Itzhak, D., Vogler, G., Pozeilov, H., Ideses, D., Alter, H., Adato, O., Shachar, H., Doniger, T., Shohat-Ophir, G., et al. (2024) · Development · doi:10.1242/dev.202355 · Cited by 4
Large-scale analysis of the integration of enhancer-enhancer signals by promotersPreprint
Martinez-Ara, M., Comoglio, F., & van Steensel, B. (2023) · eLife · doi:10.7554/elife.91994.1 · Cited by 3
Self-citationArnould, C., Keukeleire, P., Inoue, F., Cui, X., An, K., Murray, E., Zhang, X., Drmanac, R., Peters, B. A., Shendure, J., et al. (2025) · bioRxiv (Cold Spring Harbor Laboratory) · doi:10.1101/2025.06.11.658967 · Cited by 3
Enhancer‐dependent gene regulation in space, time, and malignancies
Blum, B., Dachtler, V., & Feldmann, A. (2025) · International Journal of Cancer · doi:10.1002/ijc.35350 · Cited by 2
Deregulated enhancer‐promoter communication in cancer through altered nuclear architecture
Seufert, I., Vargas, C., Wille, S. J., & Rippe, K. (2025) · International Journal of Cancer · doi:10.1002/ijc.35424 · Cited by 3
The Cupid shuffle: Do enhancers prefer specific promoters?
Wang, H. V., & Corces, V. G. (2022) · Molecular Cell · doi:10.1016/j.molcel.2022.06.014 · Cited by 2
Synthetic genomic dissection of enhancer context sensitivity and synergyPreprint
Ordóñez, R., Ribeiro-dos-Santos, A. M., Mcloughlin, C., Ellis, G., Ashe, H. J., Berastegui, N., Brosh, R., Majewski, M., Barriball, K., Camellato, B. R., et al. (2025) · bioRxiv (Cold Spring Harbor Laboratory) · doi:10.1101/2025.08.13.669251 · Cited by 5
Enhancer-promoter compatibility is mediated by the promoter-proximal regionPreprint
Majchrzycka, B., Mundlos, S., Krebs, A. R., & Ibrahim, D. M. (2025) · bioRxiv (Cold Spring Harbor Laboratory) · doi:10.1101/2025.10.14.682013 · Cited by 3
Castro, J., Fagerstrom, K., Treaster, S. B., Duryea, J. W., Charles, J. F., & Harris, M. P. (2025) · The Journals of Gerontology Series A · doi:10.1093/gerona/glaf091 · Cited by 1
Visualizing genetic information flow in space and time
Chen, K., Zhao, K., & Wan, Y. (2025) · Science China Life Sciences · doi:10.1007/s11427-025-3158-6 · Cited by 1
Cooperativity between regulatory elements acts as a modulator of enhancer function
Balasubramanian, D., Masoura, M., & Ghavi-Helm, Y. (2026) · Current Opinion in Genetics & Development · doi:10.1016/j.gde.2025.102427 · Cited by 2
How to build the regulatory genome: a constructionist guide to the cis-regulatory code
Bell, C. C., de Boer, C. G., Camellato, B. R., Delàs, M. J., Ibrahim, D. M., & Montgomery, M. T. (2026) · Development · doi:10.1242/dev.205516 · Cited by 2
Becker, R., Choudhury, P., Oti, M., Fouani, Y., Strobel, B., Ketterer, S., Rumpel, S., Park, J., Kreuz, S., Maier, U., et al. (2026) · iScience · doi:10.1016/j.isci.2026.115469 · Cited by 1
Using Synthetic DNA Libraries to Investigate Chromatin and Gene Regulation
Kleinschmidt, H., Xu, C., & Bai, L. (2023) · Chromosoma · doi:10.1007/s00412-023-00796-5 · Cited by 2
Large-scale analysis of the integration of enhancer-enhancer signals by promotersPreprint
Martinez-Ara, M., Comoglio, F., & van Steensel, B. (2024) · eLife · doi:10.7554/elife.91994.2 · Cited by 1
Self-citationNi, C., Ichino, L., Swigut, T., & Wysocka, J. (2026) · bioRxiv (Cold Spring Harbor Laboratory) · doi:10.64898/2026.07.29.741571 · Cited by 2
Choppavarapu, L., Nosirov, B., Kahn, M., & Jin, V. X. (2026) · Cancers · doi:10.3390/cancers18213416
Zhou, L., Zhang, S., Li, L., Liang, D.-G., Yu, H.-S., Chai, Y.-J., Zhao, S.-B., Pan, J., Zhu, H., & Zeng, L. (2022) · Research Square · doi:10.21203/rs.3.rs-2370882/v1
Sloutskin, A., Itzhak, D., Vogler, G., Ideses, D., Alter, H., Shachar, H., Doniger, T., Frasch, M., Bodmer, R., Duttke, S. H. C., et al. (2023) · bioRxiv (Cold Spring Harbor Laboratory) · doi:10.1101/2023.06.11.544490
Barth, D., Cardwell, J., & Han, M. (2023) · bioRxiv (Cold Spring Harbor Laboratory) · doi:10.1101/2023.06.30.547290
Barth, D., Van, R., Cardwell, J., & Han, M. (2024) · Bioinformatics · doi:10.1093/bioinformatics/btae367
Taylor, T., Zhu, H. V., Moorthy, S. D., Khader, N., & Mitchell, J. A. (2024) · PLoS Genetics · doi:10.1371/journal.pgen.1011513 · Cited by 2
High-resolution dissection of human cell type-specific enhancers in cis and trans activities
Wang, M., Yang, X., & Wu, Q. (2025) · Genomics · doi:10.1016/j.ygeno.2025.110985
Paramo, M. I., Leung, A. K.-Y., Shah, S. R., Zhang, J., Tippens, N. D., Liang, J. H., Li, Y., Jin, Y., Pan, X., Ozer, A., et al. (2025) · bioRxiv (Cold Spring Harbor Laboratory) · doi:10.1101/2025.03.14.643265
Is Enhancer Function Driven by Protein–Protein Interactions? From Bacteria to Leukemia
Crump, N. T., & Milne, T. A. (2025) · BioEssays · doi:10.1002/bies.70006 · Cited by 1
Becker, R., Choudhury, P., Oti, M., Fouani, Y., Strobel, B., Ketterer, S., Rumpel, S., Park, J., Kreuz, S., Maier, U., et al. (2025) · bioRxiv (Cold Spring Harbor Laboratory) · doi:10.1101/2025.06.04.657008
HDAC3 prevents enhancer hyperactivation to enable developmental transitionsPreprint
Stamidis, N., Wenzel, A., Uscilo, K. K., Kompocholi, S., Bagés‐Arnal, S., Noviello, G., Gregersen, L. H., Hackett, J. A., & Żylicz, J. J. (2025) · bioRxiv (Cold Spring Harbor Laboratory) · doi:10.1101/2025.08.09.669452
A chromatin-structure-guided framework for predictive and interpretable regulatory genomics
Ye, B., Du, L., Chen, M., Dai, Y. D., Ma, A., & Liang, J. (2026) · Briefings in Bioinformatics · doi:10.1093/bib/bbag360
The architecture of allele-specific regulatory variant effects across five human genomesPreprint
Dura, K., Siklenka, K., Strouse, K., Morrow, S., Majoros, W., & Reddy, T. E. (2025) · bioRxiv · doi:10.1101/2025.11.22.689315
Jin, Y., Hasegawa, Y., Zhou, Z., Lin, J. T., Leung, A. K.-Y., Yu, H., & Lis, J. T. (2026) · bioRxiv (Cold Spring Harbor Laboratory) · doi:10.64898/2026.02.16.706221
Synthetic chromosomes for 3D functional genomics: from principles to AI-guided design
Perrot, M., Serizay, J., & Koszul, R. (2026) · Current Opinion in Genetics & Development · doi:10.1016/j.gde.2026.102471
These powerful tools reveal the ‘control knobs’ of the genome
Eisenstein, M. S. (2026) · Nature · doi:10.1038/d41586-026-01410-1
Mechanisms and functional implications of long-range enhancer-dependent gene regulation
Iliadou, M., Haro, E., & Rada-Iglesias, Á. (2026) · Nature Genetics · doi:10.1038/s41588-026-02721-9 · Cited by 1
The Core Promoter has an active role in interpreting patterning informationPreprint
Karmakar, S., Millen, K., & Bray, S. J. (2026) · bioRxiv (Cold Spring Harbor Laboratory) · doi:10.64898/2026.10.11.758330
Metadata
- Authors
- Martinez-Ara, M., Comoglio, F., van Arensbergen, J., & van Steensel, B.
- Affiliations
- The Netherlands Cancer Institute (NL)
- Corresponding author
- van Steensel, Bas
- Venue
- Molecular Cell
- Publisher
- Elsevier BV
- Published
- 2022-07
- Volume
- 82
- Issue
- 13
- Pages
- 2519-2531.e6
- ISSN
- 1097-2765 (ISSN-L)
- PMC
- PMC9278412
- OpenAlex
- W4225797159
- Cited by
- 101
- References
- 75
- Citations by year
- 2026: 15 · 2025: 23 · 2024: 24 · 2023: 27 · 2022: 12
- FWCI
- 7.02
- Type
- journal article
- Language
- en
- Open access
- hybrid
- doi.org
- Licence
- Locations
- Molecular Cell (publishedVersion, cc-by-nc-nd)
- bioRxiv (Cold Spring Harbor Laboratory) (acceptedVersion, cc-by-nc-nd)
- PubMed Central (publishedVersion, cc-by-nc-nd)
- PubMed (publishedVersion)
- Funders
- National Science Foundation
- Schweizerischer Nationalfonds zur Förderung der Wissenschaftlichen Forschung (165206)
- KWF Kankerbestrijding
- Topics
- Life Sciences › Biochemistry, Genetics and Molecular Biology › Molecular Biology › Genomics and Chromatin Dynamics
- Life Sciences › Biochemistry, Genetics and Molecular Biology › Molecular Biology › Chromatin Remodeling and Cancer
- Life Sciences › Biochemistry, Genetics and Molecular Biology › Molecular Biology › Gene Regulatory Network Analysis
- Keywords
- cis-regulatory elements, enhancers, promoter selectivity, transcription factor binding motifs, chromatin looping, chromatin folding, gene expression regulation, mouse genome
- MeSH terms
- Animals, Enhancer Elements, Genetic, Gene Expression Regulation, Mammals, Promoter Regions, Genetic, Regulatory Sequences, Nucleic Acid, Transcription Factors, Genome, Genomics, Mice
About these checks
Registry, retraction, Cites and statistics results are computed, not judged, with one exception: a printed reference that no index lists is read once by a model before it counts as a citation error. Claims are extracted by a model and kept only when their quote appears verbatim in the text; each cited source is then checked, with a model’s help, for whether it says what the claim relies on. Those verdicts can be wrong — read the claim’s quote and the cited source before relying on one.
Statistics and arithmetic are recomputed, not judged.
Confidence bands are shown only for fields calibrated on our annotated test set. None is calibrated yet, so no band is shown.
What counts as a claim ›How we measure confidence ›How we check this ›
Are you an author, or do you see a problem with this page? Request a review
