

The DOI matches its Crossref record; 42 of the 42 references it cites were found in a registry or an index.
Dietary sugars, not lipids, drive hypothalamic inflammation
Open accessAbstract
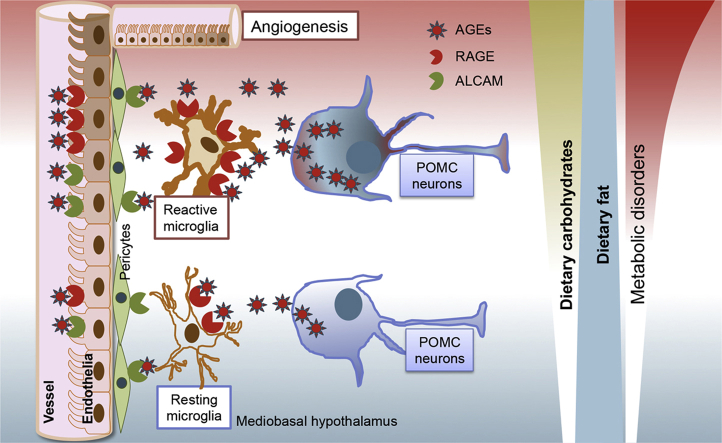
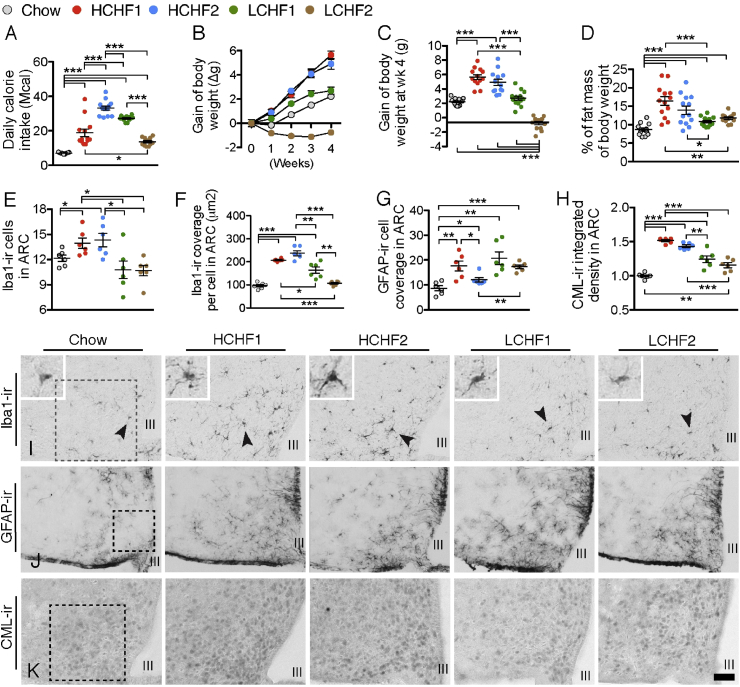
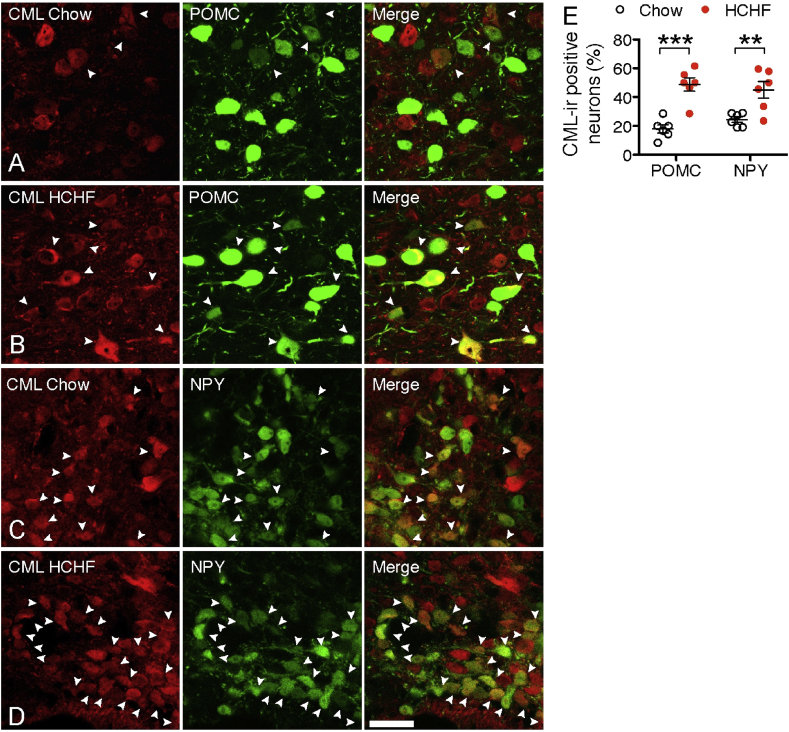
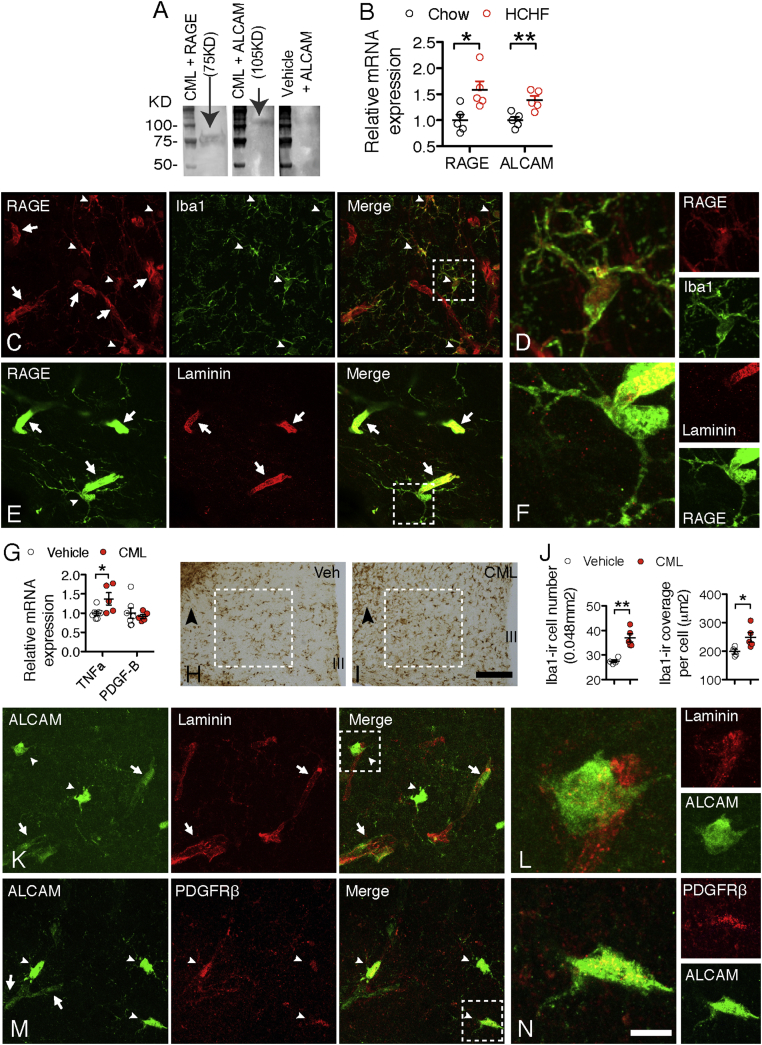
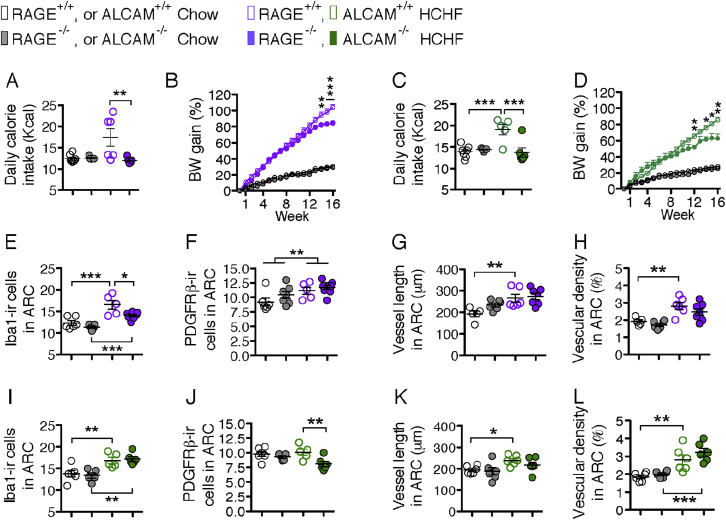
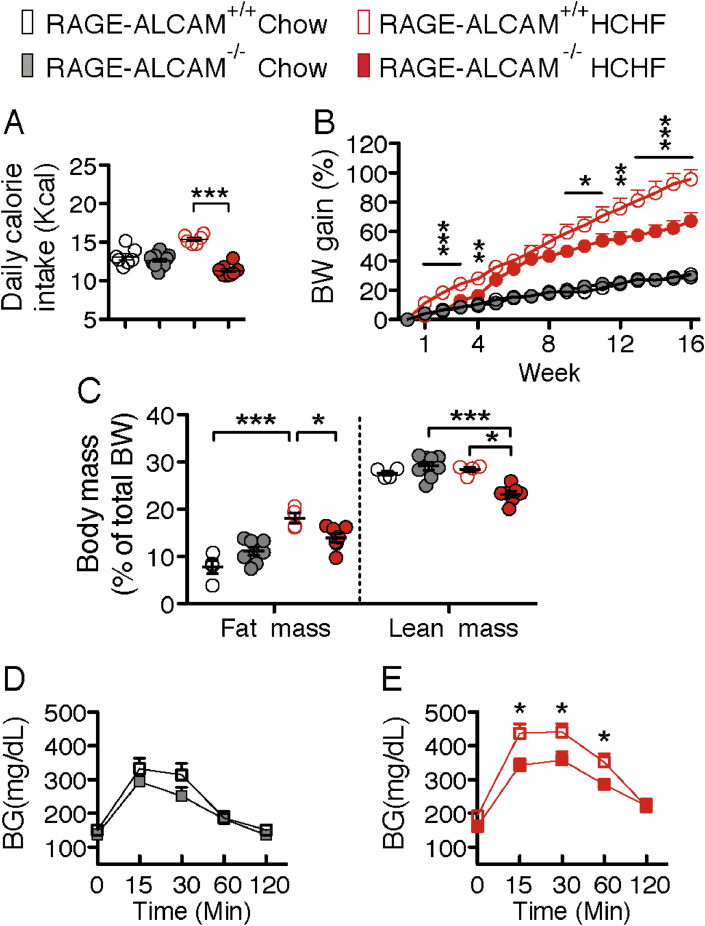
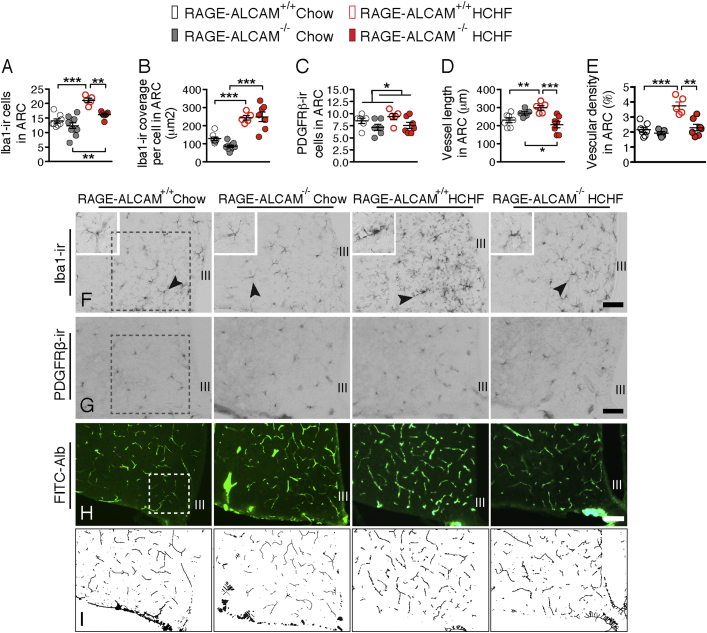
OBJECTIVE: The hypothalamus of hypercaloric diet-induced obese animals is featured by a significant increase of microglial reactivity and its associated cytokine production. However, the role of dietary components, in particular fat and carbohydrate, with respect to the hypothalamic inflammatory response and the consequent impact on hypothalamic control of energy homeostasis is yet not clear. METHODS: We dissected the different effects of high-carbohydrate high-fat (HCHF) diets and low-carbohydrate high-fat (LCHF) diets on hypothalamic inflammatory responses in neurons and non-neuronal cells and tested the hypothesis that HCHF diets induce hypothalamic inflammation via advanced glycation end-products (AGEs) using mice lacking advanced glycation end-products (AGEs) receptor (RAGE) and/or the activated leukocyte cell-adhesion molecule (ALCAM). RESULTS: We found that consumption of HCHF diets, but not of LCHF diets, increases microgliosis as well as the presence of N(ε)-(Carboxymethyl)-Lysine (CML), a major AGE, in POMC and NPY neurons of the arcuate nucleus. Neuron-secreted CML binds to both RAGE and ALCAM, which are expressed on endothelial cells, microglia, and pericytes. On a HCHF diet, mice lacking the RAGE and ALCAM genes displayed less microglial reactivity and less neovasculature formation in the hypothalamic ARC, and this was associated with significant improvements of metabolic disorders induced by the HCHF diet. CONCLUSIONS: , leads to excessive CML production in hypothalamic neurons, which, in turn, stimulates hypothalamic inflammatory responses such as microgliosis and eventually leads to neuronal dysfunction in the control of energy metabolism.
Overview
The claims and statistics of this paper haven’t been checked yet.
Run the check — free, no account needed. It reads the open-access text and checks the sources it cites.
Integrity signals
Registry
Cites
Statistics
Figures
Verification
Claims the paper makes
The claims and statistics of this paper haven’t been checked yet.
Run the check — free, no account needed. It reads the open-access text and checks the sources it cites.
Claims other papers make about this one
Each is checked against this paper’s own text: does it say what the citing paper says it does?
In the citing paper
“The presence of excess sugar in a HFD was shown to be necessary for hypothalamic inflammatory responses in mice, including the activation of microglia, the resident immune cells of the brain [58].”
From The menace of obesity to depression and anxiety prevalence (2022) · cites this paper as [58]
In the citing paper
“Advanced glycation end products (AGEs) are a complex and heterogeneous group of protein, lipid, and DNA adducts implicated in the development of numerous chronic diseases including diabetes related complications, cardiovascular, renal, and neurodegenerative disease, and have recently also been implicated in hypothalamic inflammation and obesity.[1]”
From The Role of Dietary Advanced Glycation End Products in Metabolic Dysfunction (2021) · cites this paper as [1]
In the citing paper
“AGEs are produced both naturally in the body, as part of normal metabolism, and during the cooking and processing of food with a significant proportion being absorbed in the gastrointestinal tract.”
From The Role of Dietary Advanced Glycation End Products in Metabolic Dysfunction (2021) · cites this paper as [1]
In the citing paper
“In mice, where AGEs were identified as being the mechanism by which a high-fat diet causes hypothalamic inflammation, knockdown of both RAGE and AL-CAM was required to block the proinflammatory effects of CML.[1]”
From The Role of Dietary Advanced Glycation End Products in Metabolic Dysfunction (2021) · cites this paper as [1]
In the citing paper
“In support of this, a diet high in both lipids and carbohydrates is required to induce a significant increase in hypothalamic inflammation in rodents associated with an increase in body weight.[1,150]”
From The Role of Dietary Advanced Glycation End Products in Metabolic Dysfunction (2021) · cites this paper as [1]
In the citing paper
“The high-fat and high-carbohydrate diet also caused an increase in CML immunoreactivity in both POMC and NPY neurons.”
From The Role of Dietary Advanced Glycation End Products in Metabolic Dysfunction (2021) · cites this paper as [1]
In the citing paper
“The role of AGEs in promoting hypothalamic inflammation was confirmed in animals lacking RAGE and ALCAM which have an improved metabolic phenotype and decreased microglial reactivity on a high-fat diet.[1]”
From The Role of Dietary Advanced Glycation End Products in Metabolic Dysfunction (2021) · cites this paper as [1]
Self-check
Percentages, sums and reported differences re-computed from the paper’s own numbers.
The self-check needs the paper’s full text.
Citations
Cites
Zhang, Y., Chen, K., Sloan, S. A., Bennett, M. L., Scholze, A. R., O'Keeffe, S., Phatnani, H. P., Guarnieri, P., Caneda, C., Ruderisch, N., et al. (2014) · The Journal of Neuroscience · doi:10.1523/jneurosci.1860-14.2014 · Cited by 4,875
Advanced glycation end-products: A review
Singh, R., Barden, A., Mori, T., & Beilin, L. (2001) · Diabetologia · doi:10.1007/s001250051591 · Cited by 2,597
Weight Loss with a Low-Carbohydrate, Mediterranean, or Low-Fat Diet
Shai, I., Schwarzfuchs, D., Henkin, Y., Shahar, D. R., Witkow, S., Greenberg, I., Golan, R., Fraser, D., Bolotin, A., Vardi, H., et al. (2008) · New England Journal of Medicine · doi:10.1056/nejmoa0708681 · Cited by 2,143
Obesity is associated with hypothalamic injury in rodents and humans.
Thaler, J. P., Yi, C.-X., Schur, E. A., Guyenet, S. J., Hwang, B. H., Dietrich, M. O., Zhao, X., Sarruf, D. A., Izgur, V., Maravilla, K. R., et al. (2012) · Journal of Clinical Investigation · doi:10.1172/jci59660 · Cited by 1,857
De Souza, C. T., Araujo, E. P., Bordin, S., Ashimine, R., Zollner, R. L., Boschero, A. C., Saad, M. J. A., & Velloso, L. A. (2005) · Endocrinology · doi:10.1210/en.2004-1520 · Cited by 1,171
Milanski, M., Degasperi, G., Coope, A., Morari, J., Denis, R., Cintra, D. E., Tsukumo, D. M. L., Anhe, G., Amaral, M. E., Takahashi, H. K., et al. (2009) · The Journal of Neuroscience · doi:10.1523/jneurosci.2760-08.2009 · Cited by 1,125
Dhingra, R., Sullivan, L., Jacques, P. F., Wang, T. J., Fox, C. S., Meigs, J. B., D’Agostino, R. B., Gaziano, J. M., & Vasan, R. S. (2007) · Circulation · doi:10.1161/circulationaha.107.689935 · Cited by 918
Fu, M.-X., Requena, J. R., Jenkins, A. J., Lyons, T. J., Baynes, J. W., & Thorpe, S. R. (1996) · Journal of Biological Chemistry · doi:10.1074/jbc.271.17.9982 · Cited by 822
Sugar consumption, metabolic disease and obesity: The state of the controversy
Stanhope, K. L. (2016) · Critical Reviews in Clinical Laboratory Sciences · doi:10.3109/10408363.2015.1084990 · Cited by 739
Huttunen, H. J., Fages, C., & Rauvala, H. (1999) · Journal of Biological Chemistry · doi:10.1074/jbc.274.28.19919 · Cited by 634
Cited by
Sorted by citations
The menace of obesity to depression and anxiety prevalence
Fulton, S., Décarie-Spain, L., Fioramonti, X., Guiard, B., & Nakajima, S. (2022) · Trends in Endocrinology & Metabolism · doi:10.1016/j.tem.2021.10.005 · Cited by 441
“The presence of excess sugar in a HFD was shown to be necessary for hypothalamic inflammatory responses in mice, including the activation of microglia, the resident immune cells of the brain [58].”
BackgroundRole of astrocytes, microglia, and tanycytes in brain control of systemic metabolism
García‐Cáceres, C., Balland, É., Prévot, V., Luquet, S. H., Woods, S. C., Koch, M., Horváth, T. L., Yi, C., Chowen, J. A., Verkhratsky, A., et al. (2018) · Nature Neuroscience · doi:10.1038/s41593-018-0286-y · Cited by 343
Role of c-Jun N-terminal Kinase (JNK) in Obesity and Type 2 Diabetes
Yung, J. H. M., & Giacca, A. (2020) · Cells · doi:10.3390/cells9030706 · Cited by 284
Inflammageing and metaflammation: The yin and yang of type 2 diabetes
Prattichizzo, F., Nigris, V. D., Spiga, R., Mancuso, E., Sala, L. L., Antonicelli, R., Testa, R., Procopio, A. D., Olivieri, F., & Ceriello, A. (2017) · Ageing Research Reviews · doi:10.1016/j.arr.2017.10.003 · Cited by 255
The Role of Dietary Advanced Glycation End Products in Metabolic Dysfunction
Sergi, D., Boulestin, H., Campbell, F. M., & Williams, L. M. (2021) · Molecular Nutrition & Food Research · doi:10.1002/mnfr.201900934 · Cited by 194
Metadata
- Authors
- Gao, Y., Bielohuby, M., Fleming, T., Grabner, G. F., Foppen, E., Bernhard, W., Guzmán-Ruiz, M., Layritz, C., Legutko, B., Zinser, E., García-Cáceres, C., Buijs, R. M., Woods, S. C., Kalsbeek, A., Seeley, R. J., Nawroth, P. P., Bidlingmaier, M., Tschöp, M. H., & Yi, C.-X.
- Affiliations
- Amsterdam UMC Location University of Amsterdam (NL)
- LMU Klinikum (DE)
- University Hospital Heidelberg (DE)
- University of Graz (AT)
- Helmholtz Munich (DE)
- FH JOANNEUM University of Applied Sciences (AT)
- Universidad Nacional Autónoma de México (MX)
- University of Cincinnati (US)
- Netherlands Institute for Neuroscience (NL)
- University of Michigan (US)
- Corresponding author
- Bidlingmaier, Martin
- Tschöp, Matthias H.
- Yi, Chun-Xia
- ORCID
- Venue
- Molecular Metabolism
- Publisher
- Elsevier BV
- Published
- 2017-08
- Volume
- 6
- Issue
- 8
- Pages
- 897-908
- ISSN
- 2212-8778 (ISSN-L)
- PMC
- PMC5518723
- OpenAlex
- W2652575518
- Cited by
- 131
- References
- 41
- Citations by year
- 2026: 6 · 2025: 10 · 2024: 12 · 2023: 15 · 2022: 18 · 2021: 23 · 2020: 13 · 2019: 22 · 2018: 9 · 2017: 2
- FWCI
- 6.27
- Type
- journal article
- Language
- en
- Open access
- gold
- doi.org
- Licence
- Locations
- Molecular Metabolism (publishedVersion, cc-by-nc-nd)
- PubMed Central (publishedVersion, cc-by-nc-nd)
- PubMed (publishedVersion)
- Pure Amsterdam UMC (publishedVersion, other-oa)
- KNAW Research Portal (The Royal Netherlands Academy of Arts and Sciences) (publishedVersion, other-oa)
- FH JOANNEUM ePUB (submittedVersion, cc-by-nc-nd)
- PuSH - Publication Server of Helmholtz Zentrum München (submittedVersion, cc-by-nc-nd)
- Data Archiving and Networked Services (DANS) (submittedVersion)
- Data Archiving and Networked Services (DANS) (submittedVersion, other-oa)
- DOAJ (DOAJ: Directory of Open Access Journals) (submittedVersion)
- Open access LMU (Ludwid Maxmilian's Universitat Munchen) (submittedVersion, cc-by-nc-nd)
- mediaTUM (Technical University of Munich) (submittedVersion)
- Site cant be reached (submittedVersion, cc-by-nc-nd)
- Funders
- Daiichi-Sankyo
- Alexander von Humboldt-Stiftung
- Deutsche Forschungsgemeinschaft (SFB1123, ANR- 15-CE14-0030, SFB1118)
- U.S. Department of Homeland Security
- Novartis
- Novo Nordisk
- Academisch Medisch Centrum
- Helmholtz Association
- European Research Council (695054)
- Topics
- Life Sciences › Neuroscience › Neurology › Neuroinflammation and Neurodegeneration Mechanisms
- Life Sciences › Neuroscience › Endocrine and Autonomic Systems › Regulation of Appetite and Obesity
- Health Sciences › Medicine › Endocrinology, Diabetes and Metabolism › Adipokines, Inflammation, and Metabolic Diseases
- Keywords
- hypothalamic inflammation, dietary sugar, high-fat high-carbohydrate diet, advanced glycation end products, carboxymethyllysine, microglial activation, RAGE, ALCAM, arcuate nucleus, POMC neurons, NPY neurons, neovasculature, energy homeostasis, obesity, hypercaloric diet, endothelial cells, pericytes
- MeSH terms
- Receptor for Advanced Glycation End Products, Dietary Sugars, Animals, Dietary Fats, Gliosis, Hypothalamus, Inflammation, Male, Mice, Inbred C57BL, Glycation End Products, Advanced, Activated-Leukocyte Cell Adhesion Molecule, Mice, Rats
About these checks
Registry, retraction, Cites and statistics results are computed, not judged, with one exception: a printed reference that no index lists is read once by a model before it counts as a citation error. Claims are extracted by a model and kept only when their quote appears verbatim in the text; each cited source is then checked, with a model’s help, for whether it says what the claim relies on. Those verdicts can be wrong — read the claim’s quote and the cited source before relying on one.
Statistics and arithmetic are recomputed, not judged.
Confidence bands are shown only for fields calibrated on our annotated test set. None is calibrated yet, so no band is shown.
What counts as a claim ›How we measure confidence ›How we check this ›
Are you an author, or do you see a problem with this page? Request a review
