

The DOI matches its Crossref record; 78 of the 79 references it cites were found in a registry or an index.
The impact of exercise on mitochondrial dynamics and the role of Drp1 in exercise performance and training adaptations in skeletal muscle
Open accessAbstract
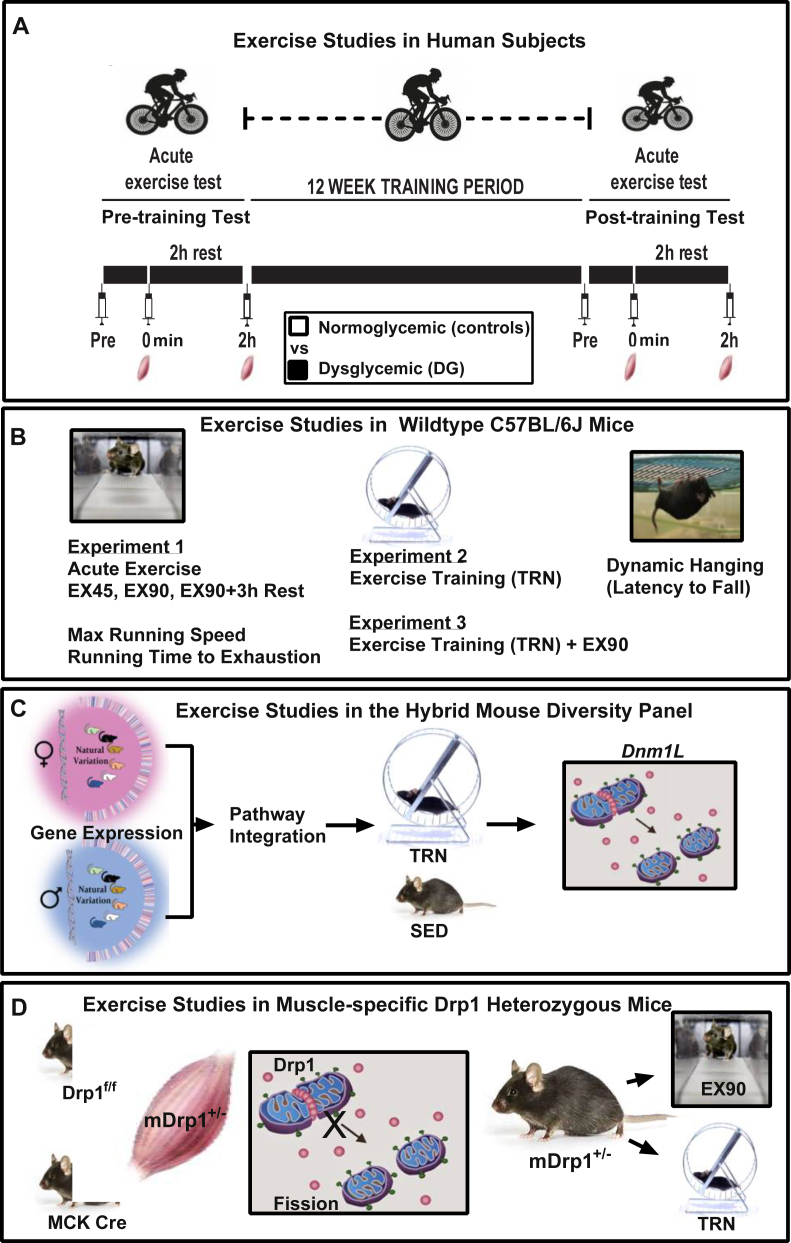
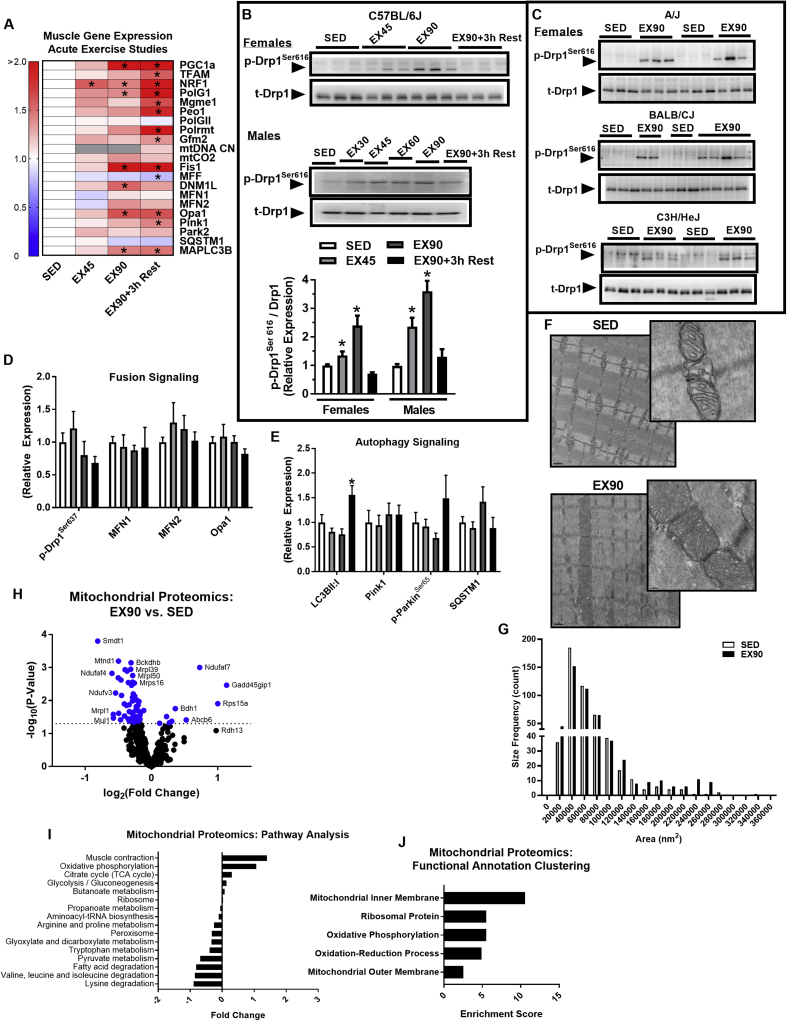
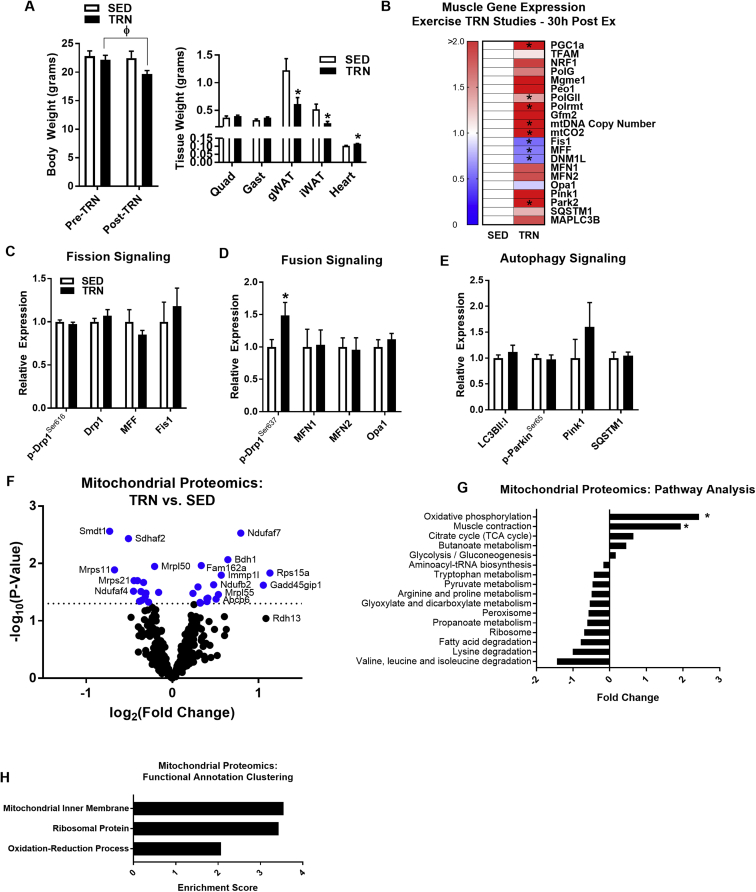
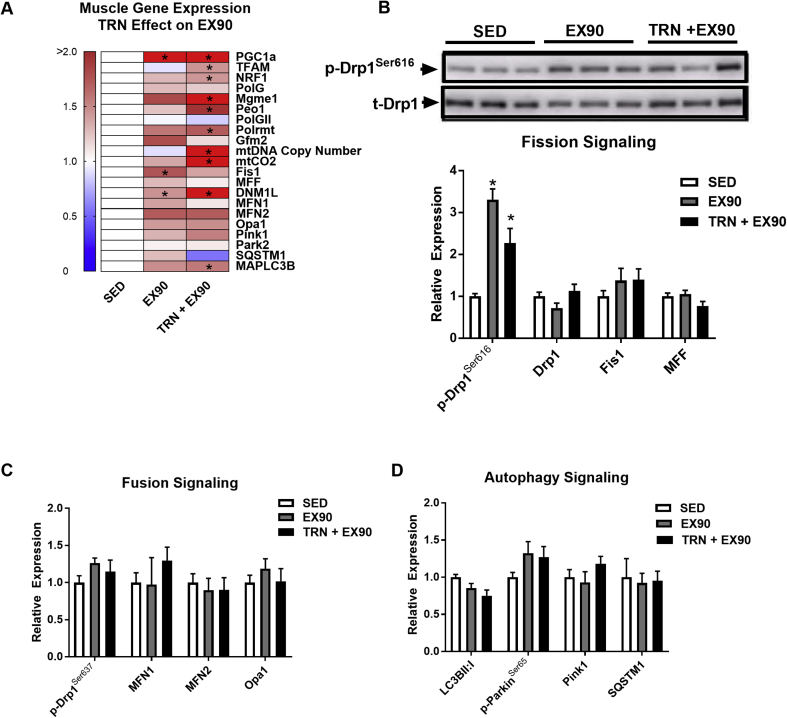
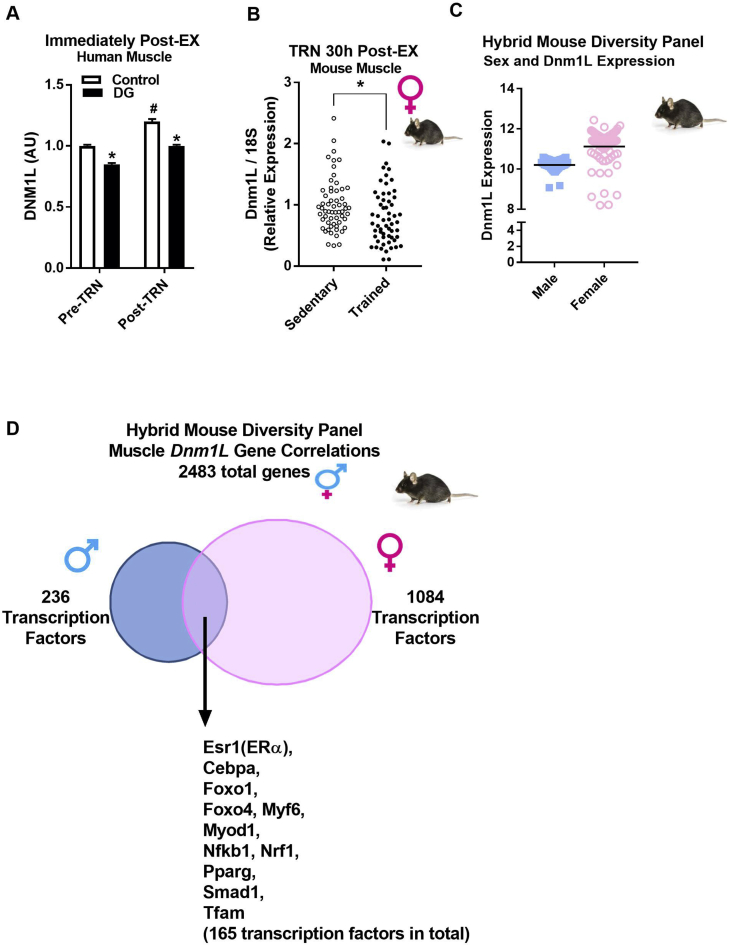
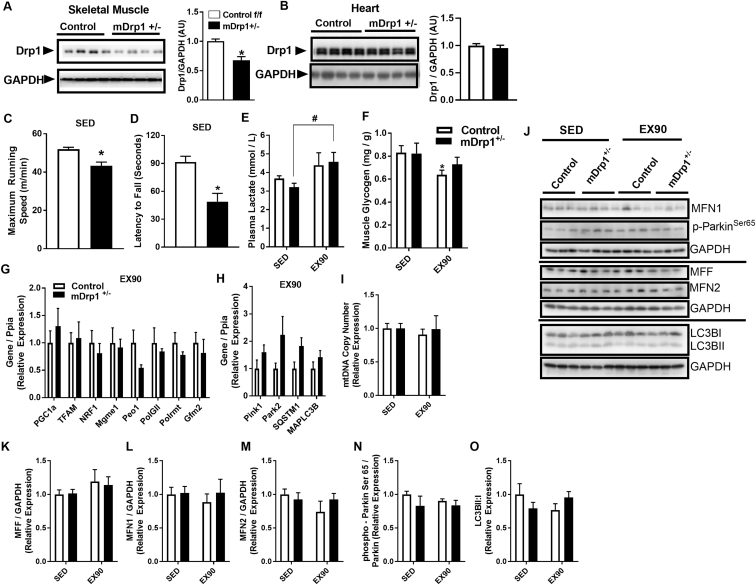
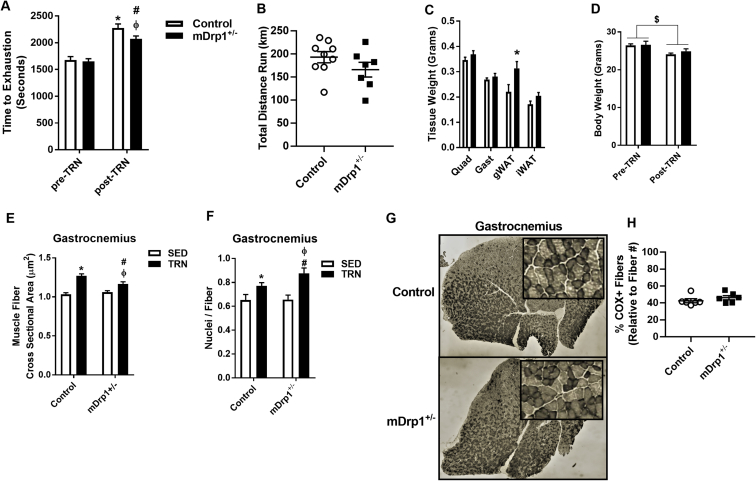
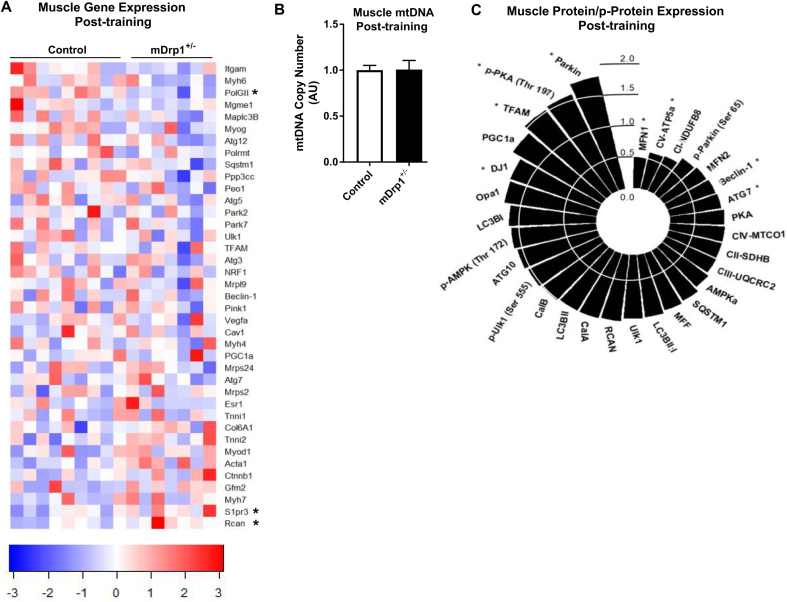
Objective Mitochondria are organelles primarily responsible for energy production, and recent evidence indicates that alterations in size, shape, location, and quantity occur in response to fluctuations in energy supply and demand. We tested the impact of acute and chronic exercise on mitochondrial dynamics signaling and determined the impact of the mitochondrial fission regulator Dynamin related protein (Drp)1 on exercise performance and muscle adaptations to training. Methods Wildtype and muscle-specific Drp1 heterozygote (mDrp1 +/− ) mice, as well as dysglycemic (DG) and healthy normoglycemic men (control) performed acute and chronic exercise. The Hybrid Mouse Diversity Panel, including 100 murine strains of recombinant inbred mice , was used to identify muscle Dnm1L (encodes Drp1)-gene relationships. Results Endurance exercise impacted all aspects of the mitochondrial life cycle , i.e. fission-fusion, biogenesis, and mitophagy . Dnm1L gene expression and Drp1 Ser616 phosphorylation were markedly increased by acute exercise and declined to baseline during post-exercise recovery. Dnm1L expression was strongly associated with transcripts known to regulate mitochondrial metabolism and adaptations to exercise. Exercise increased the expression of DNM1L in skeletal muscle of healthy control and DG subjects, despite a 15% ↓( P = 0.01) in muscle DNM1L expression in DG at baseline. To interrogate the role of Dnm1L further, we exercise trained male mDrp1 +/− mice and found that Drp1 deficiency reduced muscle endurance and running performance, and altered muscle adaptations in response to exercise training. Conclusion Our findings highlight the importance of mitochondrial dynamics, specifically Drp1 signaling, in the regulation of exercise performance and adaptations to endurance exercise training.
Overview
The claims and statistics of this paper haven’t been checked yet.
Run the check — free, no account needed. It reads the open-access text and checks the sources it cites.
Integrity signals
Registry
Cites
Statistics
Figures
Verification
Claims the paper makes
The claims and statistics of this paper haven’t been checked yet.
Run the check — free, no account needed. It reads the open-access text and checks the sources it cites.
Claims other papers make about this one
Each is checked against this paper’s own text: does it say what the citing paper says it does?
In the citing paper
“There is strong evidence in skeletal muscle that supports a causal link between the dysregulation of mitochondrial fission and alterations in muscle maintenance [152, 196, 197, 210, 211].”
From The connection between the dynamic remodeling of the mitochondrial network and the regulation of muscle mass (2021) · cites this paper as [211]
In the citing paper
“Another study using muscle-specific DRP1 heterozygote mice showed reduced muscle endurance and running performance, and altered muscle adaptations in response to exercise training [211].”
From The connection between the dynamic remodeling of the mitochondrial network and the regulation of muscle mass (2021) · cites this paper as [211]
Self-check
Percentages, sums and reported differences re-computed from the paper’s own numbers.
The self-check needs the paper’s full text.
Citations
Cites
Sequence and organization of the human mitochondrial genome
Anderson, S., Bankier, A. T., Barrell, B. G., de Bruijn, M. H. L., Coulson, A. R., Drouin, J., Eperon, I. C., Nierlich, D. P., Roe, B. A., Sanger, F., et al. (1981) · Nature · doi:10.1038/290457a0 · Cited by 9,740
Rappsilber, J., Mann, M., & Ishihama, Y. (2007) · Nature Protocols · doi:10.1038/nprot.2007.261 · Cited by 4,641
Parkin is recruited selectively to impaired mitochondria and promotes their autophagy
Narendra, D., Tanaka, A., Suen, D.-F., & Youle, R. J. (2008) · The Journal of Cell Biology · doi:10.1083/jcb.200809125 · Cited by 4,026
Fission and selective fusion govern mitochondrial segregation and elimination by autophagy
Twig, G., Elorza, A., Molina, A. J. A., Mohamed, H., Wikstrom, J. D., Walzer, G., Stiles, L., Haigh, S. E., Katz, S., Las, G., et al. (2008) · The EMBO Journal · doi:10.1038/sj.emboj.7601963 · Cited by 3,082
Self-citationA colorimetric method for the determination of sugars
DUBOIS, M., GILLES, K., HAMILTON, J. K., REBERS, P. A., & SMITH, F. (1951) · Nature · doi:10.1038/168167a0 · Cited by 2,504
Mitochondrial fusion and fission in cell life and death
Westermann, B. (2010) · Nature Reviews Molecular Cell Biology · doi:10.1038/nrm3013 · Cited by 2,002
Dynamin-related Protein Drp1 Is Required for Mitochondrial Division in Mammalian Cells
Smirnova, E., Griparić, L., Shurland, D., & van der Bliek, A. M. (2001) · Molecular Biology of the Cell · doi:10.1091/mbc.12.8.2245 · Cited by 1,938
The pathways of mitophagy for quality control and clearance of mitochondria
Ashrafi, G., & Schwarz, T. L. (2013) · Cell Death & Differentiation · doi:10.1038/cdd.2012.81 · Cited by 1,900
The mitochondrial genome: structure, transcription, translation and replication
Taanman, J.-W. (1999) · Biochimica et Biophysica Acta (BBA) - Bioenergetics · doi:10.1016/s0005-2728(98)00161-3 · Cited by 1,635
Sequence and gene organization of mouse mitochondrial DNA.
Bibb, M., Etten, R. V., Wright, C. T., Walberg, M. W., & Clayton, D. A. (1981) · Cell · doi:10.1016/0092-8674(81)90300-7 · Cited by 1,619
Cited by
Sorted by citations
The mitophagy pathway and its implications in human diseases
Wang, S., Long, H., Hou, L., Feng, B., Ma, Z., Wu, Y., Zeng, Y., Cai, J., Zhang, D., & Zhao, G. (2023) · Signal Transduction and Targeted Therapy · doi:10.1038/s41392-023-01503-7 · Cited by 991
Liu, Y. J., McIntyre, R. L., Janssens, G. E., & Houtkooper, R. H. (2020) · Mechanisms of Ageing and Development · doi:10.1016/j.mad.2020.111212 · Cited by 347
The role of mitochondrial fission in cardiovascular health and disease
Quiles, J. M., & Gustafsson, Å. B. (2022) · Nature Reviews Cardiology · doi:10.1038/s41569-022-00703-y · Cited by 315
Romanello, V., & Sandri, M. (2021) · Cellular and Molecular Life Sciences · doi:10.1007/s00018-020-03662-0 · Cited by 197
Dysregulated Mitochondrial Dynamics and Metabolism in Obesity, Diabetes, and Cancer
Dai, W., & Jiang, L. (2019) · Frontiers in Endocrinology · doi:10.3389/fendo.2019.00570 · Cited by 186
The protective role of exercise against age-related neurodegeneration
Sujkowski, A. L., Hong, L., Wessells, R. J., & Todi, S. V. (2021) · Ageing Research Reviews · doi:10.1016/j.arr.2021.101543 · Cited by 142
Mitochondrial dysfunction and skeletal muscle atrophy: Causes, mechanisms, and treatment strategies
Kubat, G. B., Bouhamida, E., Ülger, Ö., Türkel, İ., Pedriali, G., Ramaccini, D., Ekinci, Ö., Özerkliğ, B., Atalay, Ö., Patergnani, S., et al. (2023) · Mitochondrion · doi:10.1016/j.mito.2023.07.003 · Cited by 134
Astaxanthin as a Novel Mitochondrial Regulator: A New Aspect of Carotenoids, beyond Antioxidants
Nishida, Y., Nawaz, A., Hecht, K. A., & Tobe, K. (2021) · Nutrients · doi:10.3390/nu14010107 · Cited by 128
OPA1 regulation of mitochondrial dynamics in skeletal and cardiac muscle
Noone, J., O’Gorman, D. J., & Kenny, H. (2022) · Trends in Endocrinology and Metabolism · doi:10.1016/j.tem.2022.07.003 · Cited by 120
Exercise preserves physical fitness during aging through AMPK and mitochondrial dynamics
Campos, J. C., Bozi, L. H. M., Krum, B. N., Bechara, L. R. G., Ferreira, N. D., Arini, G. S., Albuquerque, R. P. E., Traa, A., Ogawa, T., van der Bliek, A. M., et al. (2023) · Proceedings of the National Academy of Sciences · doi:10.1073/pnas.2204750120 · Cited by 121
Mitochondrial Dysfunction Is an Early Consequence of Partial or Complete Dystrophin Loss in mdx Mice
Moore, T. M., Lin, A. J., Strumwasser, A. R., Cory, K., Whitney, K. A., Ho, T., Ho, T., Lee, J. L., Rucker, D. H., Nguyen, C. Q., et al. (2020) · Frontiers in Physiology · doi:10.3389/fphys.2020.00690 · Cited by 105
Self-citationThe social nature of mitochondria: Implications for human health
Picard, M. A., & Sandi, C. (2020) · Neuroscience & Biobehavioral Reviews · doi:10.1016/j.neubiorev.2020.04.017 · Cited by 107
Interactions between insulin and exercise
Richter, E. A., Sylow, L., & Hargreaves, M. (2021) · Biochemical Journal · doi:10.1042/bcj20210185 · Cited by 99
Huertas, J. R., Casuso, R. A., Hernansanz‐Agustín, P., & Cogliati, S. (2019) · Oxidative Medicine and Cellular Longevity · doi:10.1155/2019/7058350 · Cited by 106
Dulac, M., Leduc‐Gaudet, J., Reynaud, O., Ayoub, M., Guérin, A., Finkelchtein, M., Hussain, S. N., & Gouspillou, G. (2020) · The Journal of Physiology · doi:10.1113/jp279802 · Cited by 90
The mitochondrial multi-omic response to exercise training across rat tissues
Amar, D., Gay, N. R., Jimenez‐Morales, D., Beltran, P. M. J., Ramaker, M. E., Raja, A. N., Zhao, B., Sun, Y., Marwaha, S., Gaul, D. A., et al. (2024) · Cell Metabolism · doi:10.1016/j.cmet.2023.12.021 · Cited by 89
Self-citationExercise-Induced Mitophagy in Skeletal Muscle and Heart
Guan, Y., Drake, J. C., & Yan, Z. (2019) · Exercise and Sport Sciences Reviews · doi:10.1249/jes.0000000000000192 · Cited by 81
Yan, X., Shen, Z.-L., Yu, D., Zhao, C., Zou, H., Ma, B., Dong, W.-X., Chen, W., Huang, D., & Yu, Z. (2021) · Free Radical Biology and Medicine · doi:10.1016/j.freeradbiomed.2021.11.030 · Cited by 60
Lavin, K. M., Coen, P. M., Baptista, L. C. P., Bell, M. B., Drummer, D. J., Harper, S. A., Lixandrão, M. E., McAdam, J. S., O’Bryan, S. M., Ramos, S. V., et al. (2022) · Comprehensive physiology · doi:10.1002/cphy.c200033 · Cited by 78
The influence of aerobic exercise on mitochondrial quality control in skeletal muscle
Philp, A. M., Saner, N. J., Lazarou, M., Ganley, I. G., & Philp, A. (2020) · The Journal of Physiology · doi:10.1113/jp279411 · Cited by 62
Mitochondrial Bioenergetics and Turnover during Chronic Muscle Disuse
Memme, J. M., Slavin, M. B., Moradi, N., & Hood, D. A. (2021) · International Journal of Molecular Sciences · doi:10.3390/ijms22105179 · Cited by 59
Current advances in our understanding of exercise as medicine in metabolic disease
Sylow, L., & Richter, E. A. (2019) · Current Opinion in Physiology · doi:10.1016/j.cophys.2019.04.008 · Cited by 54
The Role of Mitophagy in Skeletal Muscle Damage and Regeneration
Chatzinikita, E., Maridaki, M. D., Palikaras, K., Koutsilieris, M., & Philippou, Α. (2023) · Cells · doi:10.3390/cells12050716 · Cited by 63
The emerging role of skeletal muscle mitochondrial dynamics in exercise and ageing
Casuso, R. A., & Huertas, J. R. (2020) · Ageing Research Reviews · doi:10.1016/j.arr.2020.101025 · Cited by 56
Regulation of muscle and mitochondrial health by the mitochondrial fission protein Drp1 in aged mice
Dulac, M., Leduc‐Gaudet, J., Cefis, M., Ayoub, M., Reynaud, O., Shams, A., Moamer, A., Nery Ferreira, M. F., Hussain, S. N., & Gouspillou, G. (2021) · The Journal of Physiology · doi:10.1113/jp281752 · Cited by 51
Hou, Y., Tang, Y., Wang, X., Ai, X., Wang, H., Li, X., Chen, X., Zhang, Y., Hu, Y., Meng, X., et al. (2020) · Experimental and Therapeutic Medicine · doi:10.3892/etm.2020.9072 · Cited by 49
Mitochondrial bioenergetics and redox dysfunctions in hypercholesterolemia and atherosclerosis
Oliveira, H. C. F., & Vercesi, A. E. (2019) · Molecular Aspects of Medicine · doi:10.1016/j.mam.2019.100840 · Cited by 49
Implications of mitochondrial fusion and fission in skeletal muscle mass and health
Romanello, V., & Sandri, M. (2022) · Seminars in Cell and Developmental Biology · doi:10.1016/j.semcdb.2022.02.011 · Cited by 46
Schader, J. F., Haid, M., Cecil, A., Schoenfeld, J., Halle, M., Pfeufer, A., Prehn, C. P., Adamski, J., Nieman, D. C., & Scherr, J. (2020) · Metabolites · doi:10.3390/metabo10030087 · Cited by 44
Molecular Mechanisms of Exercise and Healthspan
Guan, Y., & Yan, Z. (2022) · Cells · doi:10.3390/cells11050872 · Cited by 48
Chan, W. S., Ng, C. F., Pang, B. P. S., Hang, M., Tse, M. C. L., Iu, E. C. Y., Ooi, X. C., Yang, X., Kim, J. K., Lee, C. W., et al. (2024) · Science Signaling · doi:10.1126/scisignal.adh2783 · Cited by 47
Regulatory networks coordinating mitochondrial quality control in skeletal muscle
Slavin, M. B., Memme, J. M., Oliveira, A. N., Moradi, N., & Hood, D. A. (2022) · American Journal of Physiology-Cell Physiology · doi:10.1152/ajpcell.00065.2022 · Cited by 45
Boulghobra, D., Coste, F., Gény, B., & Reboul, C. (2020) · Free Radical Biology and Medicine · doi:10.1016/j.freeradbiomed.2020.04.005 · Cited by 42
Modeling the Effects of Calcium Overload on Mitochondrial Ultrastructural Remodeling
Strubbe, J. O., Chen, J., West, B. A., Parent, K. N., Wei, G., & Bazil, J. N. (2021) · Applied Sciences · doi:10.3390/app11052071 · Cited by 38
ERα in the Control of Mitochondrial Function and Metabolic Health
Hevener, A. L., Ribas, V., Moore, T. M., & Zhou, Z. (2020) · Trends in Molecular Medicine · doi:10.1016/j.molmed.2020.09.006 · Cited by 37
Self-citationMolecular Mechanisms Underlying Muscle Wasting in Huntington’s Disease
Bozzi, M., & Sciandra, F. (2020) · International Journal of Molecular Sciences · doi:10.3390/ijms21218314 · Cited by 38
Exercise: a molecular tool to boost muscle growth and mitochondrial performance in heart failure?
Nijholt, K. T., Sánchez-Aguilera, P., Voorrips, S. N., de Boer, R. A., & Westenbrink, B. D. (2021) · European Journal of Heart Failure · doi:10.1002/ejhf.2407 · Cited by 41
Mitophagy: A potential therapeutic target for insulin resistance
Ning, P., Jiang, X., Yang, J., Zhang, J., Yang, F., & Cao, H. (2022) · Frontiers in Physiology · doi:10.3389/fphys.2022.957968 · Cited by 35
Advances in exercise to alleviate sarcopenia in older adults by improving mitochondrial dysfunction
Zhu, Y., Zhou, X., Zhu, A., Xiong, S., Xie, J., & Bai, Z. (2023) · Frontiers in Physiology · doi:10.3389/fphys.2023.1196426 · Cited by 34
Yang, X., Deng, F., Wu, Z., Chen, S., Shi, Y., Jia, X., Hu, S., Wang, J., Cao, W., & Lai, S. (2020) · Animals · doi:10.3390/ani10061068 · Cited by 32
Espinosa, A., Casas, M., & Jaimovich, E. (2023) · Antioxidants · doi:10.3390/antiox12081624 · Cited by 41
Voltarelli, V. A., Coronado, M. J., Fernandes, L. G., Campos, J. C., Jannig, P. R., Ferreira, J. C. B., Fajardo, G., Brum, P. C., & Bernstein, D. (2021) · Cells · doi:10.3390/cells10010146 · Cited by 34
Yin, L., Qi, S., & Zhu, Z. (2023) · Frontiers in Endocrinology · doi:10.3389/fendo.2023.1267170 · Cited by 35
Regulation of Mitochondrial Dynamics by Aerobic Exercise in Cardiovascular Diseases
Gu, C., Yan, J., Zhao, L., Wu, G., & Wang, Y. (2022) · Frontiers in Cardiovascular Medicine · doi:10.3389/fcvm.2021.788505 · Cited by 29
Moyzis, A. G., Lally, N. S., Liang, W., Leon, L. J., Najor, R. H., Orogo, A. M., & Gustafsson, Å. B. (2020) · Journal of Molecular and Cellular Cardiology · doi:10.1016/j.yjmcc.2020.07.009 · Cited by 27
Craige, S. M., Mammel, R., Amiri, N., Willoughby, O. S., & Drake, J. C. (2024) · Redox Biology · doi:10.1016/j.redox.2024.103371 · Cited by 30
Conserved multi-tissue transcriptomic adaptations to exercise training in humans and mice
Moore, T. M., Lee-Ødegård, S., Olsén, T., Morselli, M., Strumwasser, A. R., Lin, A. J., Zhou, Z., Abrishami, A. D., Garcia, S. M., Bribiesca, J., et al. (2023) · Cell Reports · doi:10.1016/j.celrep.2023.112499 · Cited by 27
Self-citationKoo, J., & Kang, E. (2019) · Physical Activity and Nutrition · doi:10.20463/jenb.2019.0005 · Cited by 26
IRF4 in Skeletal Muscle Regulates Exercise Capacity via PTG/Glycogen Pathway
Zhu, X., Yao, T. S., Wang, R., Guo, S., Wang, X., Zhou, Z., Zhang, Y., Zhuo, X., Wang, R., Li, J. Z., et al. (2020) · Advanced Science · doi:10.1002/advs.202001502 · Cited by 26
Self-citationKugler, B. A., Deng, W., Duguay, A. L., Garcia, J. P., Anderson, M. C., Nguyen, P., Houmard, J. A., & Zou, K. (2021) · Physiological Reports · doi:10.14814/phy2.14808 · Cited by 25
Merz, K. E., Hwang, J. H., Zhou, C., Veluthakal, R., McCown, E. M., Hamilton, A., Oh, E., Dai, W., Fueger, P. T., Jiang, L., et al. (2022) · Nature Communications · doi:10.1038/s41467-022-28061-w · Cited by 26
Emerging role of mitophagy in myoblast differentiation and skeletal muscle remodeling
Rahman, F. A., & Quadrilatero, J. (2021) · Seminars in Cell and Developmental Biology · doi:10.1016/j.semcdb.2021.11.026 · Cited by 25
Acute exercise rapidly activates hepatic mitophagic flux
McCoin, C. S., Franczak, E., Deng, F., Pei, D., Ding, W., & Thyfault, J. P. (2022) · Journal of Applied Physiology · doi:10.1152/japplphysiol.00704.2021 · Cited by 24
Beneficial Role of Exercise in the Modulation of mdx Muscle Plastic Remodeling and Oxidative Stress
Frinchi, M., Morici, G., Mudò, G., Bonsignore, M. R., & Liberto, V. D. (2021) · Antioxidants · doi:10.3390/antiox10040558 · Cited by 23
Role of Nrf2 and exercise in alleviating COPD-induced skeletal muscle dysfunction
Jiang, M., Li, P., Wang, Y., Cao, Y., Han, X., Jiang, L., Liu, X., & Wu, W. (2023) · Therapeutic Advances in Respiratory Disease · doi:10.1177/17534666231208633 · Cited by 22
Drp1 controls complex II assembly and skeletal muscle metabolism by Sdhaf2 action on mitochondria
Zhou, Z., Ma, A., Moore, T. M., Wolf, D. M., Yang, N. L., Tran, P. H., Segawa, M., Strumwasser, A. R., Ren, W., Fu, K., et al. (2024) · Science Advances · doi:10.1126/sciadv.adl0389 · Cited by 22
Self-citationKugler, B. A., Lourie, J., BERGER, N. J. A., Lin, N., Nguyen, P., DosSantos, E., Ali, A. S., Sesay, A., Rosen, H. G., KALEMBA, B. L., et al. (2023) · Molecular Metabolism · doi:10.1016/j.molmet.2023.101802 · Cited by 21
Harnessing exercise to combat chronic diseases: the role of Drp1-Mediated mitochondrial fission
Sun, Y., He, J., Bao, L., Shi, X., Wang, J., & Li, Q. (2025) · Frontiers in Cell and Developmental Biology · doi:10.3389/fcell.2025.1481756 · Cited by 21
Waldman, H. S. (2024) · Nutrients · doi:10.3390/nu16111750 · Cited by 23
Jun, L., Knight, E., Broderick, T. L., Al‐Nakkash, L., Tobin, B. L., Geetha, T., & Babu, J. R. (2024) · Nutrients · doi:10.3390/nu16121836 · Cited by 17
The acute and chronic influence of exercise on mitochondrial dynamics in skeletal muscle
Ritenis, E. J., Padilha, C. S., Cooke, M. B., Stathis, C. G., Philp, A., & CAMERA, D. M. (2024) · American Journal of Physiology-Endocrinology and Metabolism · doi:10.1152/ajpendo.00311.2024 · Cited by 18
Mitochondrial Dysfunction in HFpEF: Potential Interventions Through Exercise
Cui, X., Spanos, M., Zhao, C., Wan, W., Cui, C., Wang, L., & Xiao, J. (2025) · Journal of Cardiovascular Translational Research · doi:10.1007/s12265-025-10591-5 · Cited by 19
Li, X., Yang, Y., Shi, X., Zhang, Z., & Ding, S. (2024) · International Journal of Molecular Sciences · doi:10.3390/ijms25063196 · Cited by 21
Ramos‐Jiménez, A., Rubio-Valles, M., Ramos-Hernández, J. A., González-Rodríguez, E., & Moreno-Brito, V. (2025) · International Journal of Molecular Sciences · doi:10.3390/ijms26178697 · Cited by 20
Suzuki, J. (2019) · Physiological Reports · doi:10.14814/phy2.14182 · Cited by 16
Mikhail, A. I., Manta, A., Ng, S. Y., Osborne, A. K., Mattina, S. R., Mackie, M. R., & Ljubicic, V. (2023) · Acta Physiologica · doi:10.1111/apha.13943 · Cited by 16
Effect of caffeine on mitochondrial biogenesis in the skeletal muscle – A narrative review
Yamada, A. K., Pimentel, G. D., Pickering, C., Cordeiro, A. V., & Silva, V. R. R. (2022) · Clinical Nutrition ESPEN · doi:10.1016/j.clnesp.2022.09.001 · Cited by 15
Apablaza, P., Bórquez, J. C., Mendoza, R., Silva, M. A., Tapia, G., Espinosa, A., Troncoso, R., Videla, L. A., Juretić, N., & del Campo, A. (2023) · International Journal of Molecular Sciences · doi:10.3390/ijms24065654 · Cited by 14
Cui, J., Song, L., Wang, R., Hu, S., Yang, Z., Zhang, Z., Sun, B., & Cui, W. (2021) · Nutrients · doi:10.3390/nu13103417 · Cited by 13
Nishimura, A., Ogata, S., Tang, X., Hengphasatporn, K., Umezawa, K., Sanbo, M., Hirabayashi, M., Kato, Y., Ibuki, Y., Kumagai, Y., et al. (2025) · Nature Communications · doi:10.1038/s41467-024-55661-5 · Cited by 14
Mitochondrial dynamics: roles in exercise physiology and muscle mass regulation
Djalalvandi, A., & Scorrano, L. (2022) · Current Opinion in Physiology · doi:10.1016/j.cophys.2022.100550 · Cited by 14
Nutritional approaches targeting mitochondria for the prevention of sarcopenia
Hahm, J., Nirmala, F. S., Ha, T. Y., & Ahn, J. (2023) · Nutrition Reviews · doi:10.1093/nutrit/nuad084 · Cited by 13
Kugler, B. A., Deng, W., Francois, B., Anderson, M. C., Hinkley, J. M., Houmard, J. A., Gona, P. N., & Zou, K. (2020) · Medicine & Science in Sports & Exercise · doi:10.1249/mss.0000000000002580 · Cited by 12
The emerging role of exercise preconditioning in preventing skeletal muscle atrophy
Zhou, X., Li, S., Wang, L., Wang, J., Zhang, P., & Chen, X. (2025) · Frontiers in Physiology · doi:10.3389/fphys.2025.1559594 · Cited by 15
Loss of ovarian function prevents exercise-induced activation of hepatic mitophagic flux
Franczak, E., Kugler, B. A., Salathe, S. F., Allen, J., Sardiu, M. E., McCoin, C. S., Hevener, A. L., Morris, E. M., & Thyfault, J. P. (2025) · American Journal of Physiology-Endocrinology and Metabolism · doi:10.1152/ajpendo.00107.2025 · Cited by 9
Self-citationZhang, C., Zheng, X., Xiang, L., & Su, Z. (2025) · Molecular and Cellular Biochemistry · doi:10.1007/s11010-025-05441-6 · Cited by 10
Jurrjens, A. W., Seldin, M. M., Giles, C., Meikle, P. J., Drew, B. G., & Calkin, A. C. (2023) · eLife · doi:10.7554/elife.86139 · Cited by 11
Self-citationChen, T., Hill, J. T., Moore, T. M., Cheung, E. C. K., Olsen, Z. E., Piorczynski, T. B., Marriott, T. D., Tessem, J. S., Walton, C. M., Bikman, B. T., et al. (2020) · Biochimica et Biophysica Acta (BBA) - Molecular Basis of Disease · doi:10.1016/j.bbadis.2020.165805 · Cited by 8
Self-citationBrenmoehl, J., Ohde, D., Walz, C., Langhammer, M., Schultz, J., & Hoeflich, A. (2020) · Cells · doi:10.3390/cells9122697 · Cited by 9
Voos, K. M., TZENG, J., Patel, P., Rubinsky, S., Choi, H. E., Pharr, T., Sookram, S., Baur, J. A., Soderblom, E. J., & Lorenzo, D. N. (2025) · Nature Communications · doi:10.1038/s41467-025-62977-3 · Cited by 10
Infrared Sensor Technology (IST) Test as a Tool for Assessment of Flexibility
Syahruddin, S., Imam, I., Lungit, L., Ramdan, R., & Bagus, B. (2019) · Advances in Rehabilitation · doi:10.5114/areh.2019.87743 · Cited by 8
Marshall, R. N., McKendry, J., Smeuninx, B., Seabright, A. P., Morgan, P. T., Greig, C. A., & Breen, L. (2023) · Frontiers in Physiology · doi:10.3389/fphys.2022.1097988 · Cited by 8
Effect of voluntary exercise upon the metabolic syndrome and gut microbiome composition in mice
Moore, T. M., Terrazas, A., Strumwasser, A. R., Lin, A. J., Zhu, X., Anand, A. T. S., Nguyen, C. Q., Stiles, L., Norheim, F., Lang, J. M., et al. (2021) · Physiological Reports · doi:10.14814/phy2.15068 · Cited by 7
Self-citationPrecision remodeling: how exercise improves mitochondrial quality in myofibers
Drake, J. C., & Yan, Z. (2019) · Current Opinion in Physiology · doi:10.1016/j.cophys.2019.05.005 · Cited by 8
Zhou, Z., Moore, T. M., Strumwasser, A. R., Ribas, V., Iwasaki, H., Morrow, N., Ma, A., Tran, P. H., Wanagat, J., Vallim, T. Q. D. A., et al. (2025) · Cell Reports Medicine · doi:10.1016/j.xcrm.2025.102116 · Cited by 9
Self-citationCarriel‐Nesvara, A., Muñoz-Medina, C., Deldicque, L., & Castro‐Sepúlveda, M. (2025) · The Journal of Physiology · doi:10.1113/jp289019 · Cited by 8
The role of exercise-mediated mitochondrial quality control remodeling in aging
Cai, T., Li, Y., Zhang, Y., Li, C., Li, S., & Zhang, Q. (2026) · Frontiers in Cell and Developmental Biology · doi:10.3389/fcell.2026.1792645 · Cited by 7
Vidyadharan, V. A., Betancourt, A., Smith, C., Blesson, C. S., & Yallampalli, C. (2024) · International Journal of Molecular Sciences · doi:10.3390/ijms252312860 · Cited by 10
Rodrigues, N. D. A., Gobatto, C. A., Forte, L. D. M., Sousa, F. A. D. B., Torsoni, A. S., de Fante, T., & Manchado-Gobatto, F. D. B. (2021) · Applied Physiology, Nutrition, and Metabolism · doi:10.1139/apnm-2020-1053 · Cited by 7
Gendi, F., Pei, F., Wang, Y., Li, H., Fu, J., & Chang, C. K. (2022) · International Journal of Molecular Sciences · doi:10.3390/ijms23084235 · Cited by 7
Sensing local energetics to acutely regulate mitophagy in skeletal muscle
Nichenko, A. S., Specht, K. S., Craige, S. M., & Drake, J. C. (2022) · Frontiers in Cell and Developmental Biology · doi:10.3389/fcell.2022.987317 · Cited by 7
A constricted mitochondrial morphology formed during respiration
Singh, M. K., Cavellini, L., Morcillo-Parra, M. Á., Kunz, C., Lelek, M., Bomme, P., Barascu, A., Alsayyah, C., Teixeira, M. T., Belgareh‐Touzé, N., et al. (2025) · Nature Communications · doi:10.1038/s41467-025-60658-9 · Cited by 6
Mitochondrial Biogenesis in Skeletal Muscle
Hood, D. A., Memme, J. M., Oliveira, A. N., Moradi, N., & Champsi, S. (2025) · Advances in experimental medicine and biology · doi:10.1007/978-3-031-88361-3_2 · Cited by 5
Guan, Y., & Yan, Z. (2025) · Advances in experimental medicine and biology · doi:10.1007/978-3-031-88361-3_3 · Cited by 5
Yin, L., Tang, H., Qu, J., Jia, Y., Zhang, Q., & Wang, X. (2024) · American Journal of Physiology-Endocrinology and Metabolism · doi:10.1152/ajpendo.00104.2023 · Cited by 5
Haghighi, A. H., Bandali, M. R., Askari, R., Shahrabadi, H., Barone, R., Bei, R., Farsetti, P., & Perrone, M. A. (2025) · Journal of Orthopaedic Surgery and Research · doi:10.1186/s13018-025-05809-w · Cited by 5
Autophagic signaling promotes systems-wide remodeling in skeletal muscle upon oncometabolic stressPreprint
Karlstaedt, A., Vitrac, H., Salazar, R., Gould, B. D., Soedkamp, D., Spivia, W. R., Raedschelders, K., Dinh, A. Q., Guzman, A. G., Tan, L., et al. (2020) · bioRxiv (Cold Spring Harbor Laboratory) · doi:10.1101/2020.10.13.338202 · Cited by 4
Extracellular mitochondria: a potential player involved in exercise health benefits
Pedrosa, M. B., Santos, L. L., Ferreira, R. M. S., & Magalhães, J. S. (2025) · Biochimie · doi:10.1016/j.biochi.2025.12.011 · Cited by 4
Wang, Y., Du, X., & Wang, Q. (2026) · Frontiers in Cardiovascular Medicine · doi:10.3389/fcvm.2026.1746819 · Cited by 5
Exercise training and changes in skeletal muscle mitochondrial proteins: from blots to “omics”
Reisman, E. G., Caruana, N. J., & Bishop, D. J. (2024) · Critical Reviews in Biochemistry and Molecular Biology · doi:10.1080/10409238.2024.2383408 · Cited by 3
Metadata
- Authors
- Moore, T. M., Zhou, Z., Cohn, W., Norheim, F., Lin, A. J., Kalajian, N., Strumwasser, A. R., Cory, K., Whitney, K., Ho, T., Ho, T., Lee, J. L., Rucker, D. H., Shirihai, O., van der Bliek, A. M., Whitelegge, J. P., Seldin, M. M., Lusis, A. J., Lee, S., Drevon, C. A., Mahata, S. K., Turcotte, L. P., & Hevener, A. L.
- Affiliations
- University of Southern California (US)
- University of California, Los Angeles (US)
- University of Oslo (NO)
- University of California San Diego (US)
- Corresponding author
- Hevener, Andrea L.
- ORCID
- Venue
- Molecular Metabolism
- Publisher
- Elsevier BV
- Published
- 2019-03
- Volume
- 21
- Pages
- 51-67
- ISSN
- 2212-8778 (ISSN-L)
- PMC
- PMC6407367
- OpenAlex
- W2902937014
- Cited by
- 131
- References
- 79
- Citations by year
- 2026: 16 · 2025: 20 · 2024: 14 · 2023: 17 · 2022: 17 · 2021: 16 · 2020: 22 · 2019: 9
- FWCI
- 4.18
- Type
- journal article
- Language
- en
- Open access
- gold
- doi.org
- Licence
- Locations
- Molecular Metabolism (publishedVersion, cc-by-nc-nd)
- Europe PMC (PubMed Central) (publishedVersion, cc-by-nc-nd)
- PubMed Central (publishedVersion, cc-by-nc-nd)
- PubMed (publishedVersion)
- DOAJ (DOAJ: Directory of Open Access Journals) (submittedVersion)
- eScholarship (California Digital Library) (submittedVersion, cc-by)
- NORA - Norwegian Open Research Archives (submittedVersion, cc-by-nc-nd)
- Funders
- Institute of Basic Medical Sciences
- National Institute on Aging (5P30AG028748)
- National Aeronautics and Space Administration
- Norges Forskningsråd
- American College of Sports Medicine
- National Institutes of Health (P30DK063491, U24DK097748, F31DK108657, DK109724, 5T32HD007228)
- U.S. Department of Veterans Affairs (NCT01803568, I01BX000323, HL28481, HL30568)
- Seventh Framework Programme (289511)
- Clinical and Translational Science Institute, University of California, Los Angeles (ULTR000124)
- Topics
- Life Sciences › Biochemistry, Genetics and Molecular Biology › Molecular Biology › Mitochondrial Function and Pathology
- Health Sciences › Medicine › Physiology (medical) › Cardiovascular and exercise physiology
- Health Sciences › Medicine › Physiology (medical) › Adipose Tissue and Metabolism
- Keywords
- mitochondrial dynamics, Drp1, mitochondrial fission, mitochondrial fusion, mitophagy, mitochondrial biogenesis, exercise training, endurance exercise, skeletal muscle, exercise performance, dysglycemia, Hybrid Mouse Diversity Panel, mitochondrial metabolism
- MeSH terms
- Physical Functional Performance, Adaptation, Physiological, Adult, Aged, Animals, Blood Glucose, Female, Humans, Male, Mice, Inbred BALB C, Mice, Inbred C3H, Mice, Inbred C57BL, Microtubule-Associated Proteins, Middle Aged, Mitochondria, Phosphorylation, Physical Conditioning, Animal, Physical Endurance, Gene Deletion, Muscle, Skeletal, GTP Phosphohydrolases, Mitochondrial Proteins, Dynamins, Mice, Mitochondrial Dynamics
About these checks
Registry, retraction, Cites and statistics results are computed, not judged, with one exception: a printed reference that no index lists is read once by a model before it counts as a citation error. Claims are extracted by a model and kept only when their quote appears verbatim in the text; each cited source is then checked, with a model’s help, for whether it says what the claim relies on. Those verdicts can be wrong — read the claim’s quote and the cited source before relying on one.
Statistics and arithmetic are recomputed, not judged.
Confidence bands are shown only for fields calibrated on our annotated test set. None is calibrated yet, so no band is shown.
What counts as a claim ›How we measure confidence ›How we check this ›
Are you an author, or do you see a problem with this page? Request a review
