

The DOI matches its Crossref record; 241 of the 241 references it cites were found in a registry or an index.
Mathematical framework for large-scale brain network modeling in The Virtual Brain
Open accessAbstract
In this article, we describe the mathematical framework of the computational model at the core of the tool The Virtual Brain (TVB), designed to simulate collective whole brain dynamics by virtualizing brain structure and function, allowing simultaneous outputs of a number of experimental modalities such as electro- and magnetoencephalography (EEG, MEG) and functional Magnetic Resonance Imaging (fMRI). The implementation allows for a systematic exploration and manipulation of every underlying component of a large-scale brain network model (BNM), such as the neural mass model governing the local dynamics or the structural connectivity constraining the space time structure of the network couplings. Here, a consistent notation for the generalized BNM is given, so that in this form the equations represent a direct link between the mathematical description of BNMs and the components of the numerical implementation in TVB. Finally, we made a summary of the forward models implemented for mapping simulated neural activity (EEG, MEG, sterotactic electroencephalogram (sEEG), fMRI), identifying their advantages and limitations.
Overview
The claims and statistics of this paper haven’t been checked yet.
Run the check — free, no account needed. It reads the open-access text and checks the sources it cites.
Integrity signals
Registry
Cites
Statistics
Figures
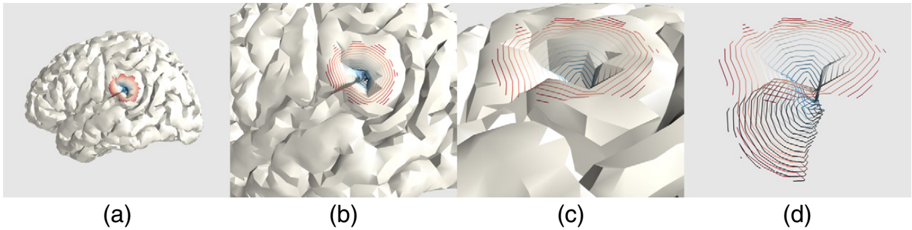
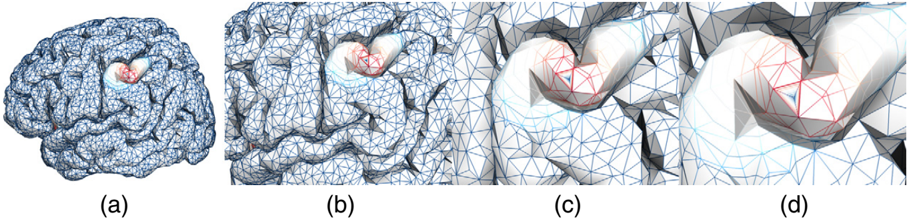
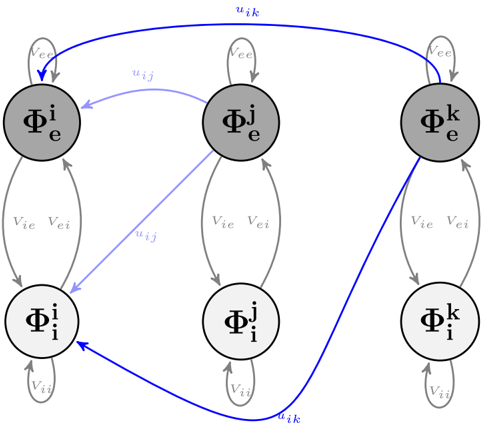
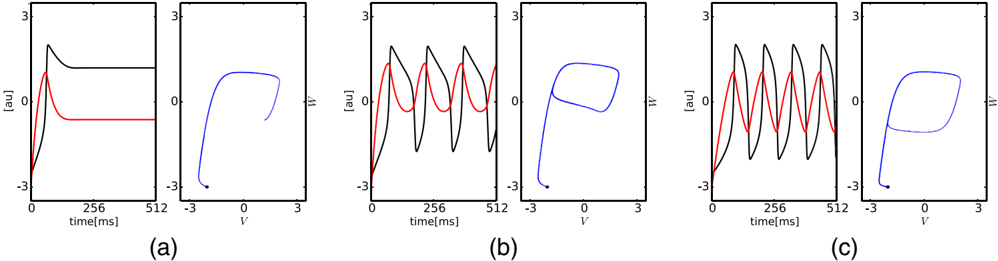
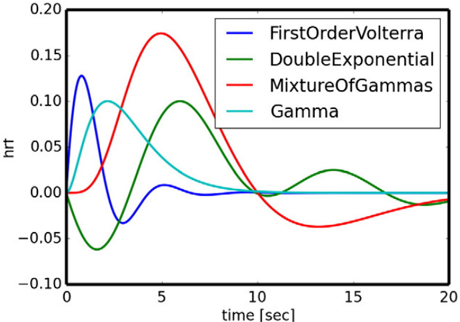
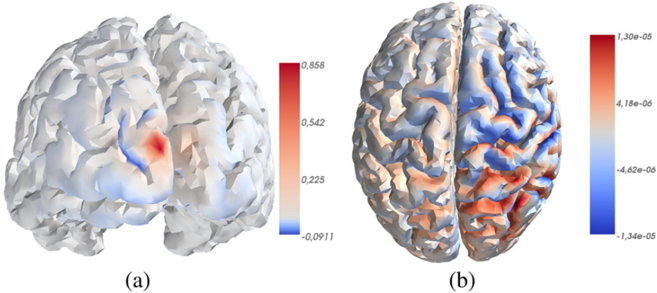
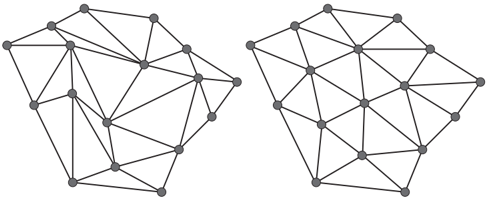
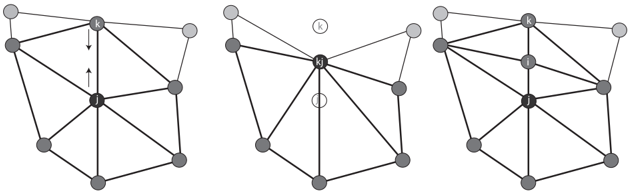
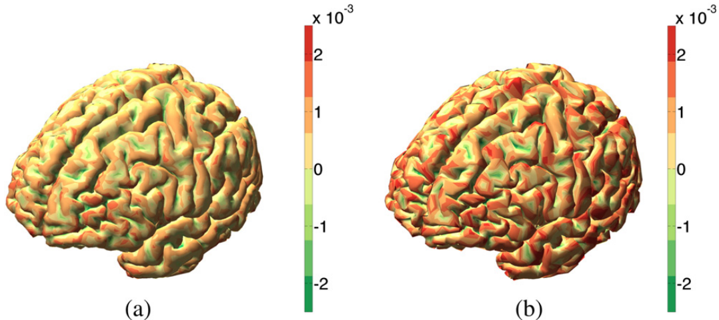
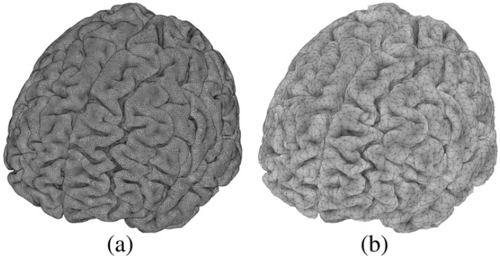
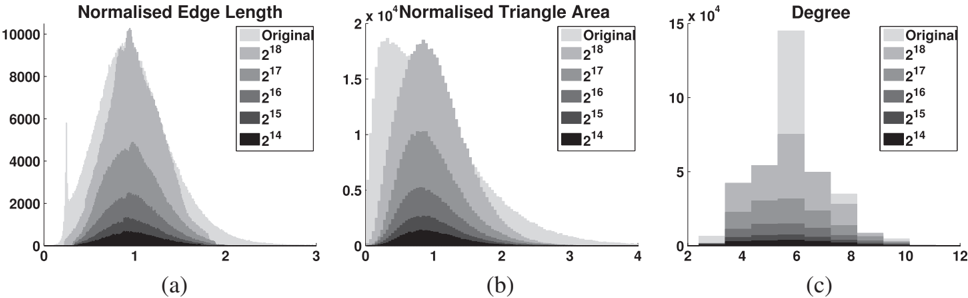
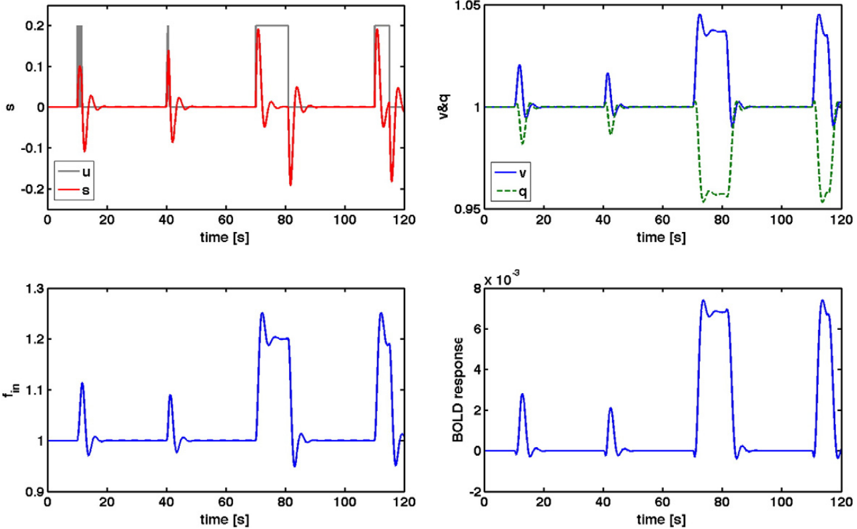
Verification
Claims the paper makes
The claims and statistics of this paper haven’t been checked yet.
Run the check — free, no account needed. It reads the open-access text and checks the sources it cites.
Claims other papers make about this one
Each is checked against this paper’s own text: does it say what the citing paper says it does?
In the citing paper
“Models can involve highly parameterized simulations of regional activity (Hansen et al., 2015; Messe et al., 2014; Sanz-Leon et al., 2015), or sparser analytic predictions of FC using graph metrics of mutual communication (Goni et al., 2014; Grayson et al., 2016) (although, both approaches appear to be comparably effective; see Figure 1D).”
From Development of large-scale functional networks from birth to adulthood: A guide to the neuroimaging literature (2017) · cites this paper as Sanz-Leon et al., 2015
Self-check
Percentages, sums and reported differences re-computed from the paper’s own numbers.
The self-check needs the paper’s full text.
Citations
Cites
Tzourio-Mazoyer, N., Landeau, B., Papathanassiou, D., Crivello, F., Etard, O., Delcroix, N., Mazoyer, B., & Joliot, M. (2002) · NeuroImage · doi:10.1006/nimg.2001.0978 · Cited by 16,319
Desikan, R. S., Ségonne, F., Fischl, B., Quinn, B. T., Dickerson, B. C., Blacker, D., Buckner, R. L., Dale, A. M., Maguire, R. P., Hyman, B. T., et al. (2006) · NeuroImage · doi:10.1016/j.neuroimage.2006.01.021 · Cited by 13,324
Cortical Surface-Based Analysis
Dale, A. M., Fischl, B., & Sereno, M. I. (1999) · NeuroImage · doi:10.1006/nimg.1998.0395 · Cited by 10,910
Oostenveld, R., Fries, P., Maris, E., & Schoffelen, J.-M. (2011) · Computational Intelligence and Neuroscience · doi:10.1155/2011/156869 · Cited by 10,323
Functional connectivity in the motor cortex of resting human brain using echo‐planar mri
Biswal, B., Zerrin Yetkin, F., Haughton, V. M., & Hyde, J. S. (1995) · Magnetic Resonance in Medicine · doi:10.1002/mrm.1910340409 · Cited by 9,812
Statistical parametric maps in functional imaging: A general linear approach
Friston, K. J., Holmes, A. P., Worsley, K. J., Poline, J. ‐., Frith, C. D., & Frackowiak, R. S. J. (1994) · Human Brain Mapping · doi:10.1002/hbm.460020402 · Cited by 9,688
The organization of the human cerebral cortex estimated by intrinsic functional connectivity
Thomas Yeo, B. T., Krienen, F. M., Sepulcre, J., Sabuncu, M. R., Lashkari, D., Hollinshead, M., Roffman, J. L., Smoller, J. W., Zöllei, L., Polimeni, J. R., et al. (2011) · Journal of Neurophysiology · doi:10.1152/jn.00338.2011 · Cited by 9,182
The organization of the human cerebellum estimated by intrinsic functional connectivity
Buckner, R. L., Krienen, F. M., Castellanos, A., Diaz, J. C., & Yeo, B. T. T. (2011) · Journal of Neurophysiology · doi:10.1152/jn.00339.2011 · Cited by 7,304
Spontaneous fluctuations in brain activity observed with functional magnetic resonance imaging
Fox, M. D., & Raichle, M. E. (2007) · Nature Reviews Neuroscience · doi:10.1038/nrn2201 · Cited by 6,700
Brain magnetic resonance imaging with contrast dependent on blood oxygenation.
Ogawa, S., Lee, T. M., Kay, A. R., & Tank, D. W. (1990) · Proceedings of the National Academy of Sciences · doi:10.1073/pnas.87.24.9868 · Cited by 6,483
Research works printed but not linked: 1
- Spiegler, 2015, The critical brain: dissipation and restin-state networks, PNAS
Cited by
Sorted by citations
The Kuramoto model in complex networks
Rodrigues, F. A., Peron, T., Ji, P., & Kurths, J. (2015) · Physics Reports · doi:10.1016/j.physrep.2015.10.008 · Cited by 1,064
“Other recent works have investigated further aspects of the relation between structure and dynamics of phase oscillators in anatomical and functional cortical networks [214, 378, 401–406], which includes studies on the effects of remote synchronization [407–409], a toolbox for large-scale simulations of brain dynamics…”
BackgroundLinking Structure and Function in Macroscale Brain Networks
Suárez, L. E., Markello, R. D., Betzel, R. F., & Mišić, B. (2020) · Trends in Cognitive Sciences · doi:10.1016/j.tics.2020.01.008 · Cited by 769
Gradients of structure–function tethering across neocortex
Vázquez-Rodríguez, B., Suárez, L. E., Markello, R. D., Shafiei, G., Paquola, C., Hagmann, P., van den Heuvel, M. P., Bernhardt, B. C., Spreng, R. N., & Mišić, B. (2019) · Proceedings of the National Academy of Sciences · doi:10.1073/pnas.1903403116 · Cited by 472
Grayson, D. S., & Fair, D. A. (2017) · NeuroImage · doi:10.1016/j.neuroimage.2017.01.079 · Cited by 411
“Given that macroscale FC is modulated by both interregional connectivity strength as well as local population dynamics (Sanz-Leon et al., 2015), alterations in SC-FC coupling could potentially point to important shifts in the underlying drivers of various network phenomena.”
BackgroundThe Virtual Epileptic Patient: Individualized whole-brain models of epilepsy spread
Jirsa, V., Proix, T., Perdikis, D., Woodman, M., Wang, H., Gonzalez-Martinez, J. A., Bernard, C., Bénar, C., Guye, M., Chauvel, P., et al. (2016) · NeuroImage · doi:10.1016/j.neuroimage.2016.04.049 · Cited by 435
Self-citation
Metadata
- Authors
- Sanz-Leon, P., Knock, S. A., Spiegler, A., & Jirsa, V. K.
- Affiliations
- QIMR Berghofer Medical Research Institute (AU)
- Inserm (FR)
- Corresponding author
- Jirsa, Viktor K.
- Venue
- NeuroImage
- Publisher
- Elsevier BV
- Published
- 2015-05
- Volume
- 111
- Pages
- 385-430
- ISSN
- 1053-8119 (ISSN-L)
- OpenAlex
- W2074725578
- Semantic Scholar
- 23be65f2b2fee15432e3086c0d98a6610709848f
- Cited by
- 356
- References
- 240
- Citations by year
- 2026: 27 · 2025: 53 · 2024: 41 · 2023: 34 · 2022: 37 · 2021: 36 · 2020: 29 · 2019: 23 · 2018: 25 · 2017: 21 · 2016: 15 · 2015: 13
- FWCI
- 14.82
- Type
- journal article
- Language
- en
- Open access
- hybrid
- doi.org
- Licence
- Locations
- NeuroImage (publishedVersion, cc-by-nc-nd)
- PubMed (publishedVersion)
- Funders
- James S. McDonnell Foundation (FP7-ICT BrainScales - 2009-6)
- Topics
- Life Sciences › Neuroscience › Cognitive Neuroscience › Neural dynamics and brain function
- Life Sciences › Neuroscience › Cognitive Neuroscience › Functional Brain Connectivity Studies
- Health Sciences › Medicine › Radiology, Nuclear Medicine and Imaging › Advanced Neuroimaging Techniques and Applications
- Keywords
- The Virtual Brain, whole-brain dynamics, neural mass model, structural connectivity, forward model, EEG, MEG, functional MRI, stereoelectroencephalography, mathematical notation, computational neuroscience simulation
- MeSH terms
- Brain, Humans, Models, Neurological, Nerve Net, Functional Neuroimaging
About these checks
Registry, retraction, Cites and statistics results are computed, not judged, with one exception: a printed reference that no index lists is read once by a model before it counts as a citation error. Claims are extracted by a model and kept only when their quote appears verbatim in the text; each cited source is then checked, with a model’s help, for whether it says what the claim relies on. Those verdicts can be wrong — read the claim’s quote and the cited source before relying on one.
Statistics and arithmetic are recomputed, not judged.
Confidence bands are shown only for fields calibrated on our annotated test set. None is calibrated yet, so no band is shown.
What counts as a claim ›How we measure confidence ›How we check this ›
Are you an author, or do you see a problem with this page? Request a review
