

The DOI matches its Crossref record; 107 of the 107 references it cites were found in a registry or an index.
Optimal trajectories of brain state transitions
Open accessAbstract
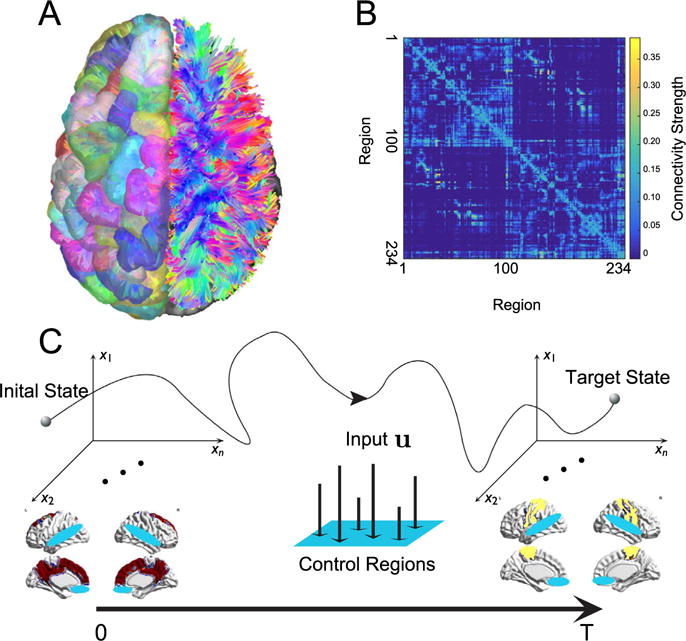
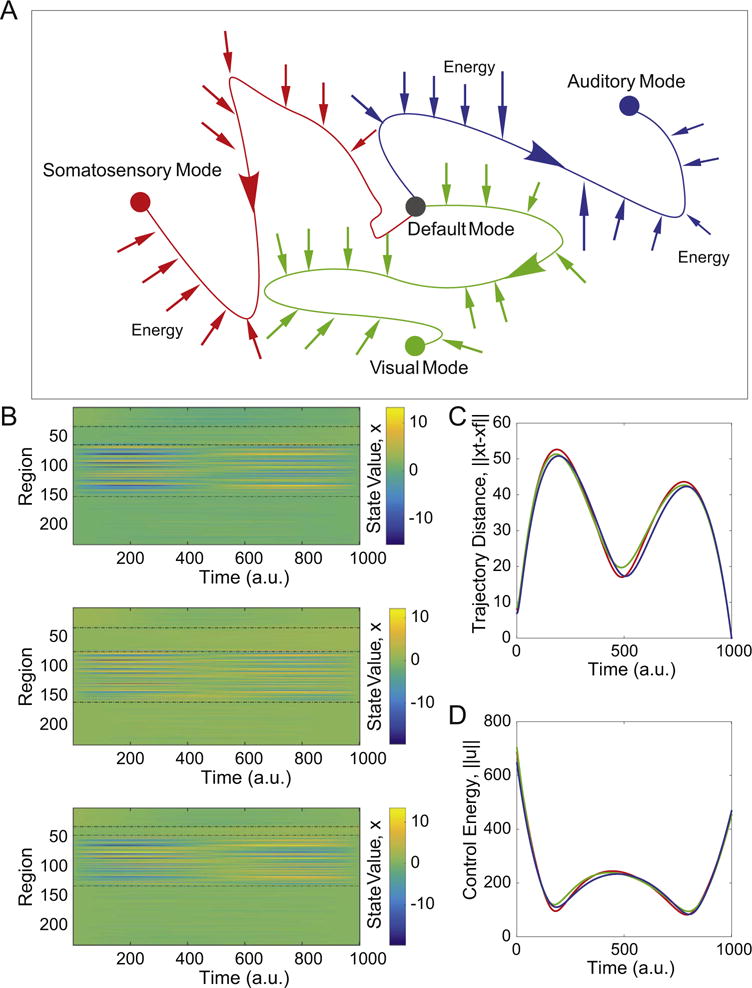
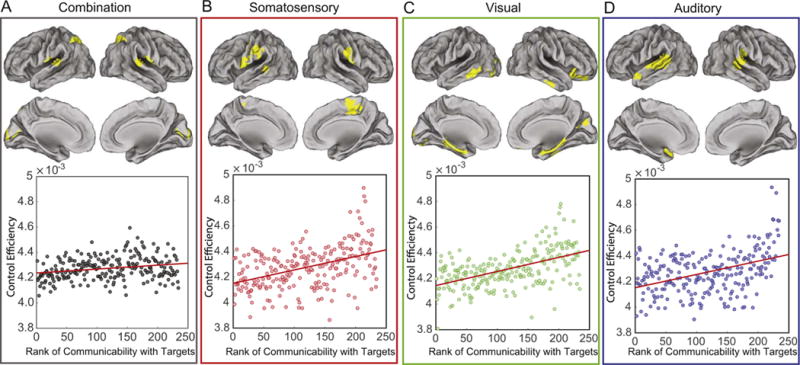
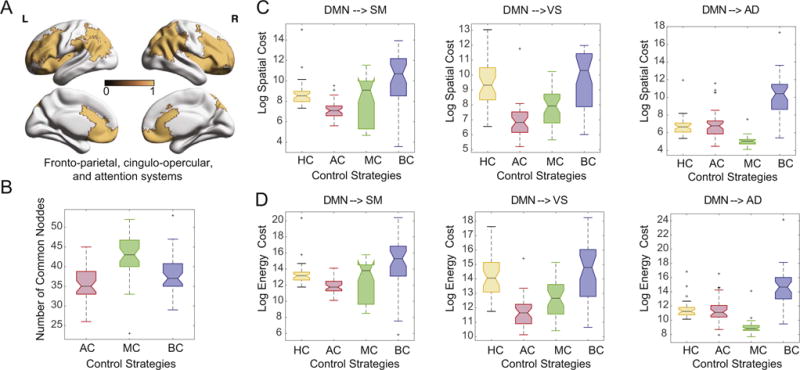
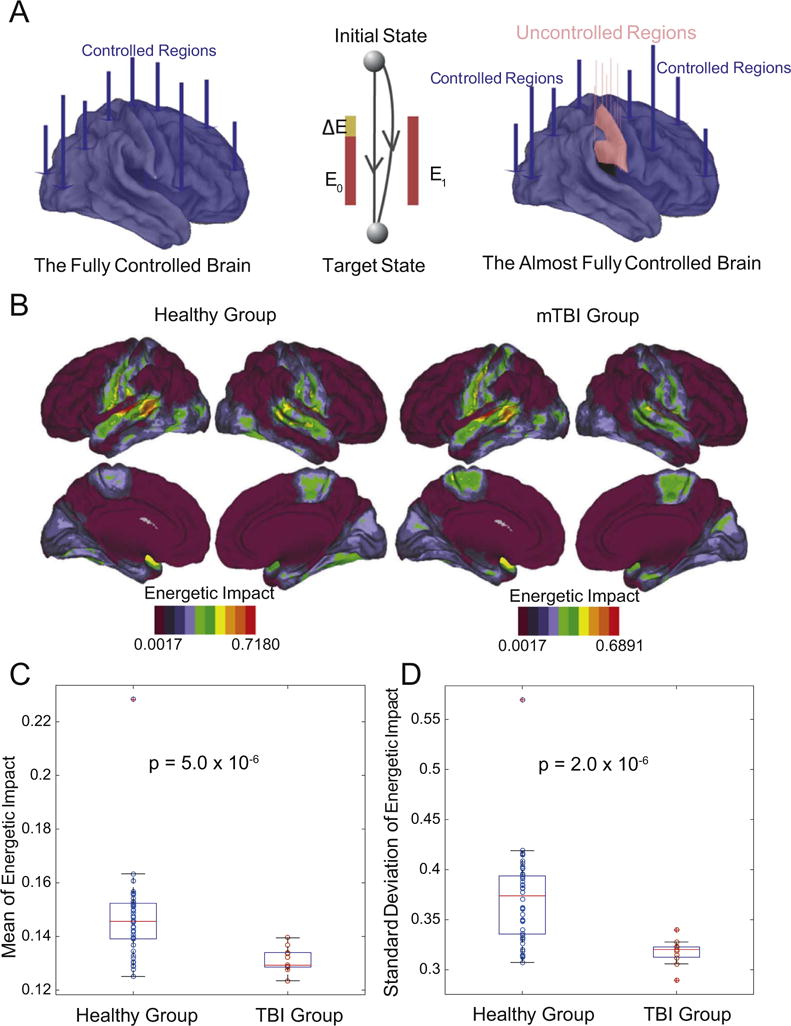
The complexity of neural dynamics stems in part from the complexity of the underlying anatomy. Yet how white matter structure constrains how the brain transitions from one cognitive state to another remains unknown. Here we address this question by drawing on recent advances in network control theory to model the underlying mechanisms of brain state transitions as elicited by the collective control of region sets. We find that previously identified attention and executive control systems are poised to affect a broad array of state transitions that cannot easily be classified by traditional engineering-based notions of control. This theoretical versatility comes with a vulnerability to injury. In patients with mild traumatic brain injury, we observe a loss of specificity in putative control processes, suggesting greater susceptibility to neurophysiological noise. These results offer fundamental insights into the mechanisms driving brain state transitions in healthy cognition and their alteration following injury.
Overview
The claims and statistics of this paper haven’t been checked yet.
Run the check — free, no account needed. It reads the open-access text and checks the sources it cites.
Integrity signals
Registry
Cites
Statistics
Figures
Verification
Claims the paper makes
The claims and statistics of this paper haven’t been checked yet.
Run the check — free, no account needed. It reads the open-access text and checks the sources it cites.
Claims other papers make about this one
Each is checked against this paper’s own text: does it say what the citing paper says it does?
In the citing paper
“(in line with the overarching finding that regions with a large number of long distance connections tend to be optimal controllers79.”
From Paying attention to attention in depression (2019) · cites this paper as [79]
Self-check
Percentages, sums and reported differences re-computed from the paper’s own numbers.
The self-check needs the paper’s full text.
Citations
Cites
Control of goal-directed and stimulus-driven attention in the brain
Corbetta, M., & Shulman, G. L. (2002) · Nature Reviews Neuroscience · doi:10.1038/nrn755 · Cited by 12,881
A default mode of brain function
Raichle, M. E., MacLeod, A. M., Snyder, A. Z., Powers, W. J., Gusnard, D. A., & Shulman, G. L. (2001) · Proceedings of the National Academy of Sciences · doi:10.1073/pnas.98.2.676 · Cited by 12,190
Complex brain networks: graph theoretical analysis of structural and functional systems
Bullmore, E., & Sporns, O. (2009) · Nature Reviews Neuroscience · doi:10.1038/nrn2575 · Cited by 11,820
The organization of the human cerebral cortex estimated by intrinsic functional connectivity
Thomas Yeo, B. T., Krienen, F. M., Sepulcre, J., Sabuncu, M. R., Lashkari, D., Hollinshead, M., Roffman, J. L., Smoller, J. W., Zöllei, L., Polimeni, J. R., et al. (2011) · Journal of Neurophysiology · doi:10.1152/jn.00338.2011 · Cited by 9,182
The attention system of the human brain
Posner, M. I., & Petersen, S. E. (1990) · Annual Review of Neuroscience · doi:10.1146/annurev.ne.13.030190.000325 · Cited by 8,070 · cited 2×
“We take a hypothesis-driven approach and define the “control set” to be composed of dorsal and ventral attention (Posner and Petersen, 1989), fronto-parietal, and cingulo-opercular cognitive control regions (Gu et al., 2015).”
The organization of the human cerebellum estimated by intrinsic functional connectivity
Buckner, R. L., Krienen, F. M., Castellanos, A., Diaz, J. C., & Yeo, B. T. T. (2011) · Journal of Neurophysiology · doi:10.1152/jn.00339.2011 · Cited by 7,304
(2005) · Choice Reviews Online · doi:10.5860/choice.43-0626 · Cited by 4,726
Mapping the structural core of human cerebral cortex
Hagmann, P., Cammoun, L., Gigandet, X., Meuli, R., Honey, C. J., Wedeen, V. J., & Sporns, O. (2008) · PLoS Biology · doi:10.1371/journal.pbio.0060159 · Cited by 4,173
Functional Network Organization of the Human Brain
Power, J. D., Cohen, A. L., Nelson, S. M., Wig, G. S., Barnes, K. A., Church, J. A., Vogel, A. C., Laumann, T. O., Miezin, F. M., Schlaggar, B. L., et al. (2011) · Neuron · doi:10.1016/j.neuron.2011.09.006 · Cited by 4,124
The brain's default mode network
Raichle, M. E. (2015) · Annual Review of Neuroscience · doi:10.1146/annurev-neuro-071013-014030 · Cited by 3,904
Research works printed but not linked: 1
- Kandel, E.R., Schwartz, J.H., Jessell, T.M. et al., 2000. Principles of Neural Science, vol. 4. McGraw-Hill, New York.
Cited by
Sorted by citations
The physics of brain network structure, function and control
Lynn, C. W., & Bassett, D. S. (2019) · Nature Reviews Physics · doi:10.1038/s42254-019-0040-8 · Cited by 452
Self-citationPaying attention to attention in depression
Keller, A. S., Leikauf, J. E., Holt-Gosselin, B., Staveland, B. R., & Williams, L. M. (2019) · Translational Psychiatry · doi:10.1038/s41398-019-0616-1 · Cited by 329
Awakening: Predicting external stimulation to force transitions between different brain states
Deco, G., Cruzat, J., Cabral, J., Tagliazucchi, E., Laufs, H., Logothetis, N. K., & Kringelbach, M. L. (2019) · Proceedings of the National Academy of Sciences · doi:10.1073/pnas.1905534116 · Cited by 261
Brain States and Transitions: Insights from Computational Neuroscience
Kringelbach, M. L., & Deco, G. (2020) · Cell Reports · doi:10.1016/j.celrep.2020.108128 · Cited by 249
From maps to multi-dimensional network mechanisms of mental disorders
Braun, U., Schaefer, A., Betzel, R. F., Tost, H., Meyer-Lindenberg, A., & Bassett, D. S. (2018) · Neuron · doi:10.1016/j.neuron.2017.11.007 · Cited by 177
Self-citationBraun, U., Harneit, A., Pergola, G., Menara, T., Schäfer, A., Betzel, R. F., Zang, Z., Schweiger, J. I., Zhang, X., Schwarz, K., et al. (2021) · Nature Communications · doi:10.1038/s41467-021-23694-9 · Cited by 198
Self-citationColloquium : Control of dynamics in brain networks
Tang, E., & Bassett, D. S. (2018) · Reviews of Modern Physics · doi:10.1103/revmodphys.90.031003 · Cited by 161
Self-citationTang, E., Giusti, C., Baum, G. L., Gu, S., Pollock, E., Kahn, A. E., Roalf, D. R., Moore, T. M., Ruparel, K., Gur, R. C., et al. (2017) · Nature Communications · doi:10.1038/s41467-017-01254-4 · Cited by 188
Self-citationTang, E., Giusti, C., Baum, G. L., Gu, S., Pollock, E., Kahn, A. E., Roalf, D. R., Moore, T. M., Ruparel, K., Gur, R. C., et al. (2017) · RePEc: Research Papers in Economics · Cited by 174
Self-citationCornblath, E. J., Ashourvan, A., Kim, J. Z., Betzel, R. F., Ćirić, R., Adebimpe, A., Baum, G. L., He, X., Ruparel, K., Moore, T. M., et al. (2020) · Communications Biology · doi:10.1038/s42003-020-0961-x · Cited by 142
Self-citationStiso, J., Khambhati, A. N., Menara, T., Kahn, A. E., Stein, J. M., Das, S. R., Gorniak, R., Tracy, J. I., Litt, B., Davis, K. A., et al. (2018) · Cell Reports · doi:10.1016/j.celrep.2019.08.008 · Cited by 136
Self-citationRole of graph architecture in controlling dynamical networks with applications to neural systems
Kim, J. Z., Soffer, J., Kahn, A. E., Vettel, J. M., Pasqualetti, F., & Bassett, D. S. (2017) · Nature Physics · doi:10.1038/nphys4268 · Cited by 135
Self-citationModeling and interpreting mesoscale network dynamics
Khambhati, A. N., Sizemore, A. E., Betzel, R. F., & Bassett, D. S. (2017) · NeuroImage · doi:10.1016/j.neuroimage.2017.06.029 · Cited by 127
Self-citationFrom static to temporal network theory: Applications to functional brain connectivity
Thompson, W. H., Brantefors, P., & Fransson, P. (2017) · Network Neuroscience · doi:10.1162/netn_a_00011 · Cited by 128
Karrer, T. M., Kim, J. Z., Stiso, J., Kahn, A. E., Pasqualetti, F., Habel, U., & Bassett, D. S. (2020) · Journal of Neural Engineering · doi:10.1088/1741-2552/ab6e8b · Cited by 124
Self-citationThe Energy Landscape of Neurophysiological Activity Implicit in Brain Network Structure
Gu, S., Cieslak, M., Baird, B., Muldoon, S. F., Grafton, S. T., Pasqualetti, F., & Bassett, D. S. (2018) · Scientific Reports · doi:10.1038/s41598-018-20123-8 · Cited by 118
Self-citationTurbulent-like Dynamics in the Human Brain
Deco, G., & Kringelbach, M. L. (2020) · Cell Reports · doi:10.1016/j.celrep.2020.108471 · Cited by 113
Liégeois, R., Santos, A., Matta, V., Ville, D. V. D., & Sayed, A. H. (2020) · Network Neuroscience · doi:10.1162/netn_a_00166 · Cited by 100
Yu, Q., Du, Y., Chen, J., Jing Sui (Beijing Normal University), my correct affiliation is beijing normal university, N. Q. U. O. S. A. T., Adalı, T., Pearlson, G. D., & Calhoun, V. D. (2018) · Proceedings of the IEEE · doi:10.1109/jproc.2018.2825200 · Cited by 96
Jeganathan, J., Perry, A., Bassett, D. S., Roberts, G. M. P., Mitchell, P. B., & Breakspear, M. J. (2018) · NeuroImage Clinical · doi:10.1016/j.nicl.2018.03.032 · Cited by 87
Self-citationCui, Z., Stiso, J., Baum, G. L., Kim, J. Z., Roalf, D. R., Betzel, R. F., Gu, S., Lu, Z., Xia, C. H., He, X., et al. (2020) · eLife · doi:10.7554/elife.53060 · Cited by 88
Self-citationSex differences in network controllability as a predictor of executive function in youth
Cornblath, E. J., Tang, E., Baum, G. L., Moore, T. M., Adebimpe, A., Roalf, D. R., Gur, R. C., Gur, R. E., Pasqualetti, F., Satterthwaite, T. D., et al. (2018) · NeuroImage · doi:10.1016/j.neuroimage.2018.11.048 · Cited by 84
Self-citationOptimal deployment of resources for maximizing impact in spreading processes
Lokhov, A. Y., & Saad, D. (2017) · Proceedings of the National Academy of Sciences · doi:10.1073/pnas.1614694114 · Cited by 77
A Complex Systems Perspective on Neuroimaging Studies of Behavior and Its Disorders
Turkheimer, F., Rosas, F. E., Dipasquale, O., Martins, D., Fagerholm, E. D., Expert, P., Váša, F., Lord, L.-D., & Leech, R. (2021) · The Neuroscientist · doi:10.1177/1073858421994784 · Cited by 75
He, X., Caciagli, L., Parkes, L., Stiso, J., Karrer, T. M., Kim, J. Z., Lu, Z., Menara, T., Pasqualetti, F., Sperling, M. R., et al. (2022) · Science Advances · doi:10.1126/sciadv.abn2293 · Cited by 68
Self-citationControl principles for complex biological networks
Li, M., Gao, H., Wang, J., & Wu, F. (2018) · Briefings in Bioinformatics · doi:10.1093/bib/bby088 · Cited by 68
Dynamic mode decomposition of resting-state and task fMRI
Casorso, J., Kong, X., Wang, C., Ville, D. V. D., Yeo, B. T. T., & Liégeois, R. (2019) · NeuroImage · doi:10.1016/j.neuroimage.2019.03.019 · Cited by 71
Luppi, A. I., Mediano, P. A. M., Rosas, F. E., Allanson, J. E., Pickard, J. D., Williams, G. B., Craig, M. M., Finoia, P., Peattie, A. R. D., Coppola, P., et al. (2022) · Communications Biology · doi:10.1038/s42003-022-03330-y · Cited by 79
Khambhati, A. N., Kahn, A. E., Costantini, J. G., Ezzyat, Y., Solomon, E. A., Gross, R. E., Jobst, B. C., Sheth, S. A., Zaghloul, K. A., Worrell, G. A., et al. (2019) · Network Neuroscience · doi:10.1162/netn_a_00089 · Cited by 62
Self-citationSrivastava, P., Nozari, E., Kim, J. Z., Ju, H., Zhou, D., Becker, C. O., Pasqualetti, F., Pappas, G. J., & Bassett, D. S. (2020) · Network Neuroscience · doi:10.1162/netn_a_00158 · Cited by 65
Self-citationEmerging Frontiers of Neuroengineering: A Network Science of Brain Connectivity
Bassett, D. S., Khambhati, A. N., & Grafton, S. T. (2017) · Annual Review of Biomedical Engineering · doi:10.1146/annurev-bioeng-071516-044511 · Cited by 61
Self-citationA network engineering perspective on probing and perturbing cognition with neurofeedback
Bassett, D. S., & Khambhati, A. N. (2017) · Annals of the New York Academy of Sciences · doi:10.1111/nyas.13338 · Cited by 64
Self-citationThe energy landscape underpinning module dynamics in the human brain connectome
Ashourvan, A., Gu, S., Mattar, M. G., Vettel, J. M., & Bassett, D. S. (2017) · NeuroImage · doi:10.1016/j.neuroimage.2017.05.067 · Cited by 59
Self-citationLarivière, S., de Wael, R. V., Paquola, C., Hong, S., Mišić, B., Bernasconi, N., Bernasconi, A., Bonilha, L., & Bernhardt, B. C. (2018) · Brain Connectivity · doi:10.1089/brain.2018.0587 · Cited by 51
Medaglia, J. D., Harvey, D. Y., White, N. C., Kelkar, A. S., Zimmerman, J. P., Bassett, D. S., & Hamilton, R. H. (2018) · Journal of Neuroscience · doi:10.1523/jneurosci.0092-17.2018 · Cited by 51
Self-citationLuppi, A. I., Singleton, S. P., Hansen, J. Y., Jamison, K. W., Bzdok, D., Kuceyeski, A. F., Betzel, R. F., & Mišić, B. (2024) · Nature Biomedical Engineering · doi:10.1038/s41551-024-01242-2 · Cited by 61
Self-citationDeng, S., Li, J., Yeo, B. T. T., & Gu, S. (2022) · Communications Biology · doi:10.1038/s42003-022-03196-0 · Cited by 49
Self-citationA network control theory pipeline for studying the dynamics of the structural connectome
Parkes, L., Kim, J. Z., Stiso, J., Brynildsen, J. K., Cieslak, M., Covitz, S. C., Gur, R. E., Gur, R. C., Pasqualetti, F., Shinohara, R. T., et al. (2024) · Nature Protocols · doi:10.1038/s41596-024-01023-w · Cited by 54
Self-citationBeyond modularity: Fine-scale mechanisms and rules for brain network reconfiguration
Khambhati, A. N., Mattar, M. G., Wymbs, N. F., Grafton, S. T., & Bassett, D. S. (2017) · NeuroImage · doi:10.1016/j.neuroimage.2017.11.015 · Cited by 46
Self-citationReduced emergent character of neural dynamics in patients with a disrupted connectome
Luppi, A. I., Mediano, P. A. M., Rosas, F. E., Allanson, J. E., Pickard, J. D., Williams, G. B., Craig, M. M., Finoia, P., Peattie, A. R. D., Coppola, P., et al. (2023) · NeuroImage · doi:10.1016/j.neuroimage.2023.119926 · Cited by 41
Transition and Dynamic Reconfiguration of Whole-Brain Network in Major Depressive Disorder
Wang, S., Wen, H., Hu, X., Xie, P., Qiu, S., Qian, Y., Qiu, J., & He, H. (2020) · Molecular Neurobiology · doi:10.1007/s12035-020-01995-2 · Cited by 44
Autaptic Connections Shift Network Excitability and Bursting
Wiles, L., Gu, S., Pasqualetti, F., Parvesse, B., Gabrieli, D., Bassett, D. S., & Meaney, D. F. (2017) · Scientific Reports · doi:10.1038/srep44006 · Cited by 44
Self-citationZhou, D., Kang, Y., Cosme, D., Jovanova, M., He, X., Mahadevan, A. S., Ahn, J., Stanoi, O. A., Brynildsen, J. K., Cooper, N., et al. (2023) · Proceedings of the National Academy of Sciences · doi:10.1073/pnas.2201074119 · Cited by 44
Self-citationZöller, D., Sandini, C., Schaer, M., Eliez, S., Bassett, D. S., & Ville, D. V. D. (2021) · Human Brain Mapping · doi:10.1002/hbm.25358 · Cited by 39
Self-citationGene coexpression patterns predict opiate-induced brain-state transitions
Brynildsen, J. K., Mace, K. D., Cornblath, E. J., Weidler, C., Pasqualetti, F., Bassett, D. S., & Blendy, J. A. (2020) · Proceedings of the National Academy of Sciences · doi:10.1073/pnas.2003601117 · Cited by 33
Self-citationLanguage Recovery after Brain Injury: A Structural Network Control Theory Study
Wilmskoetter, J., He, X., Caciagli, L., Jensen, J. H., Marebwa, B., Davis, K. A., Fridriksson, J., Basilakos, A., Johnson, L. P., Rorden, C., et al. (2021) · Journal of Neuroscience · doi:10.1523/jneurosci.1096-21.2021 · Cited by 35
Self-citationBenchmarking Measures of Network Controllability on Canonical Graph Models
Wu-Yan, E., Betzel, R. F., Tang, E., Gu, S., Pasqualetti, F., & Bassett, D. S. (2018) · Journal of Nonlinear Science · doi:10.1007/s00332-018-9448-z · Cited by 34
Self-citationZarkali, A., Luppi, A. I., Stamatakis, E. A., Reeves, S., McColgan, P., Leyland, L., Lees, A. J., & Weil, R. S. (2022) · Communications Biology · doi:10.1038/s42003-022-03903-x · Cited by 36
Clarifying cognitive control and the controllable connectome
Medaglia, J. D. (2018) · Wiley Interdisciplinary Reviews Cognitive Science · doi:10.1002/wcs.1471 · Cited by 30
Linking brain network reconfiguration and intelligence: Are we there yet?
Girn, M., Mills, C., & Kalina Christoff, A. (2019) · Trends in Neuroscience and Education · doi:10.1016/j.tine.2019.04.001 · Cited by 29
Diminished neural network dynamics after moderate and severe traumatic brain injury
Gilbert, N., Bernier, R. A., Calhoun, V. D., Brenner, E. K., Grossner, E. C., Rajtmajer, S. M., & Hillary, F. G. (2018) · PLoS ONE · doi:10.1371/journal.pone.0197419 · Cited by 29
Linear Dynamics and Control of Brain Networks
Kim, J. Z., & Bassett, D. S. (2020) · Springer eBooks · doi:10.1007/978-3-030-43395-6_17 · Cited by 31
Self-citationData-Driven Approaches to Neuroimaging Analysis to Enhance Psychiatric Diagnosis and Therapy
Zhang, X., Braun, U., Tost, H., & Bassett, D. S. (2020) · Biological Psychiatry Cognitive Neuroscience and Neuroimaging · doi:10.1016/j.bpsc.2019.12.015 · Cited by 31
Self-citationThe controllosphere: The neural origin of cognitive effort.
Holroyd, C. B. (2024) · Psychological Review · doi:10.1037/rev0000467 · Cited by 33
Mind control as a guide for the mind
Medaglia, J. D., Zurn, P., Sinnott-Armstrong, W. P., & Bassett, D. S. (2017) · Nature Human Behaviour · doi:10.1038/s41562-017-0119 · Cited by 27
Self-citationBush, K., Privratsky, A. A., Gardner, J., Zielinski, M. J., & Kilts, C. D. (2018) · Scientific Reports · doi:10.1038/s41598-018-33621-6 · Cited by 26
Reconfiguration of Brain Network Dynamics in Autism Spectrum Disorder Based on Hidden Markov Model
Lin, P., Zang, S., Bai, Y., & Wang, H. (2022) · Frontiers in Human Neuroscience · doi:10.3389/fnhum.2022.774921 · Cited by 26
Target Controllability in Multilayer Networks via Minimum-Cost Maximum-Flow Method
Ding, J., Wen, C., Li, G., Tu, P., Ji, D., Zou, Y. Y., & Huang, J. (2020) · IEEE Transactions on Neural Networks and Learning Systems · doi:10.1109/tnnls.2020.2995596 · Cited by 25
Luppi, A. I., Craig, M. M., Coppola, P., Peattie, A. R. D., Finoia, P., Williams, G. B., Allanson, J. E., Pickard, J. D., Menon, D. K., & Stamatakis, E. A. (2021) · NeuroImage Clinical · doi:10.1016/j.nicl.2021.102682 · Cited by 27
Language Tasks and the Network Control Role of the Left Inferior Frontal Gyrus
Medaglia, J. D., Harvey, D. Y., Kelkar, A. S., Zimmerman, J. P., Mass, J. A., Bassett, D. S., & Hamilton, R. H. (2021) · eNeuro · doi:10.1523/eneuro.0382-20.2021 · Cited by 25
Self-citationFormalizing psychological interventions through network control theory
Stocker, J. E., Koppe, G., Reich, H., Heshmati, S., Kittel‐Schneider, S., Hofmann, S. G., Hahn, T., van der Maas, H. L. J., Waldorp, L., & Jamalabadi, H. (2023) · Scientific Reports · doi:10.1038/s41598-023-40648-x · Cited by 24
Modeling brain, symptom, and behavior in the winds of change
Lydon‐Staley, D. M., Cornblath, E. J., Blevins, A. S., & Bassett, D. S. (2020) · Neuropsychopharmacology · doi:10.1038/s41386-020-00805-6 · Cited by 25
Self-citationNetwork controllability of structural connectomes in the neonatal brain
Sun, H., Jiang, R., Dai, W., Dufford, A. J., Noble, S., Spann, M. N., Gu, S., & Scheinost, D. (2023) · Nature Communications · doi:10.1038/s41467-023-41499-w · Cited by 26
Self-citationLiu, C., Belleau, E. L., Dong, D., Sun, X., Xiong, G., Pizzagalli, D. A., Auerbach, R. P., Wang, X., & Yao, S. (2023) · Journal of Affective Disorders · doi:10.1016/j.jad.2023.05.074 · Cited by 22
The control costs of human brain dynamics
Ceballos, E. G., Luppi, A. I., Castrillón, G., Saggar, M., Mišić, B., & Riedl, V. (2024) · Network Neuroscience · doi:10.1162/netn_a_00425 · Cited by 23
Kurtin, D. L., Violante, I. R., Zimmerman, K. A., Leech, R., Hampshire, A., Patel, M. C., Carmichael, D. W., Sharp, D. J., & Li, L. M. (2021) · Brain stimulation · doi:10.1016/j.brs.2021.08.004 · Cited by 25
Development of the brain network control theory and its implications
Wu, Z., Huang, L., Wang, M., & He, X. (2024) · Psychoradiology · doi:10.1093/psyrad/kkae028 · Cited by 22
Graph Theoretic Analysis Reveals Intranasal Oxytocin Induced Network Changes Over Frontal Regions
Zheng, S., Punia, D., Wu, H., & Liu, Q. (2021) · Neuroscience · doi:10.1016/j.neuroscience.2021.01.018 · Cited by 20
RE: Warnings and caveats in brain controllability
Pasqualetti, F., Gu, S., & Bassett, D. S. (2019) · NeuroImage · doi:10.1016/j.neuroimage.2019.05.001 · Cited by 22
Self-citationOptimal Control Costs of Brain State Transitions in Linear Stochastic Systems
Kamiya, S., Kawakita, G., Sasai, S., Kitazono, J., & Oizumi, M. (2022) · Journal of Neuroscience · doi:10.1523/jneurosci.1053-22.2022 · Cited by 20
Minimum Cost Control of Directed Networks With Selectable Control Inputs
Li, G., Ding, J., Wen, C., & Huang, J. (2018) · IEEE Transactions on Cybernetics · doi:10.1109/tcyb.2018.2868507 · Cited by 20
Bush, K., James, G. A., Privratsky, A. A., Fialkowski, K. P., & Kilts, C. D. (2022) · PLoS ONE · doi:10.1371/journal.pone.0273376 · Cited by 20
The Structured Controllability Radius of Symmetric (Brain) Networks
Menara, T., Katewa, V., Bassett, D. S., & Pasqualetti, F. (2018) · Proceedings of the ... American Control Conference/Proceedings of the American Control Conference · doi:10.23919/acc.2018.8431724 · Cited by 20
Self-citationControl of brain network dynamics across diverse scales of space and time
Tang, E., Ju, H., Baum, G. L., Roalf, D. R., Satterthwaite, T. D., Pasqualetti, F., & Bassett, D. S. (2020) · Physical review. E · doi:10.1103/physreve.101.062301 · Cited by 20
Self-citationKey Nodes Selection in Controlling Complex Networks via Convex Optimization
Ding, J., Wen, C., Li, G., & Chen, Z. (2019) · IEEE Transactions on Cybernetics · doi:10.1109/tcyb.2018.2888953 · Cited by 18
Network Controllability Robustness Learning via Spatial Graph Neural Networks
Zhang, Y., Ding, J., & Li, X. (2024) · IEEE Transactions on Network Science and Engineering · doi:10.1109/tnse.2024.3391793 · Cited by 19
Learning in brain-computer interface control evidenced by joint decomposition of brain and behavior
Stiso, J., Corsi, M., Vettel, J. M., Garcia, J. O., Pasqualetti, F., Fallani, F. D. V., Lucas, T. H., & Bassett, D. S. (2020) · Journal of Neural Engineering · doi:10.1088/1741-2552/ab9064 · Cited by 22
Self-citationBraun, U., Harneit, A., Pergola, G., Menara, T., Schaefer, A., Betzel, R. F., Zang, Z., Schweiger, J. I., Schwarz, K., Chen, J., et al. (2019) · bioRxiv (Cold Spring Harbor Laboratory) · doi:10.1101/679670 · Cited by 20
Self-citationRaj, A., Verma, P., & Nagarajan, S. S. (2022) · Frontiers in Neuroscience · doi:10.3389/fnins.2022.959557 · Cited by 15
Zeng, Y., Xiong, B., Gao, H., Liu, C., Chen, C., Wu, J., & Qin, S. (2024) · Proceedings of the National Academy of Sciences · doi:10.1073/pnas.2405850121 · Cited by 16
Using Low-Dimensional Manifolds to Map Relationships Between Dynamic Brain Networks
Bahrami, M., Lyday, R. G., Casanova, R., Burdette, J. H., Simpson, S. L., & Laurienti, P. J. (2019) · Frontiers in Human Neuroscience · doi:10.3389/fnhum.2019.00430 · Cited by 16
Neuronal Degeneration Impairs Rhythms Between Connected Microcircuits
Schumm, S. N., Gabrieli, D. J., & Meaney, D. F. (2020) · Frontiers in Computational Neuroscience · doi:10.3389/fncom.2020.00018 · Cited by 18
Applications of optimal nonlinear control to a whole-brain network of FitzHugh-Nagumo oscillators
Chouzouris, T., Roth, N., Cakan, C., & Obermayer, K. (2021) · Physical review. E · doi:10.1103/physreve.104.024213 · Cited by 15
Alterations in white matter network dynamics in patients with schizophrenia and bipolar disorder
Wang, B., Zhang, S., Yu, X., Niu, Y., Niu, J., Li, D., Zhang, S., Xiang, J., Yan, T., Yang, J., et al. (2022) · Human Brain Mapping · doi:10.1002/hbm.25892 · Cited by 15
Network neuroscience and the connectomics revolution
Betzel, R. F. (2021) · Elsevier eBooks · doi:10.1016/b978-0-12-821861-7.00002-6 · Cited by 18
Self-citationA Computational Network Control Theory Analysis of Depression Symptoms
Kenett, Y. N., Beaty, R. E., & Medaglia, J. D. (2018) · Personality Neuroscience · doi:10.1017/pen.2018.15 · Cited by 15
The missing role of gray matter in studying brain controllability
Jamalabadi, H., Zuberer, A., Kumar, V., Li, M., Alizadeh, S., Amani, A. M., Christian Gaser, B., Esterman, M. S., & Walter, M. (2020) · Network Neuroscience · doi:10.1162/netn_a_00174 · Cited by 14
Controllability Analysis of Functional Brain NetworksPreprint
Deng, S., & Gu, S. (2020) · arXiv (Cornell University) · doi:10.48550/arxiv.2003.08278 · Cited by 17
Self-citationOptimal Control in Soft and Active Matter
Alvarado, J., Teich, E. G., Sivak, D. A., & Bechhoefer, J. (2026) · Annual Review of Condensed Matter Physics · doi:10.1146/annurev-conmatphys-031324-031350 · Cited by 13
Mahadevan, A. S., Cornblath, E. J., Lydon‐Staley, D. M., Zhou, D., Parkes, L., Larsen, B., Adebimpe, A., Kahn, A. E., Gur, R. C., Gur, R. E., et al. (2023) · Molecular Psychiatry · doi:10.1038/s41380-023-02121-z · Cited by 14
Self-citationInformation content of brain states is explained by structural constraints on state energetics
Weninger, L., Srivastava, P., Zhou, D., Kim, J. Z., Cornblath, E. J., Bertolero, M. A., Habel, U., Merhof, D., & Bassett, D. S. (2022) · Physical review. E · doi:10.1103/physreve.106.014401 · Cited by 13
Self-citationLu, J., Wang, Y., Shu, Z., Zhang, X., Wang, J., Cheng, Y., Zhu, Z., Yu, Y., Wu, J., Han, J., et al. (2022) · Journal of Neural Engineering · doi:10.1088/1741-2552/ac861e · Cited by 12
Adaptive Internal Models in Neuroscience
Broucke, M. E. (2022) · Foundations and Trends® in Systems and Control · doi:10.1561/2600000027 · Cited by 13
Sparsity-Inspired Optimal Topology Control of Complex Networks
Ding, J., Wen, C., Li, G., Yang, X., & Hu, T. (2019) · IEEE Transactions on Network Science and Engineering · doi:10.1109/tnse.2019.2954893 · Cited by 13
Stability and dynamics of a spectral graph model of brain oscillations
Verma, P., Nagarajan, S. S., & Raj, A. (2022) · Network Neuroscience · doi:10.1162/netn_a_00263 · Cited by 11
Network structure of cascading neural systems predicts stimulus propagation and recovery
Ju, H., Kim, J. Z., Beggs, J. M., & Bassett, D. S. (2020) · Journal of Neural Engineering · doi:10.1088/1741-2552/abbff1 · Cited by 20
Self-citationUsing network control theory to study the dynamics of the structural connectomePreprint
Parkes, L., Kim, J. Z., Stiso, J., Brynildsen, J. K., Cieslak, M., Covitz, S. C., Gur, R. E., Gur, R. C., Pasqualetti, F., Shinohara, R. T., et al. (2023) · bioRxiv (Cold Spring Harbor Laboratory) · doi:10.1101/2023.08.23.554519 · Cited by 12
Self-citationQuantifying brain state transition cost via Schrödinger Bridge
Kawakita, G., Kamiya, S., Sasai, S., Kitazono, J., & Oizumi, M. (2021) · Network Neuroscience · doi:10.1162/netn_a_00213 · Cited by 12
Janet, R., Smallwood, J., Hutcherson, C. A. C., Plaßmann, H., Mckeown, B., & Tusche, A. (2024) · Proceedings of the National Academy of Sciences · doi:10.1073/pnas.2314224121 · Cited by 11
Reduced resilience of brain state transitions in anti‐ N ‐methyl‐D‐aspartate receptor encephalitis
von Schwanenflug, N., Ramírez-Mahaluf, J. P., Krohn, S., Romanello, A., Heine, J., Prüß, H., Crossley, N. A., & Finke, C. (2022) · European Journal of Neuroscience · doi:10.1111/ejn.15901 · Cited by 12
Metadata
- Authors
- Gu, S., Betzel, R. F., Mattar, M. G., Cieslak, M., Delio, P. R., Grafton, S. T., Pasqualetti, F., & Bassett, D. S.
- Affiliations
- University of Pennsylvania (US)
- Princeton University (US)
- University of California, Santa Barbara (US)
- University of California, Riverside (US)
- Corresponding author
- Bassett, Danielle S.
- ORCID
- Venue
- NeuroImage
- Publisher
- Elsevier BV
- Published
- 2017-03
- Volume
- 148
- Pages
- 305-317
- ISSN
- 1053-8119 (ISSN-L)
- PMC
- PMC5489344
- OpenAlex
- W2963186114
- Cited by
- 183
- References
- 105
- Citations by year
- 2026: 9 · 2025: 19 · 2024: 20 · 2023: 19 · 2022: 22 · 2021: 19 · 2020: 23 · 2019: 16 · 2018: 21 · 2017: 13
- FWCI
- 11.46
- Type
- journal article
- Language
- en
- Open access
- hybrid
- doi.org
- Licence
- Locations
- NeuroImage (publishedVersion, cc-by-nc-nd)
- PubMed (publishedVersion)
- Europe PMC (PubMed Central) (acceptedVersion, other-oa)
- PubMed Central (acceptedVersion, cc-by-nc-nd)
- arXiv (Cornell University) (submittedVersion)
- arXiv (Cornell University)
- Funders
- National Science Foundation (W911NF-10-2-0022, 1430280, 1R01HD086888-01, 1554488, 1430087, CAREER, 2-R01-DC-009209-11, 1441502, W911NF-14-1-0679)
- John D. and Catherine T. MacArthur Foundation (W911NF-10-2-0022, W911NF-14-1-0679, 2-R01-DC-009209-11, 1R01HD086888-01, BCS-1441502, PHY-1554488)
- Alfred P. Sloan Foundation (W911NF-10-2-0022, W911NF-14-1-0679, 2-R01-DC-009209-11, BCS-1441502, PHY-1554488, 1R01HD086888-01)
- National Institutes of Health (5r01ns099348-04, 2r01dc009209-11, 1r01hd086888-01)
- Office of Naval Research (BCS-1441502, PHY-1554488, W911NF-10-2-0022, W911NF-14-1-0679, CAREER PHY-1554488, 1R01HD086888-01, BCS-1430087, 2-R01-DC-009209-11)
- National Institute of Mental Health (2R01‐DC‐009209‐11, R01-DC-009209-11, R21MH106799)
- National Institute on Deafness and Other Communication Disorders (R01-DC009209)
- National Institute of Neurological Disorders and Stroke ((R01 NS099348)
- National Institute of Child Health and Human Development (1R01HD086888-01)
- Eunice Kennedy Shriver National Institute of Child Health and Human Development (R01 HD086888)
- Army Research Office (1R01HD086888-01, PHY-1554488, W911NF-14–1-0679, BCS-1441502, W911NF-14-1, R01-DC-009209-11, W911NF-10-2-0022, W911NF, 2-R01-DC-009209-11)
- Army Research Laboratory (W911-NF-10-2-0022, W911NF-14-1-0679, 1R01HD086888-01, PHY-1554488, W911NF, 2-R01-DC-009209-11, BCS-1441502, W911NF-10)
- Topics
- Life Sciences › Neuroscience › Cognitive Neuroscience › Functional Brain Connectivity Studies
- Life Sciences › Neuroscience › Cognitive Neuroscience › Neural dynamics and brain function
- Health Sciences › Medicine › Radiology, Nuclear Medicine and Imaging › Advanced Neuroimaging Techniques and Applications
- Keywords
- brain state transitions, network control theory, white matter structure, attention, executive function, mild traumatic brain injury, cognitive states, neural dynamics
- MeSH terms
- Brain Injuries, Traumatic, Adult, Algorithms, Attention, Brain, Cerebral Cortex, Cognition, Cognition Disorders, Energy Metabolism, Female, Humans, Male, Psychomotor Performance, Diffusion Magnetic Resonance Imaging, Young Adult, Executive Function, Healthy Volunteers, White Matter
About these checks
Registry, retraction, Cites and statistics results are computed, not judged, with one exception: a printed reference that no index lists is read once by a model before it counts as a citation error. Claims are extracted by a model and kept only when their quote appears verbatim in the text; each cited source is then checked, with a model’s help, for whether it says what the claim relies on. Those verdicts can be wrong — read the claim’s quote and the cited source before relying on one.
Statistics and arithmetic are recomputed, not judged.
Confidence bands are shown only for fields calibrated on our annotated test set. None is calibrated yet, so no band is shown.
What counts as a claim ›How we measure confidence ›How we check this ›
Are you an author, or do you see a problem with this page? Request a review
