

The DOI matches its Crossref record; 83 of the 86 references it cites were found in a registry or an index.
Atypical recruitment of medial prefrontal cortex in autism spectrum disorders: An fMRI study of two executive function tasks
Open accessAbstract
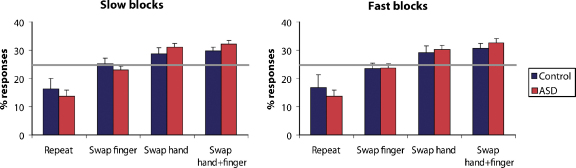
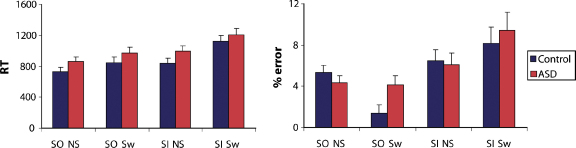
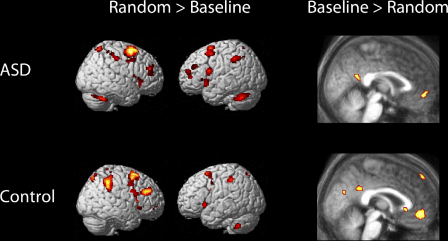
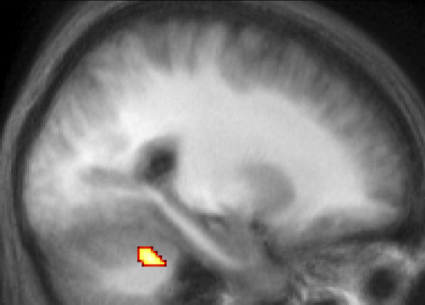
Recent studies have suggested an uneven profile of executive dysfunction in autism spectrum disorders (ASD). For example, some authors have reported deficits on newly developed tests of executive function sensitive to rostral prefrontal function, despite spared, or even superior, performance on other tests. We investigated the performance of a group of high-functioning participants with ASD (N=15) and an age- and IQ-matched control group (N=18) on two executive function tests, whilst undergoing functional magnetic resonance imaging (fMRI). Behaviourally, there were no significant differences between the two groups. In a classical test of executive function (random response generation), BOLD signal differed between the groups in the cerebellum but not in the frontal lobes. However, on a new test of executive function (selection between stimulus-oriented and stimulus-independent thought), the ASD group exhibited significantly greater signal-change in medial rostral prefrontal cortex (especially Brodmann Area 10) in the comparison of stimulus-oriented versus stimulus-independent attention. In addition, the new test (but not the classical test) provided evidence for abnormal functional organisation of medial prefrontal cortex in ASD. These results underline the heterogeneity of different tests of executive function, and suggest that executive functioning in ASD is associated with task-specific functional change.
Overview
The claims and statistics of this paper haven’t been checked yet.
Run the check — free, no account needed. It reads the open-access text and checks the sources it cites.
Integrity signals
Registry
Cites
Statistics
Figures
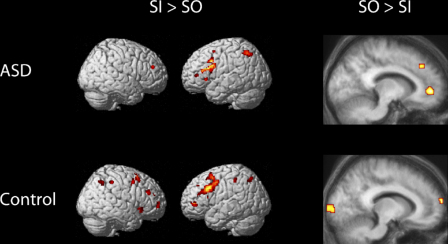
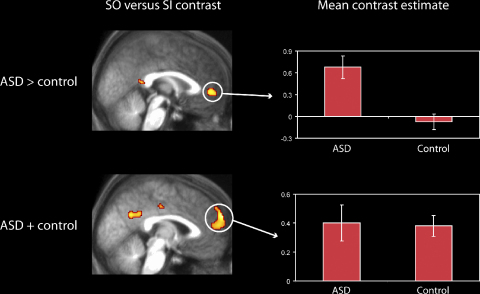
Verification
Claims the paper makes
The claims and statistics of this paper haven’t been checked yet.
Run the check — free, no account needed. It reads the open-access text and checks the sources it cites.
Claims other papers make about this one
Each is checked against this paper’s own text: does it say what the citing paper says it does?
The source backs part of the claim, not all of it — or backs it for a different population, condition or comparison.
In the citing paper
“disruptions in cerebellar–mPFC connectivity have been demonstrated in ASD20.”
From Regulation of autism-relevant behaviors by cerebellar-prefrontal cortical circuits (2020) · cites this paper as [20]
Experimental — accuracy not yet measured
Self-check
Percentages, sums and reported differences re-computed from the paper’s own numbers.
The self-check needs the paper’s full text.
Citations
Cites
Studies of interference in serial verbal reactions
Stroop, J. R. (1935) · Journal of Experimental Psychology · doi:10.1037/h0054651 · Cited by 18,622
Miyake, A., Friedman, N. P., Emerson, M. J., Witzki, A. H., Howerter, A., & Wager, T. D. (2000) · Cognitive Psychology · doi:10.1006/cogp.1999.0734 · Cited by 15,798
Statistical parametric maps in functional imaging: A general linear approach
Friston, K. J., Holmes, A. P., Worsley, K. J., Poline, J. ‐., Frith, C. D., & Frackowiak, R. S. J. (1994) · Human Brain Mapping · doi:10.1002/hbm.460020402 · Cited by 9,688
Self-citationLord, C., Rutter, M., & Le Couteur, A. (1994) · Journal of Autism and Developmental Disorders · doi:10.1007/bf02172145 · Cited by 9,065
Does the autistic child have a “theory of mind” ?
Baron-Cohen, S., Leslie, A. M., & Frith, U. (1985) · Cognition · doi:10.1016/0010-0277(85)90022-8 · Cited by 8,599
Lord, C., Risi, S., Lambrecht, L., Cook, E. H., Leventhal, B. L., DiLavore, P. C., Pickles, A., & Rutter, M. (2000) · Journal of Autism and Developmental Disorders · doi:10.1023/a:1005592401947 · Cited by 7,520
From Neuropsychology to Mental Structure
Shallice, T. (1988) · doi:10.1017/cbo9780511526817 · Cited by 4,072
Specific impairments of planning
Shallice, T. (1982) · Philosophical Transactions of the Royal Society of London. B, Biological Sciences · doi:10.1098/rstb.1982.0082 · Cited by 3,741
Wechsler Adult Intelligence Scale-III
Ryan, J. J., & Lopez, S. J. (2001) · Springer eBooks · doi:10.1007/978-1-4615-1185-4_2 · Cited by 3,680
Frith, C., & Frith, U. (2005) · Current Biology · doi:10.1016/j.cub.2005.08.041 · Cited by 3,561
Self-citation
Cited by
Sorted by citations
Items 101–158 of 158
Social and Nonsocial Functions of Rostral Prefrontal Cortex: Implications for Education
Gilbert, S. J., & Burgess, P. W. (2008) · Mind Brain and Education · doi:10.1111/j.1751-228x.2008.00046.x · Cited by 9
Self-citationKrishnamurthy, K., Chan, M. M. Y., & Han, Y. M. Y. (2022) · Scientific Reports · doi:10.1038/s41598-022-25051-2 · Cited by 8
Multimodal Morphometric Similarity Network Analysis of Autism Spectrum Disorder
CASALE, A. D., Shehu, D., Rossi‐Espagnet, M. C., Zocchi, C., Bilotta, I., Arena, J. F., Alcibiade, A., Adriani, B., Longo, D., Gandolfo, C., et al. (2025) · Brain Sciences · doi:10.3390/brainsci15030247 · Cited by 7
Bayesian Network Structure and Predictability of Autistic Traits
Briganti, G., Williams, D. R., Mulder, J., & Linkowski, P. (2020) · Psychological Reports · doi:10.1177/0033294120978159 · Cited by 6
A CAD system for early diagnosis of autism using different imaging modalities.
Ismail, M. (2016) · doi:10.18297/etd/2599 · Cited by 7
Barreto, C., Curtin, A., Topoglu, Y., Day‐Watkins, J., Garvin, B., Foster, G., Ormanoglu, Z., Sheridan, E., Connell, J. E., Bennett, D. S., et al. (2024) · Brain Sciences · doi:10.3390/brainsci14050503 · Cited by 8
Infant quantitative risk for autism spectrum disorder predicts executive function in early childhood
Stephens, R. L., Watson, L. R., Crais, E. R., & Reznick, J. S. (2018) · Autism Research · doi:10.1002/aur.2024 · Cited by 6
Thaut, M. H., & Janzen, T. B. (2019) · Autism and child psychopathology series · doi:10.1007/978-3-030-13027-5_20 · Cited by 8
Connective differences between patients with depression with and without ASD: A case-control study
Kaneko, T., Nakamura, T., Ryokawa, A., Washizuka, S., Kitoh, Y., & Fujinaga, Y. (2023) · PLoS ONE · doi:10.1371/journal.pone.0289735 · Cited by 5
Early autism diagnosis based on path signature and Siamese unsupervised feature compressor
Yin, Z., Ding, X., Zhang, X., Wu, Z., Wang, L., Xu, X., & Li, G. (2024) · Cerebral Cortex · doi:10.1093/cercor/bhae069 · Cited by 8
He, Y., Liu, J., Xiao, H., & Xiao, L. (2024) · Brain Research · doi:10.1016/j.brainres.2024.149136 · Cited by 5
la Torre, G. G. D., Barroso, J. M., León‐Carrión, J., Navas, J. M. M., & Bozal, R. G. (2012) · Journal of Attention Disorders · doi:10.1177/1087054712466440 · Cited by 6
Executive Functions in Autism Spectrum Disorder
McCrimmon, A. W., Matchullis, R. L., Altomare, A. A., & Smith-Demers, A. D. (2016) · Autism and child psychopathology series · doi:10.1007/978-3-319-27171-2_21 · Cited by 5
Anderson, J. S., Ferguson, M. A., & Nielsen, J. A. (2013) · Springer eBooks · doi:10.1007/978-1-4614-6843-1_10 · Cited by 4
ASD: Psychopharmacologic Treatments and Neurophysiologic Underpinnings
Kodish, I. M., Rockhill, C., & Webb, S. J. (2014) · Current topics in behavioral neurosciences · doi:10.1007/7854_2014_298 · Cited by 4
Turner, J., Byrge, L. A., Richardson, H., Galdi, P., Kennedy, D. P., & Kliemann, D. (2025) · Molecular Autism · doi:10.1186/s13229-025-00669-x · Cited by 4
Wilson, G. N., & Tonk, V. S. (2018) · Open Journal of Psychiatry · doi:10.4236/ojpsych.2018.83023 · Cited by 3
Wang, J., Liu, X., Wang, X., Hu, Y., Zeng, Q., Lin, Z., Xiong, N., & Feng, Y. (2022) · NMR in Biomedicine · doi:10.1002/nbm.4756 · Cited by 3
Episodische Gedächtnisleistungen bei Patienten mit Autismus-Spektrum-Störungen
Nehrkorn, B., Konrad, K., Fink, G. R., & Herpertz‐Dahlmann, B. (2010) · Kindheit und Entwicklung · doi:10.1026/0942-5403/a000020 · Cited by 3
Bernier, R., & Dawson, G. (2016) · Wiley eBooks · doi:10.1002/9781119125556.devpsy303 · Cited by 4
Michon, K. J., Zhou, Q., Osborne, J. B., Beltz, A. M., Jonides, J. J., Simmonite, M., & Polk, T. A. (2025) · Imaging Neuroscience · doi:10.1162/imag.a.995 · Cited by 2
Early postnatal dysfunction of ACC PV interneurons in Shank3B−/− mice
Shih, Y.-C., Nelson, L., Janeček, M., Matarazzo, M., D’Agostino, A., & Peixoto, R. T. (2025) · Molecular Psychiatry · doi:10.1038/s41380-025-03114-w · Cited by 2
Decoding the Neural Basis of Sensory Phenotypes in Autism
Kolisnyk, M., Lyons, K., Choi, E. J., Vandewouw, M. M., Stojanoski, B. B., Anagnostou, E. A., Kushki, A., Nicolson, R., Kelley, E. A., Georgiades, S., et al. (2026) · Biological Psychiatry Cognitive Neuroscience and Neuroimaging · doi:10.1016/j.bpsc.2025.12.013 · Cited by 2
Exploring individual differences in deductive reasoning as a function of 'autistic'-like traits
Fugard, A. J. B. (2009) · ERA · Cited by 2
Assessing and Intervening with Children with Executive Function Disorders
Johnson, W. L. B., & Maricle, D. E. (2022) · Wiley eBooks · doi:10.1002/9781119790563.ch31 · Cited by 2
Batouli, S. A. H., Razavi, F., Sisakhti, M., Oghabian, Z., Ahmadzade, H., & Doost, M. T. (2021) · Basic and Clinical Neuroscience Journal · doi:10.32598/bcn.2021.1774.3 · Cited by 1
Eskandari, E., Jansari, A. S., & Bagheri, M. (2023) · Neuropsychological Rehabilitation · doi:10.1080/09602011.2023.2236351 · Cited by 2
Optimizing functional connectivity scanning conditions for predicting autistic traits
Horien, C. L., Mandino, F., Greene, A. S., Shen, X., Powell, K. K., Vernetti, A., O'Connor, D., Adkinson, B. D., Tejavibulya, L., McPartland, J. C., et al. (2026) · Nature Mental Health · doi:10.1038/s44220-026-00623-7 · Cited by 2
Clinical Evaluations on the Diagnosis of Autism
Dobre, M., & Stoic, I. (2011) · InTech eBooks · doi:10.5772/17912 · Cited by 1
Representing Human Cultural and Biological Diversity in Neuropsychiatry: Why and How
Crafa, D., & Nagel, S. K. (2016) · International Congress of the International Association for Cross-Cultural Psychology (IACCP) · doi:10.4087/qxuw6466 · Cited by 1
Courty, A. (2013) · theses.fr (ABES) · doi:10.70675/7437d082z8fe6z4ea9zbbe4z4957b20c8817 · Cited by 1
Common and distinct neural networks for theory of mind reasoning and inhibitory control
Rothmayr, C. (2009) · Electronic Theses of LMU Munich (Ludwig-Maximilians-Universität München) · doi:10.5282/edoc.12497 · Cited by 1
Autism spectrum disorders in high functioning adolescents
Barendse (2017) · Research Publications (Maastricht University) · doi:10.26481/dis.20170907eb · Cited by 1
Raza, S. (2015) · Open ULeth Scholarship (OPUS) (University of Lethbridge) · Cited by 1
Shih, Y.-C., Nelson, L., Janeček, M., & Peixoto, R. T. (2023) · bioRxiv (Cold Spring Harbor Laboratory) · doi:10.1101/2023.11.23.568500 · Cited by 3
The Neurodevelopment Of Basic Sensory Processing And Integration In Autism Spectrum Disorder
Brandwein, A. B. (2014) · CUNY Academic Works (City University of New York)
Lifespan aspects of PDD/autism spectrum disorders (ASD)
Wolf, J. M., & Paterson, S. (2010) · Cambridge University Press eBooks · doi:10.1017/cbo9780511674815.019
THE EFFECT OF CLASSROOM SEATING ARRANGEMENT ON THE SOCIAL COMPETENCY OF AUTISTIC PRESCHOOLERS
del, A. (2010) · eCommons (Cornell University)
The cerebellum and divided attention in autism spectrum disorders
Hsu, J. Y. (2014) · Texas ScholarWorks (Texas Digital Library)
Stephens, R. L. (2019) · Carolina Digital Repository (University of North Carolina at Chapel Hill) · doi:10.17615/5y88-3g37
Mak‐Fan, K. M. (2012) · TSpace (University of Toronto)
The Influence of Talker Expectations and Acoustic Variability on Speech Perception in ASD
Hogstrom, A. (2017) · OpenCommons at University of Connecticut (University of Connecticut)
Venkataraman, A. (2018) · Elsevier eBooks · doi:10.1016/b978-0-12-813838-0.00001-7 · Cited by 1
Το αυτιστικό φάσμα υπό το πρίσμα της γνωστικής ψυχολογίας: Επισκόπηση της σύγχρονης βιβλιογραφίας
Κωστάκη, Δ. Σ. (2020) · Psychology the Journal of the Hellenic Psychological Society · doi:10.12681/psy_hps.23756
Chatzopoulos, G., Dinou, M., & Proios, H. (2021) · Journal of Educational and Developmental Psychology · doi:10.5539/jedp.v11n1p37
(2015) · Dunod eBooks · doi:10.3917/dunod.rogee.2015.01.0227
Current Awareness in NMR in Biomedicine
(2009) · NMR in Biomedicine · doi:10.1002/nbm.1330
Cerebellar Abnormalities in Autism
Hardan, A. Y., & Jou, R. J. (2013) · Springer eBooks · doi:10.1007/978-1-4419-1698-3_663
Bayesian network structure and predictability of autistic traitsPreprint
Briganti, G., Williams, D. R., Mulder, J., & Linkowski, P. (2020) · PsyArXiv (OSF Preprints) · doi:10.31234/osf.io/83epj · Cited by 1
Cerebellar Abnormalities in Autism
Hardan, A. Y., & Jou, R. J. (2021) · Springer eBooks · doi:10.1007/978-3-319-91280-6_663
Hawrot, A., & Filipiak, S. (2022) · Journal of Educational Sciences & Psychology · doi:10.51865/jesp.2022.1.12
A model to analyze age-related differences in human-generated head-tail sequencesPreprint
Baena-Mirabete, S., García-Viedma, M. D. R., Fernández‐Guinea, S., & Puig, P. (2023) · bioRxiv (Cold Spring Harbor Laboratory) · doi:10.1101/2023.08.07.552223
التغيرات النمائية لبعض الوظائف التنفيذية في مرحلتي الطفولة والمراهقة لدى عينة من ذوي اضطراب التوحد
اسحق, م. (2023) · مجلة الدراسات النفسیة المعاصرة جامعة بنى سویف · doi:10.21608/bshjo.2023.215926.1047
العطار, م. م., & شوقي, م. (2024) · مجلة كلية التربية جامعة بنها · doi:10.21608/jfeb.2024.278196.1870
Youngkin, A. E., Snetkov, G., Grady, C., Puglia, M. H., Frazier, K. F., Pelphrey, K. A., Fairchild, K. D., Goodkin, H. P., & Evans, T. M. (2025) · bioRxiv (Cold Spring Harbor Laboratory) · doi:10.1101/2025.06.24.661281 · Cited by 1
McCrimmon, A. W., Makarenko, E. M., Bernier, A. S., Dickner, S., & Waller, M. (2026) · Autism and child psychopathology series · doi:10.1007/978-3-032-11802-8_10
Metadata
- Authors
- Gilbert, S. J., Bird, G., Brindley, R., Frith, C. D., & Burgess, P. W.
- Affiliations
- University College London (GB)
- Corresponding author
- Gilbert, Sam J.
- Venue
- Neuropsychologia
- Publisher
- Elsevier BV
- Published
- 2008-07
- Volume
- 46
- Issue
- 9
- Pages
- 2281-2291
- ISSN
- 0028-3932 (ISSN-L)
- PMC
- PMC2648877
- OpenAlex
- W2101777433
- Cited by
- 158
- References
- 86
- Citations by year
- 2026: 3 · 2025: 7 · 2024: 5 · 2023: 10 · 2022: 10 · 2021: 6 · 2020: 12 · 2019: 6 · 2018: 6 · 2017: 7 · 2016: 8 · 2015: 5 · 2014: 11 · 2013: 17 · 2012: 8
- FWCI
- 6.03
- Type
- journal article
- Language
- en
- Open access
- hybrid
- doi.org
- Licence
- Locations
- Neuropsychologia (publishedVersion, cc-by)
- Europe PMC (PubMed Central) (publishedVersion, cc-by)
- PubMed Central (publishedVersion, cc-by)
- PubMed (publishedVersion)
- UCL Discovery (University College London) (submittedVersion)
- Research Portal (King's College London) (submittedVersion)
- Funders
- Wellcome Trust (061171)
- Topics
- Life Sciences › Neuroscience › Cognitive Neuroscience › Autism Spectrum Disorder Research
- Life Sciences › Neuroscience › Cognitive Neuroscience › Neural and Behavioral Psychology Studies
- Life Sciences › Biochemistry, Genetics and Molecular Biology › Genetics › Genetics and Neurodevelopmental Disorders
- Keywords
- autism spectrum disorder, executive function, medial prefrontal cortex, Brodmann area 10, cerebellum, high-functioning autism
- MeSH terms
- Adult, Autistic Disorder, Brain, Cognition, Female, Humans, Image Processing, Computer-Assisted, Magnetic Resonance Imaging, Male, Mental Processes, Middle Aged, Neuropsychological Tests, Parietal Lobe, Psychomotor Performance, Reaction Time, Recruitment, Neurophysiological, Task Performance and Analysis, Prefrontal Cortex
About these checks
Registry, retraction, Cites and statistics results are computed, not judged, with one exception: a printed reference that no index lists is read once by a model before it counts as a citation error. Claims are extracted by a model and kept only when their quote appears verbatim in the text; each cited source is then checked, with a model’s help, for whether it says what the claim relies on. Those verdicts can be wrong — read the claim’s quote and the cited source before relying on one.
Statistics and arithmetic are recomputed, not judged.
Confidence bands are shown only for fields calibrated on our annotated test set. None is calibrated yet, so no band is shown.
What counts as a claim ›How we measure confidence ›How we check this ›
Are you an author, or do you see a problem with this page? Request a review
