

The DOI matches its Crossref record; 37 of the 37 references it cites were found in a registry or an index.
Abnormal blood–brain barrier permeability in normal appearing white matter in multiple sclerosis investigated by MRI
Open accessAbstract
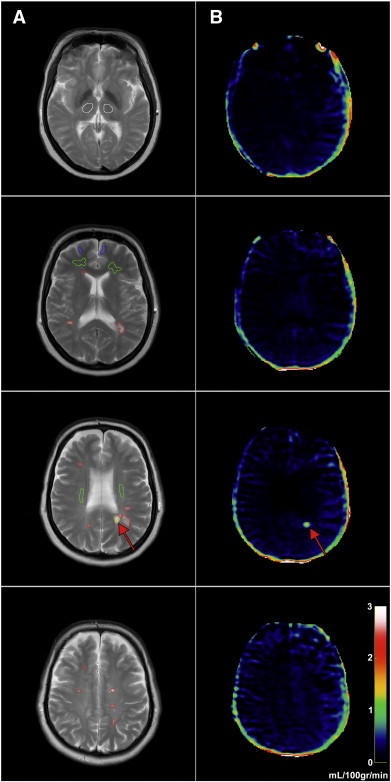
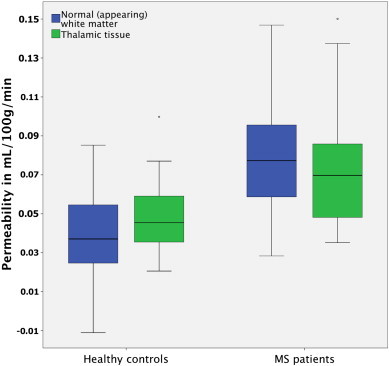
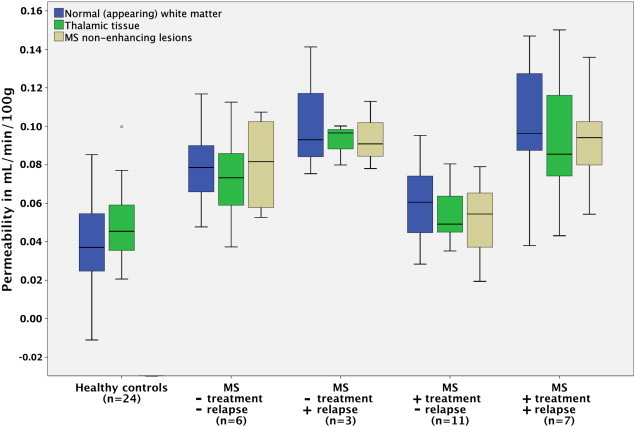
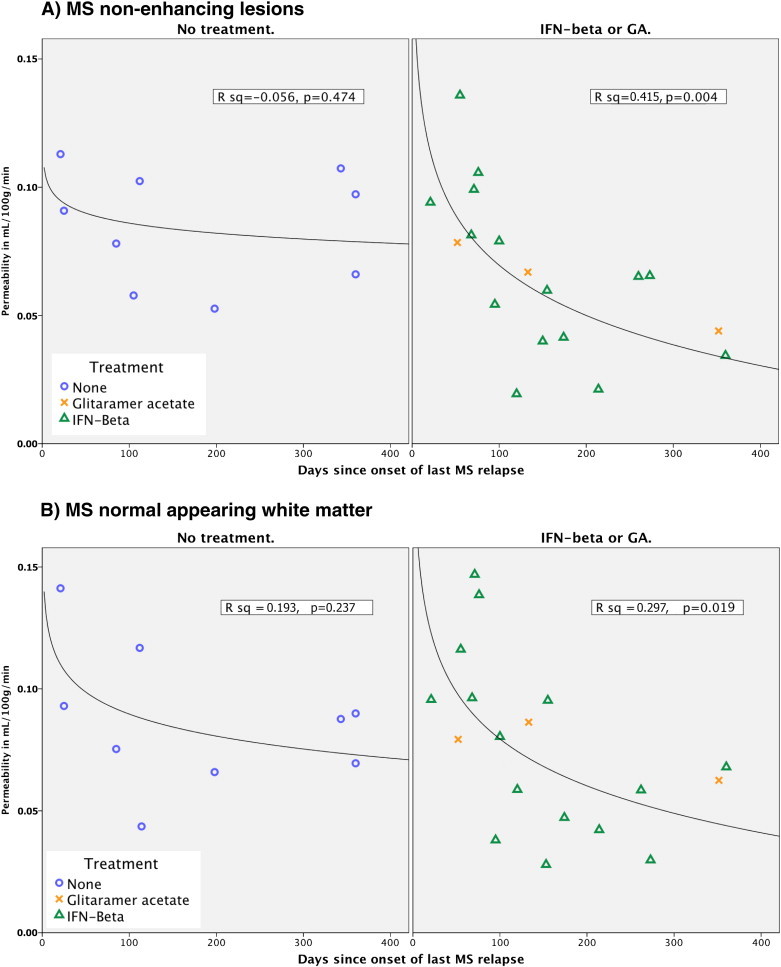
OBJECTIVES: To investigate whether blood-brain barrier (BBB) permeability is disrupted in normal appearing white matter in MS patients, when compared to healthy controls and whether it is correlated with MS clinical characteristics. METHODS: Dynamic contrast-enhanced MRI was used to measure BBB permeability in 27 patients with MS and compared to 24 matched healthy controls. RESULTS: Permeability measured as K(trans) was significantly higher in periventricular normal appearing white matter (NAWM) and thalamic gray matter in MS patients when compared to healthy controls, with periventricular NAWM showing the most pronounced difference. Recent relapse coincided with significantly higher permeability in periventricular NAWM, thalamic gray matter, and MS lesions. Immunomodulatory treatment and recent relapse were significant predictors of permeability in MS lesions and periventricular NAWM. Our results suggest that after an MS relapse permeability gradually decreases, possibly an effect of immunomodulatory treatment. CONCLUSIONS: Our results emphasize the importance of BBB pathology in MS, which we find to be most prominent in the periventricular NAWM, an area prone to development of MS lesions. Both the facts that recent relapse appears to cause widespread BBB disruption and that immunomodulatory treatment seems to attenuate this effect indicate that BBB permeability is intricately linked to the presence of MS relapse activity. This may reveal further insights into the pathophysiology of MS.
Overview
The claims and statistics of this paper haven’t been checked yet.
Run the check — free, no account needed. It reads the open-access text and checks the sources it cites.
Integrity signals
Registry
Cites
Statistics
Figures
Verification
Claims the paper makes
The claims and statistics of this paper haven’t been checked yet.
Run the check — free, no account needed. It reads the open-access text and checks the sources it cites.
Claims other papers make about this one
Each is checked against this paper’s own text: does it say what the citing paper says it does?
The source backs part of the claim, not all of it — or backs it for a different population, condition or comparison.
In the citing paper
“More recently, an increase in BBB permeability has been shown in MS patients by DCE-MRI in the cortex and adjacent white matter (392), corpus callosum and internal capsule (121-123, 421, 574), as well as thalamic gray matter (123).”
From Blood-Brain Barrier: From Physiology to Disease and Back (2019) · cites this paper as [123]
Experimental — accuracy not yet measured
Self-check
Percentages, sums and reported differences re-computed from the paper’s own numbers.
The self-check needs the paper’s full text.
Citations
Cites
Schumacher, G. A., Beebe, G., Kibler, R. F., Kurland, L. T., Kurtzke, J. F., McDowell, F., Nagler, B., Sibley, W. A., Tourtellotte, W. W., & Willmon, T. L. (1965) · Annals of the New York Academy of Sciences · doi:10.1111/j.1749-6632.1965.tb20235.x · Cited by 1,438 · cited 1×
“Relapsewasdefined as new or worsening symptoms that lasted 24 h and occurred in the absence of fever or infection (Schumacher et al., 1965).”
BackgroundProgressive multiple sclerosis: pathology and pathogenesis
Lassmann, H., van Horssen, J., & Mahad, D. (2012) · Nature Reviews Neurology · doi:10.1038/nrneurol.2012.168 · Cited by 1,033 · cited 5×
“…did not include secondary progressive MS patients, where the relationship between inflammation and damage to the BBB is less obvious than in RRMS (Lassmann et al., 2012), secondly, our cohorts were all evaluated for treatment intensification, thus presumably having a high relative disease…”
BackgroundInfluentialBlood-brain barrier disruption in multiple sclerosis
Minagar, A., & Alexander, J. S. (2003) · Multiple Sclerosis · doi:10.1191/1352458503ms965oa · Cited by 685 · cited 2×
“However, the MS disease process itself seems capable of modifying the permeability of the BBB (Larochelle et al., 2011; Minagar and Alexander, 2003) but we observed no correlation between permeability and age, EDSS or years sinceMS onset indicating that BBB abnormalities do not seem toworsen with disease progression.”
BackgroundKERMODE, A. G., THOMPSON, A. J., TOFTS, P., MACMANUS, D. G., KENDALL, B. E., KINGSLEY, D. P. E., MOSELEY, I. F., RUDGE, P., & MCDONALD, W. I. (1990) · Brain · doi:10.1093/brain/113.5.1477 · Cited by 578 · cited 1×
“All rights reser inactive MS lesions as well as normal appearing white matter (NAWM) (Kirk et al., 2003; McQuaid et al., 2009; Plumb et al., 2002; Vos et al., 2005), and serial MRI studies have indicated that structural changes (Filippi et al., 1998; Werring, 2000) and BBB dysfunction (Goodkin et…”
BackgroundHow do immune cells overcome the blood-brain barrier in multiple sclerosis?
Larochelle, C., Alvarez, J. I., & Prat, A. (2011) · FEBS Letters · doi:10.1016/j.febslet.2011.04.066 · Cited by 405 · cited 3×
“On the other hand, activated leukocytes themselves are capable of altering BBB permeability through expression and secretion of inflammatory cytokines (Larochelle et al., 2011).”
BackgroundFilippi, M., Rocca, M. A., Martino, G., Horsfield, M. A., & Comi, G. (1998) · Annals of Neurology · doi:10.1002/ana.410430616 · Cited by 395 · cited 2×
“…white matter (NAWM) (Kirk et al., 2003; McQuaid et al., 2009; Plumb et al., 2002; Vos et al., 2005), and serial MRI studies have indicated that structural changes (Filippi et al., 1998; Werring, 2000) and BBB dysfunction (Goodkin et al., 1998) may precedemyelin damage and leukocyte infiltration.”
BackgroundKirk, J., Plumb, J., Mirakhur, M., & McQuaid, S. (2003) · The Journal of Pathology · doi:10.1002/path.1434 · Cited by 375 · cited 2×
“All rights reser inactive MS lesions as well as normal appearing white matter (NAWM) (Kirk et al., 2003; McQuaid et al., 2009; Plumb et al., 2002; Vos et al., 2005), and serial MRI studies have indicated that structural changes (Filippi et al., 1998; Werring, 2000) and BBB dysfunction (Goodkin et…”
BackgroundHarris, J. O., Frank, J., Patronas, N., Mcfarlin, D. E., & McFarland, H. (1991) · Annals of Neurology · doi:10.1002/ana.410290515 · Cited by 334
Werring, D. J. (2000) · Brain · doi:10.1093/brain/123.8.1667 · Cited by 323 · cited 3×
“…white matter (NAWM) (Kirk et al., 2003; McQuaid et al., 2009; Plumb et al., 2002; Vos et al., 2005), and serial MRI studies have indicated that structural changes (Filippi et al., 1998; Werring, 2000) and BBB dysfunction (Goodkin et al., 1998) may precedemyelin damage and leukocyte infiltration.”
BackgroundEpstein-Barr virus infection is not a characteristic feature of multiple sclerosis brain.
Willis, S., Stadelmann, C., Rodig, S., Caron, T. J., Gattenloehner, S., Mallozzi, S. S., Roughan, J. E., Almendinger, S. E., Blewett, M. M., Brück, W., et al. (2009) · Brain : a journal of neurology · doi:10.1093/brain/awp200 · Cited by 304 · cited 1×
“Only a minority of cells need be infected and express viral genes, which would serve to explain the inconsistent detection of EBV in MS brains (Willis et al., 2009) and CSF (Mancuso et al., 2010).”
BackgroundPlumb, J., McQuaid, S., Mirakhur, M., & Kirk, J. (2002) · Brain Pathology · doi:10.1111/j.1750-3639.2002.tb00430.x · Cited by 274 · cited 2×
“All rights reser inactive MS lesions as well as normal appearing white matter (NAWM) (Kirk et al., 2003; McQuaid et al., 2009; Plumb et al., 2002; Vos et al., 2005), and serial MRI studies have indicated that structural changes (Filippi et al., 1998; Werring, 2000) and BBB dysfunction (Goodkin et…”
BackgroundThe risk of relapses in multiple sclerosis during systemic infections
Correale, J. D., Fiol, M. P., & Gilmore, W. (2006) · Neurology · doi:10.1212/01.wnl.0000233834.09743.3b · Cited by 273 · cited 1×
“On the contrary, evidence indicates that infection with many different pathogens, either bacterial or viral, increases the risk of relapse up to twofold, gives more severe relapses and shows increased lesion activity on MRI (Correale et al., 2006).”
BackgroundLarsson, H., Courivaud, F., Rostrup, E., & Hansen, A. E. (2009) · Magnetic Resonance in Medicine · doi:10.1002/mrm.22136 · Cited by 236 · cited 1×
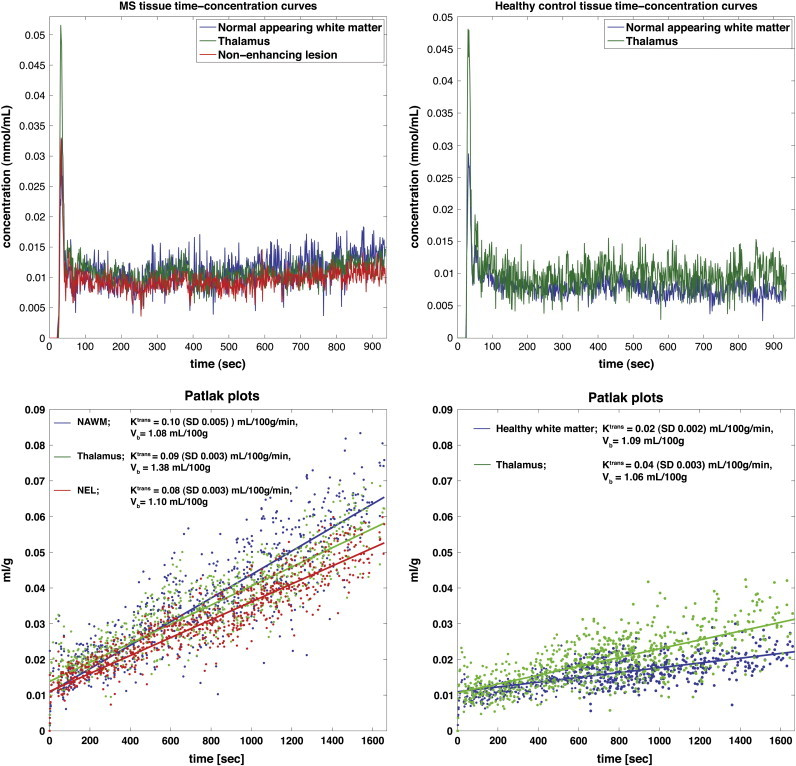
“Tissue concentration–time curves were evaluated using a combination of model free deconvolution and a Patlak model, as described in previous work (Larsson et al., 2009).”
MethodSelf-citationPathogenesis of multiple sclerosis
ffrench‐Constant, C. (1994) · The Lancet · doi:10.1016/s0140-6736(94)91118-5 · Cited by 227
A serial study of new MS lesions and the white matter from which they arise
Goodkin, D. E., Rooney, W. D., Sloan, R., Bacchetti, P., Gee, L., Vermathen, M., Waubant, E. L., Abundo, M. A., Majumdar, S., Nelson, S. J., et al. (1998) · Neurology · doi:10.1212/wnl.51.6.1689 · Cited by 201
de Stefano, N., Narayanan, S., Matthews, P. M., Francis, G., Antel, J. P., & Arnold, D. (1999) · Brain : a journal of neurology · doi:10.1093/brain/122.10.1933 · Cited by 196 · cited 1×
“We are aware of two MRI studies describing a similar phenomenon with structural abnormalities occurring consecutively in MS lesions and in contralateral NAWM (De Stefano, 1999; Werring, 2000).”
BackgroundVos, C. M. P., Geurts, J. J. G., Montagne, L., van Haastert, E. S., Bö, L., van der Valk, P., Barkhof, F., & de Vries, H. E. (2005) · Neurobiology of Disease · doi:10.1016/j.nbd.2005.06.012 · Cited by 188 · cited 2×
“All rights reser inactive MS lesions as well as normal appearing white matter (NAWM) (Kirk et al., 2003; McQuaid et al., 2009; Plumb et al., 2002; Vos et al., 2005), and serial MRI studies have indicated that structural changes (Filippi et al., 1998; Werring, 2000) and BBB dysfunction (Goodkin et…”
BackgroundPakpoor, J., Disanto, G., Gerber, J. E., Dobson, R., Meier, U., Giovannoni, G., & Ramagopalan, S. (2013) · Multiple Sclerosis · doi:10.1177/1352458512449682 · Cited by 179 · cited 2×
“Recent works even suggest that Epstein–Barr virus, which has long been linked toMS (Owens and Bennett, 2012; Pakpoor et al., 2013), is capable of infecting the human endothelial cells of the BBB (Casiraghi et al.”
ResultIngrisch, M., Sourbron, S., Morhard, D., Ertl-Wagner, B., Kümpfel, T., Hohlfeld, R., Reiser, M., & Glaser, C. (2012) · Investigative Radiology · doi:10.1097/rli.0b013e31823bfc97 · Cited by 106 · cited 4×
“A recent study using a similar MRI method to investigate only MS patients, reported a mean Ktrans of 0.04 (SD 0.03) mL/100 mL/min in periventricular NAWM (Ingrisch et al., 2012).”
BackgroundMethodResultInfluentialMR properties of rat sciatic nerve following trauma
Stanisz, G. J., Midha, R., Munro, C. A., & Henkelman, R. M. (2001) · Magnetic Resonance in Medicine · doi:10.1002/1522-2594(200103)45:3 · Cited by 96
Casiraghi, C., Dorovini‐Zis, K., & Horwitz, M. S. (2010) · Journal of Neuroimmunology · doi:10.1016/j.jneuroim.2010.08.003 · Cited by 87 · cited 2×
“Recent works even suggest that Epstein–Barr virus, which has long been linked toMS (Owens and Bennett, 2012; Pakpoor et al., 2013), is capable of infecting the human endothelial cells of the BBB (Casiraghi et al., 2011).”
BackgroundResultLarsson, H., Hansen, A. E., Berg, H., Rostrup, E., & Haraldseth, O. (2008) · Journal of Magnetic Resonance Imaging · doi:10.1002/jmri.21328 · Cited by 84 · cited 1×
“The DCE MRI data was analyzed with a semi-automatic procedure (Larsson et al., 2008) using in-house MatLab-based software.”
MethodSelf-citationSimplified, noninvasive PET measurement of blood-brain barrier permeability.
Iannotti, F., Fieschi, C., Alfano, B., Picozzi, P., Mansi, L., Pozzilli, C., Punzo, A., del Vecchio, G., Lenzi, G. L., & Salvatore, M. (1987) · Journal of computer assisted tomography · doi:10.1097/00004728-198705000-00004 · Cited by 80 · cited 1×
“In healthy controls, the finding of low grade leakage seems in good agreement with the previously estimated PET value of 0.03 mL/100 g/min (SD 0.008) (Ki = 0.0003 min−1) reported by Iannotti et al. (1987).”
ResultInfluentialNgono, A. E., Pettré, S., Salou, M., Bahbouhi, B., Soulillou, J., Brouard, S., & Laplaud, D. A. (2012) · Clinical Immunology · doi:10.1016/j.clim.2012.05.009 · Cited by 79
Silver, N., Tofts, P., Symms, M., Barker, G. J., Thompson, A., & Miller, D. (2001) · Multiple Sclerosis · doi:10.1177/135245850100700201 · Cited by 76 · cited 5×
“This would serve to explain why some studies find no difference between healthy controls and MS patients undergoing immunomodulatory treatment (Lund et al., 2013) or having no recent relapses (Silver et al., 2001).”
BackgroundResultInfluentialMultiple sclerosis. Observations and reflections--a personal memoir.
Poser, C. (1992) · Journal of Neurological Sciences · doi:10.1016/0022-510x(92)90280-x · Cited by 75 · cited 1×
“The large body of evidence supporting BBB dysfunction in MS is reviewed in detail elsewhere (Poser, 1986, 1992, 2004) with two main points.”
BackgroundThe effects of blood–brain barrier disruption on glial cell function in multiple sclerosis
McQuaid, S., Cunnea, P., McMahon, J. M., & FitzGerald, U. (2009) · Biochemical Society Transactions · doi:10.1042/bst0370329 · Cited by 71 · cited 2×
“All rights reser inactive MS lesions as well as normal appearing white matter (NAWM) (Kirk et al., 2003; McQuaid et al., 2009; Plumb et al., 2002; Vos et al., 2005), and serial MRI studies have indicated that structural changes (Filippi et al., 1998; Werring, 2000) and BBB dysfunction (Goodkin et…”
BackgroundInitial clinical evaluation of gadolinium DTPA for contrast-enhanced magnetic resonance imaging.
Runge, V. M., Schoerner, W., Niendorf, H., Laniado, M., Koehler, D., Claussen, C., Felix, R., & James, A. E. (1985) · Magnetic Resonance Imaging · doi:10.1016/0730-725x(85)90006-2 · Cited by 62 · cited 1×
“A key event in MS is the formation of acute gadolinium-enhancing lesions, resulting from an overt breach of the BBB (Runge et al., 1985).”
BackgroundOwens, G. P., & Bennett, J. L. (2012) · Multiple Sclerosis Journal · doi:10.1177/1352458512448109 · Cited by 58 · cited 3×
“Recent works even suggest that Epstein–Barr virus, which has long been linked toMS (Owens and Bennett, 2012; Pakpoor et al., 2013), is capable of infecting the human endothelial cells of the BBB (Casiraghi et al.”
BackgroundResultHansen, A. E., Pedersen, H., Rostrup, E., & Larsson, H. (2009) · Magnetic Resonance in Medicine · doi:10.1002/mrm.22098 · Cited by 50
Self-citationKraus, J., Voigt, K., Schuller, A., Scholz, M., Kim, K., Schilling, M., Schäbitz, W., Oschmann, P., & Engelhardt, B. (2008) · Multiple Sclerosis · doi:10.1177/1352458508088940 · Cited by 50 · cited 1×
“At least in the case of IFN-beta-1a, it has been shown to stabilize barrier characteristics of human brain capillary endothelial cells in vitro (Kraus et al., 2008).”
BackgroundThe role of trauma in the pathogenesis of multiple sclerosis: a review.
Poser, C. (1994) · Clinical neurology and neurosurgery (Dutch-Flemish ed. Print) · doi:10.1016/0303-8467(94)90042-6 · Cited by 50 · cited 1×
“Even trauma and certain chemical effects seem to be able to initiate the plaque forming process in some MS cases (Poser, 1994).”
BackgroundDetection of viral DNA sequences in the cerebrospinal fluid of patients with multiple sclerosis
Mancuso, R., Hernis, A., Cavarretta, R., Caputo, D., Calabrese, E., Nemni, R., Ferrante, P., Delbue, S., & Clerici, M. (2010) · Journal of Medical Virology · doi:10.1002/jmv.21764 · Cited by 49 · cited 1×
“Only a minority of cells need be infected and express viral genes, which would serve to explain the inconsistent detection of EBV in MS brains (Willis et al., 2009) and CSF (Mancuso et al., 2010).”
BackgroundTofts, P. (1996) · Magnetic Resonance Imaging · doi:10.1016/0730-725x(96)00023-9 · Cited by 38 · cited 1×
“This leakage was primarily observed to occur 20 and 40 min post-contrast, and previous work suggests that low permeating MS lesions may not reach maximum concentration of contrast agent until 2 h after injection (Tofts, 1995).”
ResultSoon, D., Altmann, D., Fernando, K., Giovannoni, G., Barkhof, F., Polman, C., O'Connor, P., Gray, B., Panzara, M., & Miller, D. H. (2007) · Journal of Neurology · doi:10.1007/s00415-006-0356-z · Cited by 34 · cited 1×
“One earlier study by Soon and colleagues did however report a higher degree of leakage in inactive MS lesions when compared to contralateral NAWM (Soon et al., 2007).”
ResultLund, H., Krakauer, M., Skimminge, A., Sellebjerg, F. T., Garde, E., Siebner, H. R., Paulson, O. B., Hesse, D., & Hanson, L. G. (2013) · PLoS ONE · doi:10.1371/journal.pone.0056375 · Cited by 32 · cited 5×
“This would serve to explain why some studies find no difference between healthy controls and MS patients undergoing immunomodulatory treatment (Lund et al., 2013) or having no recent relapses (Silver et al., 2001).”
BackgroundResultInfluentialMultiple sclerosis trait: the premorbid stage of multiple sclerosis. A hypothesis
Poser, C. (2004) · Acta Neurologica Scandinavica · doi:10.1111/j.1600-0404.2004.00277.x · Cited by 24 · cited 1×
“A key event in MS is the formation of acute gadolinium-enhancing lesions, resulting from an overt breach of the BBB (Runge et al., 1985).”
Background
Cited by
Sorted by citations
Blood–brain barrier breakdown in Alzheimer disease and other neurodegenerative disorders
Sweeney, M. D., Sagare, A. P., & Zlokovic, B. V. (2018) · Nature Reviews Neurology · doi:10.1038/nrneurol.2017.188 · Cited by 3,076
Blood-Brain Barrier: From Physiology to Disease and Back
Sweeney, M. D., Zhao, Z., Montagne, A., Nelson, A. R., & Zlokovic, B. V. (2019) · Physiological Reviews · doi:10.1152/physrev.00050.2017 · Cited by 2,312
Dominy, S. S., Lynch, C., Ermini, F., Benedyk, M., Marczyk, A., Konradi, A., Nguyen, M., Haditsch, U., Raha, D., Griffin, C., et al. (2019) · Science Advances · doi:10.1126/sciadv.aau3333 · Cited by 1,966
The blood-brain barrier in systemic inflammation
Varatharaj, A., & Galea, I. (2017) · Brain, Behavior, and Immunity · doi:10.1016/j.bbi.2016.03.010 · Cited by 1,172
“Imaging studies show BBB disruption in normal-appearing white matter in MS (Cramer et al., 2014), and BBB breakdown precedes the development of new lesions (Alvarez et al., 2015).”
The role of brain vasculature in neurodegenerative disorders
Sweeney, M. D., Kisler, K., Montagne, A., Toga, A. W., & Zlokovic, B. V. (2018) · Nature Neuroscience · doi:10.1038/s41593-018-0234-x · Cited by 998
Metadata
- Authors
- Cramer, S. P., Simonsen, H., Frederiksen, J. L., Rostrup, E., & Larsson, H. B. W.
- Affiliations
- University of Copenhagen (DK)
- Corresponding author
- Cramer, S.P.
- Venue
- NeuroImage: Clinical
- Publisher
- Elsevier BV
- Published
- 2014
- Volume
- 4
- Pages
- 182-189
- ISSN
- 2213-1582 (ISSN-L)
- PMC
- PMC3872721
- OpenAlex
- W2039561850
- Cited by
- 232
- References
- 37
- Citations by year
- 2026: 16 · 2025: 20 · 2024: 16 · 2023: 20 · 2022: 24 · 2021: 16 · 2020: 14 · 2019: 20 · 2018: 26 · 2017: 13 · 2016: 16 · 2015: 21 · 2014: 9
- FWCI
- 11.49
- Type
- journal article
- Language
- en
- Open access
- gold
- doi.org
- Licence
- Locations
- NeuroImage Clinical (publishedVersion, cc-by-nc-sa)
- Europe PMC (PubMed Central) (publishedVersion, cc-by-nc-sa)
- PubMed Central (publishedVersion, cc-by-nc-sa)
- PubMed (publishedVersion)
- BIBSYS Brage (BIBSYS (Norway)) (submittedVersion)
- DOAJ (DOAJ: Directory of Open Access Journals) (submittedVersion, cc-by-sa)
- NORA - Norwegian Open Research Archives (submittedVersion, cc-by-nc-sa)
- Research at the University of Copenhagen (University of Copenhagen) (submittedVersion)
- Funders
- Biogen
- Scleroseforeningen (14588)
- Multiple Sclerosis Society (14588)
- Region Hovedstaden
- Topics
- Health Sciences › Medicine › Clinical Neurology › Multiple Sclerosis Research Studies
- Life Sciences › Neuroscience › Neurology › Barrier Structure and Function Studies
- Health Sciences › Medicine › Radiology, Nuclear Medicine and Imaging › Advanced MRI Techniques and Applications
- Keywords
- multiple sclerosis, blood-brain barrier permeability, normal-appearing white matter, periventricular white matter, dynamic contrast-enhanced MRI, MS relapse, immunomodulatory therapy, MS lesions, blood-brain barrier disruption
- MeSH terms
- Adult, Blood-Brain Barrier, Capillary Permeability, Contrast Media, Female, Humans, Magnetic Resonance Imaging, Male, Middle Aged, Multiple Sclerosis, Severity of Illness Index, Imaging, Three-Dimensional, Perfusion Imaging, White Matter
About these checks
Registry, retraction, Cites and statistics results are computed, not judged, with one exception: a printed reference that no index lists is read once by a model before it counts as a citation error. Claims are extracted by a model and kept only when their quote appears verbatim in the text; each cited source is then checked, with a model’s help, for whether it says what the claim relies on. Those verdicts can be wrong — read the claim’s quote and the cited source before relying on one.
Statistics and arithmetic are recomputed, not judged.
Confidence bands are shown only for fields calibrated on our annotated test set. None is calibrated yet, so no band is shown.
What counts as a claim ›How we measure confidence ›How we check this ›
Are you an author, or do you see a problem with this page? Request a review
