Cited by 289

The DOI matches its Crossref record; 11 of the 11 references it cites were found in a registry or an index.

DNA Methylation Dynamics of Human Hematopoietic Stem Cell Differentiation

Farlik, Matthias, Halbritter, Florian, Müller, Fabian, Choudry, Fizzah A., Ebert, Peter, Klughammer, Johanna, Farrow, Samantha, Santoro, Antonella, Ciaurro, Valerio, Mathur, Anthony, Uppal, Rakesh, Stunnenberg, Hendrik G., Ouwehand, Willem H., Laurenti, Elisa, Lengauer, Thomas, Frontini, Mattia, Bock, Christoph·2016·Cell Stem Cell

Overview

The claims and statistics of this paper haven’t been checked yet.

Run the check — free, no account needed. It reads the open-access text and checks the sources it cites.

A few free checks a day · papers already verified open instantly · results are public

Integrity signals

Registry

Crossref · 10.1016/j.stem.2016.10.019

Cites

11 of 11 references verified0 citation errors · 0 not checkable

Statistics

Figures

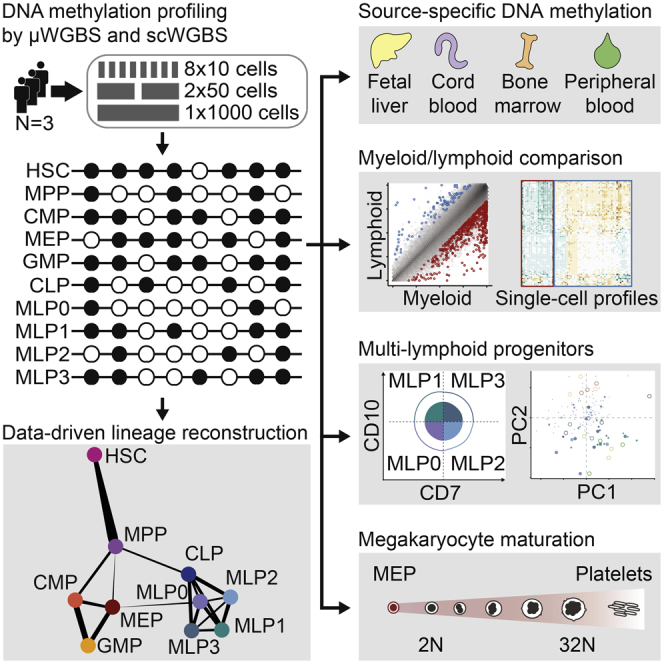
Graphical abstract
Graphical abstract CC BY · PubMed Central
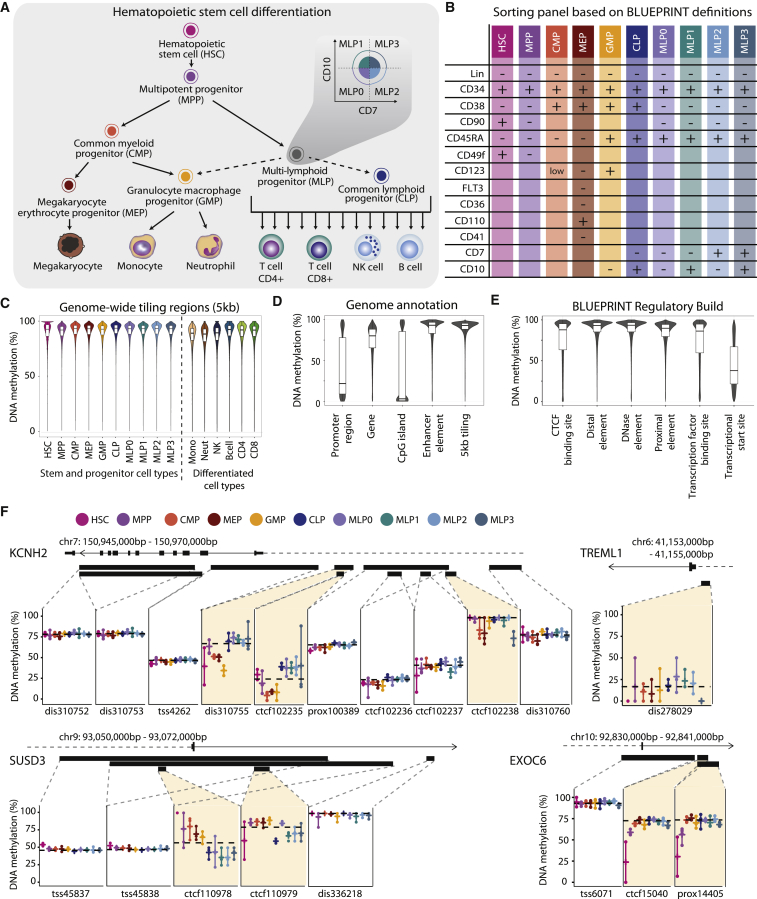
Figure 1 Charting the DNA Methylation Landscape of Human Hematopoietic Differentiation (A) Conceptual outline of human hematopoietic differentiation, highlighting the 17 hematopoietic cell types whose genome-wide DNA methylation patterns were profiled in this study. Arrows denote established differentiation trajectories, dashed arrows indicate uncertainty about the in vivo differentiation potential of lymphoid progenitors, and the inset illustrates the sorting of four subsets of immature multi-lymphoid progenitors. (B) Fluorescence-activated cell sorting panel used to purify 10 stem and progenitor cell types from peripheral blood. (C) Violin plots and boxplots showing the distribution of DNA methylation levels in 5-kb tiling regions for hematopoietic cell types sorted from peripheral blood. (D) Distribution of DNA methylation levels across cell types for different sets of genomic regions. Gene and promoter annotations are based on GENCODE, CpG islands are from the UCSC Table Browser, enhancer elements are from Ensembl, and tiling regions were calculated with a custom script. (E) Distribution of average DNA methylation levels across cell types for putative regulatory regions annotated by the Ensembl BLUEPRINT Regulatory Build. (F) DNA methylation at putative regulatory regions for illustrative gene loci. Black bars denote the position of regions annotated by the BLUEPRINT Regulatory Build, and dashed horizontal black lines indicate sample medians for the respective regions. Colored vertical bars connect the highest and lowest DNA methylation levels that have been measured in any sample of the indicated cell type. dis, distal element; prox, proximal element; TSS, transcriptional start site. See also Figure S1 and http://blueprint-methylomes.computational-epigenetics.org.
Figure 1 Charting the DNA Methylation Landscape of Human Hematopoietic Differentiation (A) Conceptual outline of human hematopoietic differentiation, highlighting the 17 hematopoietic cell types whose genome-wide DNA methylation patterns were profiled in this study. Arrows denote established differentiation trajectories, dashed arrows indicate uncertainty about the in vivo differentiation potential of lymphoid progenitors, and the inset illustrates the sorting of four subsets of immature multi-lymphoid progenitors. (B) Fluorescence-activated cell sorting panel used to purify 10 stem and progenitor cell types from peripheral blood. (C) Violin plots and boxplots showing the distribution of DNA methylation levels in 5-kb tiling regions for hematopoietic cell types sorted from peripheral blood. (D) Distribution of DNA methylation levels across cell types for different sets of genomic regions. Gene and promoter annotations are based on GENCODE, CpG islands are from the UCSC Table Browser, enhancer elements are from Ensembl, and tiling regions were calculated with a custom script. (E) Distribution of average DNA methylation levels across cell types for putative regulatory regions annotated by the Ensembl BLUEPRINT Regulatory Build. (F) DNA methylation at putative regulatory regions for illustrative gene loci. Black bars denote the position of regions annotated by the BLUEPRINT Regulatory Build, and dashed horizontal black lines indicate sample medians for the respective regions. Colored vertical bars connect the highest and lowest DNA methylation levels that have been measured in any sample of the indicated cell type. dis, distal element; prox, proximal element; TSS, transcriptional start site. See also Figure S1 and http://blueprint-methylomes.computational-epigenetics.org.CC BY · PubMed Central
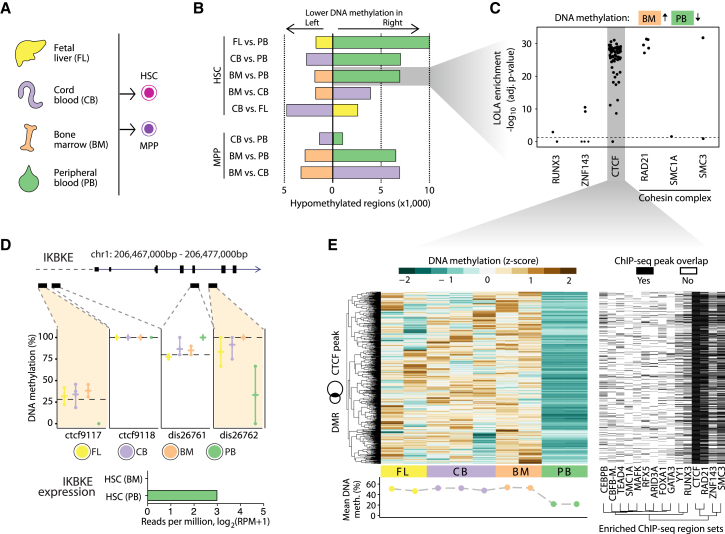
Figure 2 Comparison of DNA Methylation Maps for HSCs and MPPs Isolated from Four Different Sources (A) HSCs and MPPs were sorted from the peripheral blood of three healthy donors (Figures 1A and 1B), and in addition from fetal liver (HSCs only), cord blood (HSCs and MPPs), and bone marrow (HSCs and MPPs). (B) Bar plots showing the numbers of differentially methylated regions in pairwise comparisons between HSCs and MPPs from different sources, based on the BLUEPRINT Regulatory Build regions (FDR-adjusted p ≤ 0.05, absolute difference ≥ 0.167 percentage points), calculated with RnBeads (Assenov et al., 2014). (C) Region set enrichment analysis for genomic regions with lower DNA methylation in peripheral blood-derived HSCs compared with bone-marrow-derived HSCs. Enrichment was determined using LOLA (Sheffield and Bock, 2016). Each dot represents one ChIP-seq dataset, and the horizontal dashed line corresponds to a significance threshold of 0.05 on the adjusted p-value calculated by LOLA using Fisher’s exact test. (D) Source-specific DNA methylation at the IKBKE gene locus. Reduced DNA methylation levels in peripheral blood-derived HSC at two putative regulatory regions (BLUEPRINT Regulatory Build) is associated with detectable expression of the IKBKE gene specifically in this cell population (bar plot). (E) Heatmap showing DNA methylation levels for regions that have lower DNA methylation in peripheral blood-derived HSCs than in bone-marrow-derived HSCs and also overlap with CTCF binding sites in the LOLA Core database (left). The second heatmap (right) shows the overlap of these regions with transcription factor binding sites that a LOLA analysis of this region set identified as enriched. Rows were arranged by hierarchical clustering with complete linkage based on the Euclidean distances between the DNA methylation profiles. See also Figure S2 and http://blueprint-methylomes.computational-epigenetics.org.
Figure 2 Comparison of DNA Methylation Maps for HSCs and MPPs Isolated from Four Different Sources (A) HSCs and MPPs were sorted from the peripheral blood of three healthy donors (Figures 1A and 1B), and in addition from fetal liver (HSCs only), cord blood (HSCs and MPPs), and bone marrow (HSCs and MPPs). (B) Bar plots showing the numbers of differentially methylated regions in pairwise comparisons between HSCs and MPPs from different sources, based on the BLUEPRINT Regulatory Build regions (FDR-adjusted p ≤ 0.05, absolute difference ≥ 0.167 percentage points), calculated with RnBeads (Assenov et al., 2014). (C) Region set enrichment analysis for genomic regions with lower DNA methylation in peripheral blood-derived HSCs compared with bone-marrow-derived HSCs. Enrichment was determined using LOLA (Sheffield and Bock, 2016). Each dot represents one ChIP-seq dataset, and the horizontal dashed line corresponds to a significance threshold of 0.05 on the adjusted p-value calculated by LOLA using Fisher’s exact test. (D) Source-specific DNA methylation at the IKBKE gene locus. Reduced DNA methylation levels in peripheral blood-derived HSC at two putative regulatory regions (BLUEPRINT Regulatory Build) is associated with detectable expression of the IKBKE gene specifically in this cell population (bar plot). (E) Heatmap showing DNA methylation levels for regions that have lower DNA methylation in peripheral blood-derived HSCs than in bone-marrow-derived HSCs and also overlap with CTCF binding sites in the LOLA Core database (left). The second heatmap (right) shows the overlap of these regions with transcription factor binding sites that a LOLA analysis of this region set identified as enriched. Rows were arranged by hierarchical clustering with complete linkage based on the Euclidean distances between the DNA methylation profiles. See also Figure S2 and http://blueprint-methylomes.computational-epigenetics.org.CC BY · PubMed Central
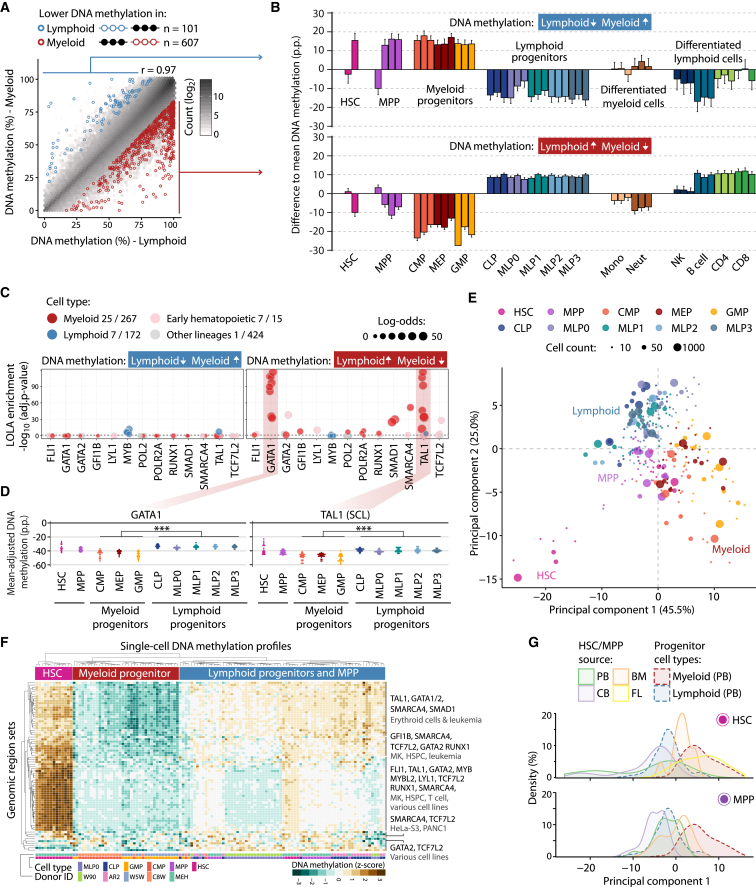
Figure 3 DNA Methylation Differences Associated with Myeloid-Lymphoid Lineage Commitment (A) Scatterplot showing average DNA methylation levels for myeloid progenitors (CMP, MEP, GMP) and lymphoid progenitors (CLP, MLP0, MLP1, MLP2, MLP3) across BLUEPRINT Regulatory Build regions (Pearson’s r = 0.97). Differentially methylated regions were identified with RnBeads (FDR-adjusted p ≤ 0.05, absolute difference ≥ 0.167 percentage points). (B) Average DNA methylation in each cell type relative to the mean over all samples aggregated over all regions with lower DNA methylation in lymphoid progenitors (top) and myeloid progenitors (bottom). Error bars correspond to the standard error. (C) Region set enrichment analysis for regions with lower DNA methylation in lymphoid progenitors (left) or myeloid progenitors (right). Enrichment was determined using LOLA. Colored dots represent ChIP-seq experiments for transcription factors in the indicated lineage. Dot size denotes the log-odds ratio, and the numbers in the legend (“X/Y”) refer to significantly enriched region sets (X) versus all analyzed region sets (Y). The horizontal dashed line represents the significance threshold (adjusted p ≤ 0.05). (D) Mean-adjusted DNA methylation relative to the average CpG methylation levels for each individual 10-, 50-, and 1,000-cell sample averaged across ChIP-seq peaks for GATA1 (left) and TAL1 (right). ∗∗∗p ≤ 0.001 (two-tailed Wilcoxon test). (E) Two-dimensional projection of all 10-, 50-, and 1,000-cell samples from peripheral blood using principal component analysis based on the mean-adjusted DNA methylation across all transcription factor binding datasets identified by LOLA. The first two principal components are shown, and the numbers in parentheses indicate the percentage of variance explained. (F) Heatmap displaying mean-adjusted DNA methylation for all single-cell DNA methylation profiles across the same region sets as in (E). Rows and columns are arranged by hierarchical clustering with Euclidean distance and complete linkage. The labels on the right summarize the transcription factors and cell types for the major branches of the row dendrogram. (G) Distribution of HSC (top) and MPP (bottom) samples derived from fetal liver (FL), cord blood (CB), bone marrow (BM), and peripheral blood (PB) when projected onto the first principal component from (E). p.p., percentage points. See also Figure S3 and http://blueprint-methylomes.computational-epigenetics.org.
Figure 3 DNA Methylation Differences Associated with Myeloid-Lymphoid Lineage Commitment (A) Scatterplot showing average DNA methylation levels for myeloid progenitors (CMP, MEP, GMP) and lymphoid progenitors (CLP, MLP0, MLP1, MLP2, MLP3) across BLUEPRINT Regulatory Build regions (Pearson’s r = 0.97). Differentially methylated regions were identified with RnBeads (FDR-adjusted p ≤ 0.05, absolute difference ≥ 0.167 percentage points). (B) Average DNA methylation in each cell type relative to the mean over all samples aggregated over all regions with lower DNA methylation in lymphoid progenitors (top) and myeloid progenitors (bottom). Error bars correspond to the standard error. (C) Region set enrichment analysis for regions with lower DNA methylation in lymphoid progenitors (left) or myeloid progenitors (right). Enrichment was determined using LOLA. Colored dots represent ChIP-seq experiments for transcription factors in the indicated lineage. Dot size denotes the log-odds ratio, and the numbers in the legend (“X/Y”) refer to significantly enriched region sets (X) versus all analyzed region sets (Y). The horizontal dashed line represents the significance threshold (adjusted p ≤ 0.05). (D) Mean-adjusted DNA methylation relative to the average CpG methylation levels for each individual 10-, 50-, and 1,000-cell sample averaged across ChIP-seq peaks for GATA1 (left) and TAL1 (right). ∗∗∗p ≤ 0.001 (two-tailed Wilcoxon test). (E) Two-dimensional projection of all 10-, 50-, and 1,000-cell samples from peripheral blood using principal component analysis based on the mean-adjusted DNA methylation across all transcription factor binding datasets identified by LOLA. The first two principal components are shown, and the numbers in parentheses indicate the percentage of variance explained. (F) Heatmap displaying mean-adjusted DNA methylation for all single-cell DNA methylation profiles across the same region sets as in (E). Rows and columns are arranged by hierarchical clustering with Euclidean distance and complete linkage. The labels on the right summarize the transcription factors and cell types for the major branches of the row dendrogram. (G) Distribution of HSC (top) and MPP (bottom) samples derived from fetal liver (FL), cord blood (CB), bone marrow (BM), and peripheral blood (PB) when projected onto the first principal component from (E). p.p., percentage points. See also Figure S3 and http://blueprint-methylomes.computational-epigenetics.org.CC BY · PubMed Central
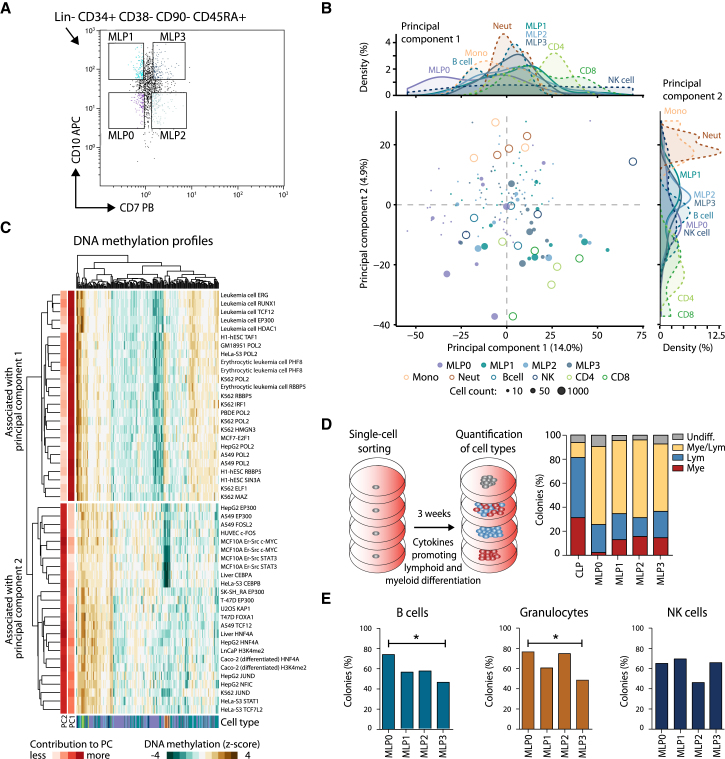
Figure 4 Characterization of MLP Populations by DNA Methylation and In Vitro Differentiation Assays (A) Sorting panel for purifying four MLP populations from peripheral blood. (B) Two-dimensional projection of all 10-, 50-, and 1,000-cell MLP samples using principal component analysis based on the mean-adjusted DNA methylation relative to the average CpG methylation levels across all region sets in the LOLA Core database. The first two principal components are shown, the numbers in parentheses indicate the percentage of variance explained, and the density plots (top and right) summarize the distribution of cell types along the two principal components. (C) Heatmap displaying the mean-adjusted DNA methylation for all MLP samples across the 2 × 25 genomic region sets that contributed most strongly to the first principal component (PC1, top) and the second principal component (PC2, bottom). Rows and columns are arranged by hierarchical clustering with Euclidean distance and complete linkage. The row labels indicate the cell type and ChIP-seq target of the corresponding LOLA region sets. (D) Differentiation potential of CLPs and four MLP populations measured by in vitro culture of single cells on MS-5 stroma with cytokines promoting lymphoid and myeloid differentiation. The percentage of colonies that show lymphoid (CD19+ or CD56+) as well as myeloid (CD14+ or CD15+) markers was determined by flow cytometry. (E) Differentiation potential of the MLP populations measured as the percentage of colonies containing B cells (CD19+), granulocytes (CD15+), or NK cells (CD56+) in flow cytometry. ∗p ≤ 0.05 (Fisher’s exact test). See also Figure S4 and http://blueprint-methylomes.computational-epigenetics.org.
Figure 4 Characterization of MLP Populations by DNA Methylation and In Vitro Differentiation Assays (A) Sorting panel for purifying four MLP populations from peripheral blood. (B) Two-dimensional projection of all 10-, 50-, and 1,000-cell MLP samples using principal component analysis based on the mean-adjusted DNA methylation relative to the average CpG methylation levels across all region sets in the LOLA Core database. The first two principal components are shown, the numbers in parentheses indicate the percentage of variance explained, and the density plots (top and right) summarize the distribution of cell types along the two principal components. (C) Heatmap displaying the mean-adjusted DNA methylation for all MLP samples across the 2 × 25 genomic region sets that contributed most strongly to the first principal component (PC1, top) and the second principal component (PC2, bottom). Rows and columns are arranged by hierarchical clustering with Euclidean distance and complete linkage. The row labels indicate the cell type and ChIP-seq target of the corresponding LOLA region sets. (D) Differentiation potential of CLPs and four MLP populations measured by in vitro culture of single cells on MS-5 stroma with cytokines promoting lymphoid and myeloid differentiation. The percentage of colonies that show lymphoid (CD19+ or CD56+) as well as myeloid (CD14+ or CD15+) markers was determined by flow cytometry. (E) Differentiation potential of the MLP populations measured as the percentage of colonies containing B cells (CD19+), granulocytes (CD15+), or NK cells (CD56+) in flow cytometry. ∗p ≤ 0.05 (Fisher’s exact test). See also Figure S4 and http://blueprint-methylomes.computational-epigenetics.org.CC BY · PubMed Central
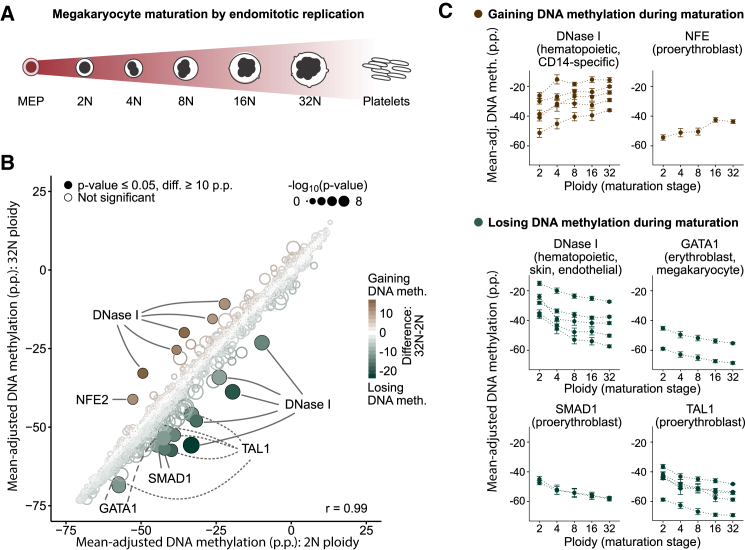
Figure 5 DNA Methylation Analysis of Megakaryocyte Maturation (A) Conceptual outline of megakaryocyte development from MEPs via a maturation phase involving endomitotic genome replication and a concomitant increase in ploidy. (B) Scatterplot comparing mean-adjusted DNA methylation (relative to the average CpG methylation level in each sample) for all region sets in the LOLA Core database between megakaryocyte at the 2N and at the 32N stage of ploidy. Region sets that were significantly less methylated in 32N (n = 14, bottom right) or in 2N megakaryocyte (n = 6, top left) are highlighted with filled circles (p ≤ 0.05, Wilcoxon test, absolute difference ≥ 10 p.p.). Point colors indicate the magnitude of difference, and the size is proportional to statistical significance [−log10(p)]. (C) Mean-adjusted DNA methylation in region sets that gain (top) or lose DNA methylation (bottom) as identified in (B), plotted across ploidy stages of megakaryocyte maturation. Error bars correspond to the standard error. p.p., percentage points. See also Figure S5 and http://blueprint-methylomes.computational-epigenetics.org.
Figure 5 DNA Methylation Analysis of Megakaryocyte Maturation (A) Conceptual outline of megakaryocyte development from MEPs via a maturation phase involving endomitotic genome replication and a concomitant increase in ploidy. (B) Scatterplot comparing mean-adjusted DNA methylation (relative to the average CpG methylation level in each sample) for all region sets in the LOLA Core database between megakaryocyte at the 2N and at the 32N stage of ploidy. Region sets that were significantly less methylated in 32N (n = 14, bottom right) or in 2N megakaryocyte (n = 6, top left) are highlighted with filled circles (p ≤ 0.05, Wilcoxon test, absolute difference ≥ 10 p.p.). Point colors indicate the magnitude of difference, and the size is proportional to statistical significance [−log10(p)]. (C) Mean-adjusted DNA methylation in region sets that gain (top) or lose DNA methylation (bottom) as identified in (B), plotted across ploidy stages of megakaryocyte maturation. Error bars correspond to the standard error. p.p., percentage points. See also Figure S5 and http://blueprint-methylomes.computational-epigenetics.org.CC BY · PubMed Central
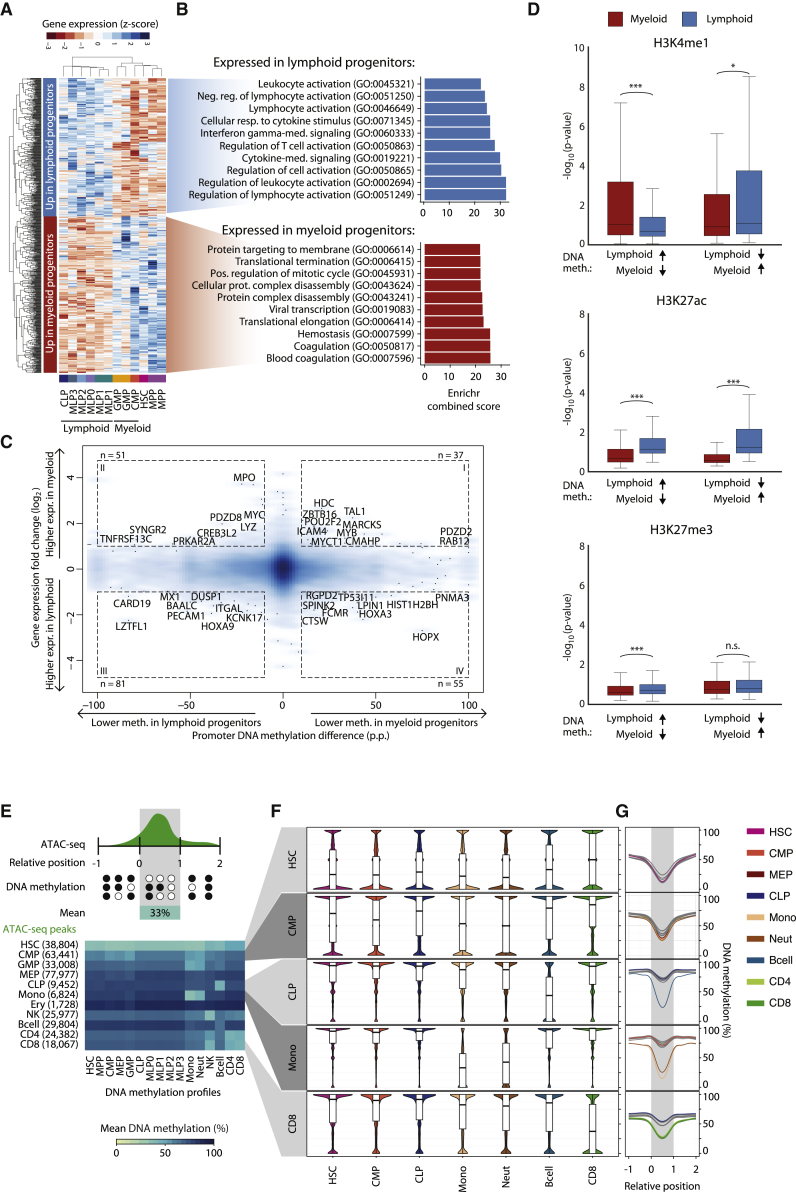
Figure 6 Integrative Analysis of Gene Expression, Histone Modifications, and Chromatin Accessibility (A) Heatmap showing row-normalized expression levels for 656 differentially expressed genes (FDR-adjusted p ≤ 0.05, |log2FC| ≥ 1) between myeloid progenitors (CMP, GMP) and lymphoid progenitors (CLP, MLP0, MLP1, MLP2, MLP3) determined using DEseq2 (Love et al., 2014). Rows and columns were arranged by hierarchical clustering with Euclidean distance and complete linkage. (B) Top 10 most highly enriched Gene Ontology terms associated with genes overexpressed in lymphoid (top) and myeloid (bottom) progenitors based on the Enrichr software (Kuleshov et al., 2016). (C) Density scatterplot contrasting myeloid-lymphoid differences in DNA methylation at gene promoters with expression differences of the corresponding genes. Selected genes with strong differences in DNA methylation (absolute difference ≥ 10 p.p.) and gene expression (|log2FC| ≥ 1) are highlighted. (D) Boxplots showing histone modification levels for open chromatin-associated H3K4me1, active enhancer-linked H3K27ac, and polycomb-associated H3K27me3 in regions that were differentially methylated between myeloid and lymphoid progenitors (Figure 3A). Histone modification levels were calculated from multiple ChIP-seq datasets for myeloid cells (neutrophils, monocytes, and macrophages, in red) and lymphoid cells (NK cells, B cells, and CD4+/CD8+ T cells, in blue). Brackets identify two-tailed Mann-Whitney U tests. ∗p ≤ 0.05, ∗∗∗p ≤ 0.001. (E) Heatmap showing DNA methylation levels (columns) in regions with cell-type-specific chromatin accessibility based on published ATAC-seq data for hematopoietic cell types (rows). Numbers in parentheses denote the number of chromatin accessible regions specific to each cell type. (F) Distribution of DNA methylation levels across regions with cell-type-specific chromatin accessibility. (G) Composite plots showing DNA methylation averages across regions with cell-type-specific chromatin accessibility. CpGs in the neighborhood of these regions were annotated with coordinates relative to their start and end (x axis). CpGs with a relative coordinate of 0 and 1 are located at the start and end of a region, respectively, and the coordinates −1 and 2 correspond to one region length upstream and downstream of the region. The curves show cubic spline smoothing of DNA methylation levels per cell type across accessible regions. p.p., percentage points; n.s., not significant. See also Figure S6 and http://blueprint-methylomes.computational-epigenetics.org.
Figure 6 Integrative Analysis of Gene Expression, Histone Modifications, and Chromatin Accessibility (A) Heatmap showing row-normalized expression levels for 656 differentially expressed genes (FDR-adjusted p ≤ 0.05, |log2FC| ≥ 1) between myeloid progenitors (CMP, GMP) and lymphoid progenitors (CLP, MLP0, MLP1, MLP2, MLP3) determined using DEseq2 (Love et al., 2014). Rows and columns were arranged by hierarchical clustering with Euclidean distance and complete linkage. (B) Top 10 most highly enriched Gene Ontology terms associated with genes overexpressed in lymphoid (top) and myeloid (bottom) progenitors based on the Enrichr software (Kuleshov et al., 2016). (C) Density scatterplot contrasting myeloid-lymphoid differences in DNA methylation at gene promoters with expression differences of the corresponding genes. Selected genes with strong differences in DNA methylation (absolute difference ≥ 10 p.p.) and gene expression (|log2FC| ≥ 1) are highlighted. (D) Boxplots showing histone modification levels for open chromatin-associated H3K4me1, active enhancer-linked H3K27ac, and polycomb-associated H3K27me3 in regions that were differentially methylated between myeloid and lymphoid progenitors (Figure 3A). Histone modification levels were calculated from multiple ChIP-seq datasets for myeloid cells (neutrophils, monocytes, and macrophages, in red) and lymphoid cells (NK cells, B cells, and CD4+/CD8+ T cells, in blue). Brackets identify two-tailed Mann-Whitney U tests. ∗p ≤ 0.05, ∗∗∗p ≤ 0.001. (E) Heatmap showing DNA methylation levels (columns) in regions with cell-type-specific chromatin accessibility based on published ATAC-seq data for hematopoietic cell types (rows). Numbers in parentheses denote the number of chromatin accessible regions specific to each cell type. (F) Distribution of DNA methylation levels across regions with cell-type-specific chromatin accessibility. (G) Composite plots showing DNA methylation averages across regions with cell-type-specific chromatin accessibility. CpGs in the neighborhood of these regions were annotated with coordinates relative to their start and end (x axis). CpGs with a relative coordinate of 0 and 1 are located at the start and end of a region, respectively, and the coordinates −1 and 2 correspond to one region length upstream and downstream of the region. The curves show cubic spline smoothing of DNA methylation levels per cell type across accessible regions. p.p., percentage points; n.s., not significant. See also Figure S6 and http://blueprint-methylomes.computational-epigenetics.org.CC BY · PubMed Central
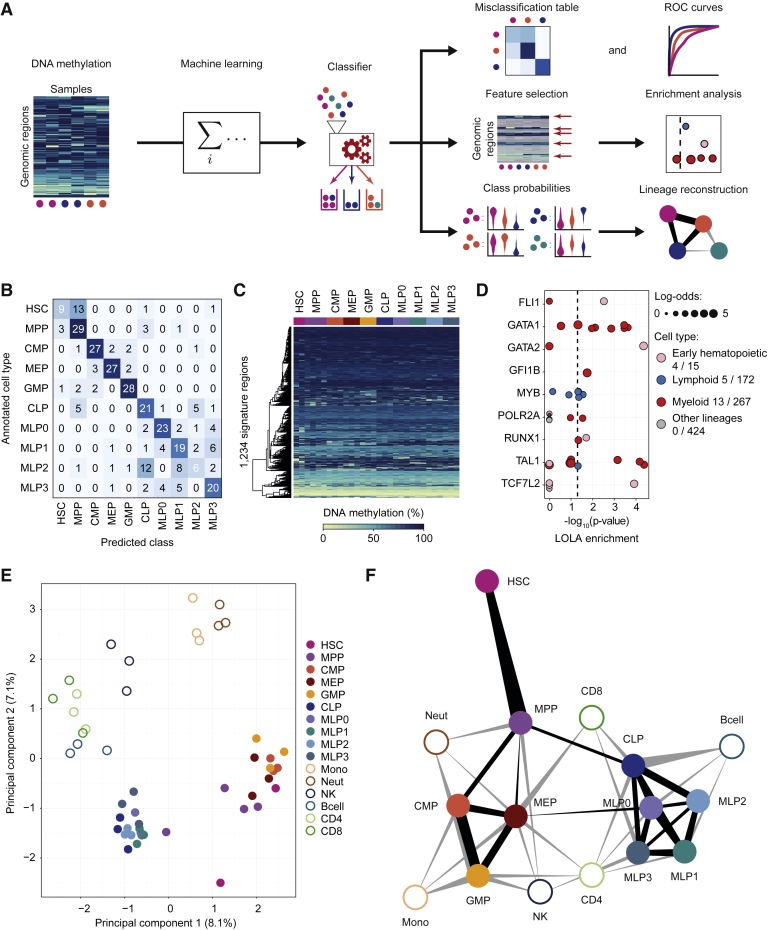
Figure 7 Data-Driven Reconstruction of the Human Hematopoietic Lineage using Machine Learning (A) Conceptual outline of the machine learning approach used to predict cell type, to identify signature regions, and to infer cellular differentiation landscapes. (B) Confusion matrix showing the frequency of misclassification based on 10-fold cross-validation of cell-type classifiers trained and evaluated on 319 stem and progenitor samples (all 10-, 50-, and 1,000-cell pools) from peripheral blood. (C) Heatmap showing average DNA methylation levels of merged replicates (one column for each cell type in each donor) for the 1,234 signature regions extracted from a classifier trained on all peripheral blood-derived stem and progenitor samples. Regions (rows) were arranged using hierarchical clustering with Euclidean distance and complete linkage. (D) Region set enrichment analysis for the signature regions using LOLA. Colored dots represent ChIP-seq experiments for transcription factors in the indicated lineage. Dot size denotes the log-odds ratio, and the numbers in the legend (“X/Y”) refer to significantly enriched region sets (X) versus all analyzed region sets (Y). The vertical dashed line represents the significance threshold (adjusted p ≤ 0.05). (E) Two-dimensional projection of merged replicates (one point for each cell type in each donor) using principal component analysis based on average DNA methylation levels in the signature regions. The first two principal components are shown, and the numbers in parentheses indicate the percentage of variance explained. (F) Hematopoietic lineage reconstruction using the prediction propensities of DNA methylation-based classifiers as a measure of similarity between cell types. Nodes in the graph represent cell types, and edges are weighted by class probabilities of cross-prediction. An automated edge-weighted graph layout algorithm was used to define the positions of the nodes. See also Figure S7 and http://blueprint-methylomes.computational-epigenetics.org.
Figure 7 Data-Driven Reconstruction of the Human Hematopoietic Lineage using Machine Learning (A) Conceptual outline of the machine learning approach used to predict cell type, to identify signature regions, and to infer cellular differentiation landscapes. (B) Confusion matrix showing the frequency of misclassification based on 10-fold cross-validation of cell-type classifiers trained and evaluated on 319 stem and progenitor samples (all 10-, 50-, and 1,000-cell pools) from peripheral blood. (C) Heatmap showing average DNA methylation levels of merged replicates (one column for each cell type in each donor) for the 1,234 signature regions extracted from a classifier trained on all peripheral blood-derived stem and progenitor samples. Regions (rows) were arranged using hierarchical clustering with Euclidean distance and complete linkage. (D) Region set enrichment analysis for the signature regions using LOLA. Colored dots represent ChIP-seq experiments for transcription factors in the indicated lineage. Dot size denotes the log-odds ratio, and the numbers in the legend (“X/Y”) refer to significantly enriched region sets (X) versus all analyzed region sets (Y). The vertical dashed line represents the significance threshold (adjusted p ≤ 0.05). (E) Two-dimensional projection of merged replicates (one point for each cell type in each donor) using principal component analysis based on average DNA methylation levels in the signature regions. The first two principal components are shown, and the numbers in parentheses indicate the percentage of variance explained. (F) Hematopoietic lineage reconstruction using the prediction propensities of DNA methylation-based classifiers as a measure of similarity between cell types. Nodes in the graph represent cell types, and edges are weighted by class probabilities of cross-prediction. An automated edge-weighted graph layout algorithm was used to define the positions of the nodes. See also Figure S7 and http://blueprint-methylomes.computational-epigenetics.org.CC BY · PubMed Central

Verification

Claims the paper makes

The claims and statistics of this paper haven’t been checked yet.

Run the check — free, no account needed. It reads the open-access text and checks the sources it cites.

A few free checks a day · papers already verified open instantly · results are public

Claims other papers make about this one

Each is checked against this paper’s own text: does it say what the citing paper says it does?

Self-check

Percentages, sums and reported differences re-computed from the paper’s own numbers.

The self-check needs the paper’s full text.

Citations

Cites

Research works printed but not linked: 46

  1. Adams, 2012, BLUEPRINT to decode the epigenetic signature written in blood, Nat. Biotechnol., 30, 224, 10.1038/nbt.2153 · DOI
  2. Assenov, 2014, Comprehensive analysis of DNA methylation data with RnBeads, Nat. Methods, 11, 1138, 10.1038/nmeth.3115 · DOI
  3. Bock, 2012, Analysing and interpreting DNA methylation data, Nat. Rev. Genet., 13, 705, 10.1038/nrg3273 · DOI
  4. Bock, 2011, Reference Maps of human ES and iPS cell variation enable high-throughput characterization of pluripotent cell lines, Cell, 144, 439, 10.1016/j.cell.2010.12.032 · DOI · Paper page
  5. Bock, 2012, DNA methylation dynamics during in vivo differentiation of blood and skin stem cells, Mol. Cell, 47, 633, 10.1016/j.molcel.2012.06.019 · DOI
  6. Bock, 2016, Quantitative comparison of DNA methylation assays for biomarker development and clinical applications, Nat. Biotechnol., 34, 726, 10.1038/nbt.3605 · DOI
  7. Bröske, 2009, DNA methylation protects hematopoietic stem cell multipotency from myeloerythroid restriction, Nat. Genet., 41, 1207, 10.1038/ng.463 · DOI · Paper page
  8. Cabezas-Wallscheid, 2014, Identification of regulatory networks in HSCs and their immediate progeny via integrated proteome, transcriptome, and DNA methylome analysis, Cell Stem Cell, 15, 507, 10.1016/j.stem.2014.07.005 · DOI · Paper page
  9. Chen, 2014, Transcriptional diversity during lineage commitment of human blood progenitors, Science, 345, 1251033, 10.1126/science.1251033 · DOI
  10. Dahl, 2016, Broad histone H3K4me3 domains in mouse oocytes modulate maternal-to-zygotic transition, Nature, 537, 548, 10.1038/nature19360 · DOI
  11. Doulatov, 2010, Revised map of the human progenitor hierarchy shows the origin of macrophages and dendritic cells in early lymphoid development, Nat. Immunol., 11, 585, 10.1038/ni.1889 · DOI
  12. Doulatov, 2012, Hematopoiesis: a human perspective, Cell Stem Cell, 10, 120, 10.1016/j.stem.2012.01.006 · DOI · Paper page
  13. Farlik, 2015, Single-cell DNA methylome sequencing and bioinformatic inference of epigenomic cell-state dynamics, Cell Rep., 10, 1386, 10.1016/j.celrep.2015.02.001 · DOI · Paper page
  14. Fernandez, 2012, A DNA methylation fingerprint of 1628 human samples, Genome Res., 22, 407, 10.1101/gr.119867.110 · DOI
  15. Friedman, 2010, Regularization paths for generalized linear models via coordinate descent, J. Stat. Softw., 33, 1
  16. Goardon, 2011, Coexistence of LMPP-like and GMP-like leukemia stem cells in acute myeloid leukemia, Cancer Cell, 19, 138, 10.1016/j.ccr.2010.12.012 · DOI
  17. Habibi, 2013, Whole-genome bisulfite sequencing of two distinct interconvertible DNA methylomes of mouse embryonic stem cells, Cell Stem Cell, 13, 360, 10.1016/j.stem.2013.06.002 · DOI
  18. Ji, 2010, Comprehensive methylome map of lineage commitment from haematopoietic progenitors, Nature, 467, 338, 10.1038/nature09367 · DOI
  19. Jones, 2012, Functions of DNA methylation: islands, start sites, gene bodies and beyond, Nat. Rev. Genet., 13, 484, 10.1038/nrg3230 · DOI · Paper page
  20. Kim, 2011, Donor cell type can influence the epigenome and differentiation potential of human induced pluripotent stem cells, Nat. Biotechnol., 29, 1117, 10.1038/nbt.2052 · DOI
  21. Kohn, 2012, Lymphoid priming in human bone marrow begins before expression of CD10 with upregulation of L-selectin, Nat. Immunol., 13, 963, 10.1038/ni.2405 · DOI
  22. Krishnapuram, 2005, Sparse multinomial logistic regression: fast algorithms and generalization bounds, IEEE Trans. Pattern Anal. Mach. Intell., 27, 957, 10.1109/TPAMI.2005.127 · DOI
  23. Krueger, 2011, Bismark: a flexible aligner and methylation caller for Bisulfite-Seq applications, Bioinformatics, 27, 1571, 10.1093/bioinformatics/btr167 · DOI
  24. Kuleshov, 2016, Enrichr: a comprehensive gene set enrichment analysis web server 2016 update, Nucleic Acids Res., 44, W90, 10.1093/nar/gkw377 · DOI · Paper page
  25. Laird, 2003, The power and the promise of DNA methylation markers, Nat. Rev. Cancer, 3, 253, 10.1038/nrc1045 · DOI
  26. Lecine, 1998, Mice lacking transcription factor NF-E2 provide in vivo validation of the proplatelet model of thrombocytopoiesis and show a platelet production defect that is intrinsic to megakaryocytes, Blood, 92, 1608, 10.1182/blood.V92.5.1608 · DOI
  27. Love, 2014, Moderated estimation of fold change and dispersion for RNA-seq data with DESeq2, Genome Biol., 15, 550, 10.1186/s13059-014-0550-8 · DOI · Paper page
  28. McCracken, 2013, Long-term in vivo monitoring of mouse and human hematopoietic stem cell engraftment with a human positron emission tomography reporter gene, Proc. Natl. Acad. Sci. USA, 110, 1857, 10.1073/pnas.1221840110 · DOI
  29. Moran, 2016, Epigenetic profiling to classify cancer of unknown primary: a multicentre, retrospective analysis, Lancet Oncol., 17, 1386, 10.1016/S1470-2045(16)30297-2 · DOI
  30. Park, 2008, In vivo evaluation of human hematopoiesis through xenotransplantation of purified hematopoietic stem cells from umbilical cord blood, Nat. Protoc., 3, 1932, 10.1038/nprot.2008.194 · DOI
  31. Paul, 2015, Transcriptional heterogeneity and lineage commitment in myeloid progenitors, Cell, 163, 1663, 10.1016/j.cell.2015.11.013 · DOI · Paper page
  32. Polo, 2010, Cell type of origin influences the molecular and functional properties of mouse induced pluripotent stem cells, Nat. Biotechnol., 28, 848, 10.1038/nbt.1667 · DOI
  33. Sanjuan-Pla, 2013, Platelet-biased stem cells reside at the apex of the haematopoietic stem-cell hierarchy, Nature, 502, 232, 10.1038/nature12495 · DOI
  34. Shearstone, 2011, Global DNA demethylation during mouse erythropoiesis in vivo, Science, 334, 799, 10.1126/science.1207306 · DOI
  35. Sheffield, 2016, LOLA: enrichment analysis for genomic region sets and regulatory elements in R and Bioconductor, Bioinformatics, 32, 587, 10.1093/bioinformatics/btv612 · DOI
  36. Smallwood, 2011, Dynamic CpG island methylation landscape in oocytes and preimplantation embryos, Nat. Genet., 43, 811, 10.1038/ng.864 · DOI
  37. Smith, 2012, A unique regulatory phase of DNA methylation in the early mammalian embryo, Nature, 484, 339, 10.1038/nature10960 · DOI
  38. Spangrude, 1991, Hematopoietic stem-cell differentiation, Curr. Opin. Immunol., 3, 171, 10.1016/0952-7915(91)90046-4 · DOI
  39. Tanner, 2014, Humanized mice as a model to study human hematopoietic stem cell transplantation, Stem Cells Dev., 23, 76, 10.1089/scd.2013.0265 · DOI
  40. Theocharides, 2016, Humanized hemato-lymphoid system mice, Haematologica, 101, 5, 10.3324/haematol.2014.115212 · DOI
  41. Tijssen, 2011, Genome-wide analysis of simultaneous GATA1/2, RUNX1, FLI1, and SCL binding in megakaryocytes identifies hematopoietic regulators, Dev. Cell, 20, 597, 10.1016/j.devcel.2011.04.008 · DOI
  42. Till, 1980, Hemopoietic stem cell differentiation, Biochim. Biophys. Acta, 605, 431
  43. Vedi, 2016, Molecular landscapes of human hematopoietic stem cells in health and leukemia, Ann. N Y Acad. Sci., 1370, 5, 10.1111/nyas.12981 · DOI
  44. Wijetunga, 2014, The meta-epigenomic structure of purified human stem cell populations is defined at cis-regulatory sequences, Nat. Commun., 5, 5195, 10.1038/ncomms6195 · DOI
  45. Woolthuis, 2016, Hematopoietic stem/progenitor cell commitment to the megakaryocyte lineage, Blood, 127, 1242, 10.1182/blood-2015-07-607945 · DOI
  46. Zhang, 2016, Allelic reprogramming of the histone modification H3K4me3 in early mammalian development, Nature, 537, 553, 10.1038/nature19361 · DOI

Cited by

See all 289

Metadata

Authors
Farlik, M., Halbritter, F., Müller, F., Choudry, F. A., Ebert, P., Klughammer, J., Farrow, S., Santoro, A., Ciaurro, V., Mathur, A., Uppal, R., Stunnenberg, H. G., Ouwehand, W. H., Laurenti, E., Lengauer, T., Frontini, M., & Bock, C.
Venue
Cell Stem Cell
Publisher
Elsevier BV
Published
2016-12
Volume
19
Issue
6
Pages
808-822
ISSN
1934-5909
Cited by
289
References
11
Language
en
Funders
  • BLUEPRINT project
  • European Union’s Seventh Framework Programme (282510)
  • NIHR Cambridge Biomedical Research Centre
  • Austrian Academy of Sciences
  • Medical Research Council Clinical Training Fellowship (MR/K024043/1)
  • German Research Council (HA 7723/1-1)
  • DOC Fellowship of the Austrian Academy of Sciences
  • NIHR
  • BHF (PG-0310-1002, RG/09/12/28096)
  • NHS Blood and Transplant
  • Wellcome Trust Sir Henry Dale Fellowship (107630/Z/15/Z)
  • Wellcome Trust
  • MRC
  • BHF Cambridge Centre of Excellence (RE/13/6/30180)
  • New Frontiers Group
  • European Research Council (ERC) Starting Grant
  • European Union’s Horizon 2020 (679146)

About these checks

Registry, retraction, Cites and statistics results are computed, not judged, with one exception: a printed reference that no index lists is read once by a model before it counts as a citation error. Claims are extracted by a model and kept only when their quote appears verbatim in the text; each cited source is then checked, with a model’s help, for whether it says what the claim relies on. Those verdicts can be wrong — read the claim’s quote and the cited source before relying on one.

Statistics and arithmetic are recomputed, not judged.

Confidence bands are shown only for fields calibrated on our annotated test set. None is calibrated yet, so no band is shown.

What counts as a claim ›How we measure confidence ›How we check this ›

Are you an author, or do you see a problem with this page? Request a review