

The DOI matches its Crossref record; 82 of the 83 references it cites were found in a registry or an index.
Principles of signaling pathway modulation for enhancing human naive pluripotency induction
Open accessPublished version of a preprint
Abstract
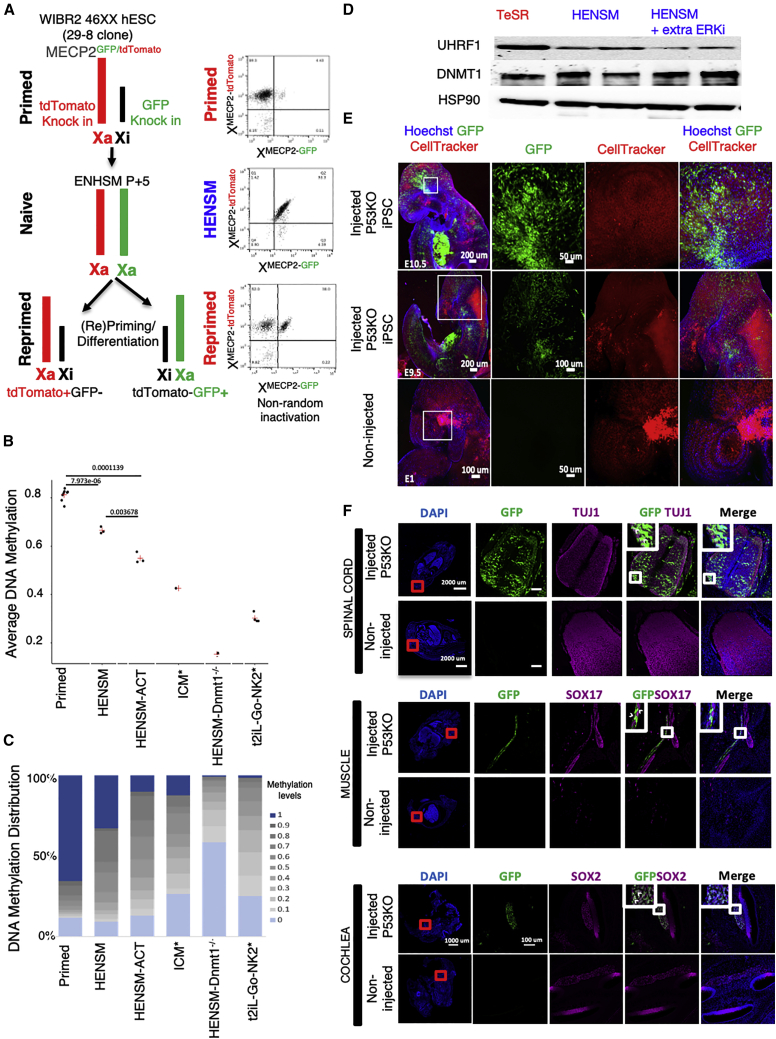
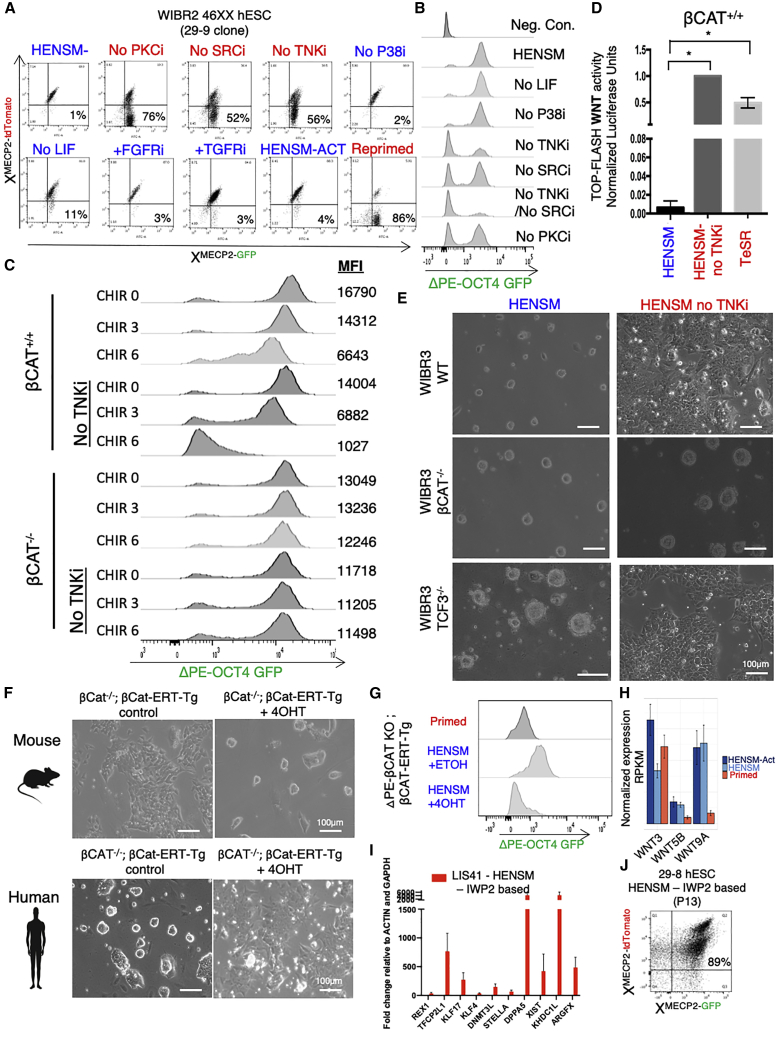
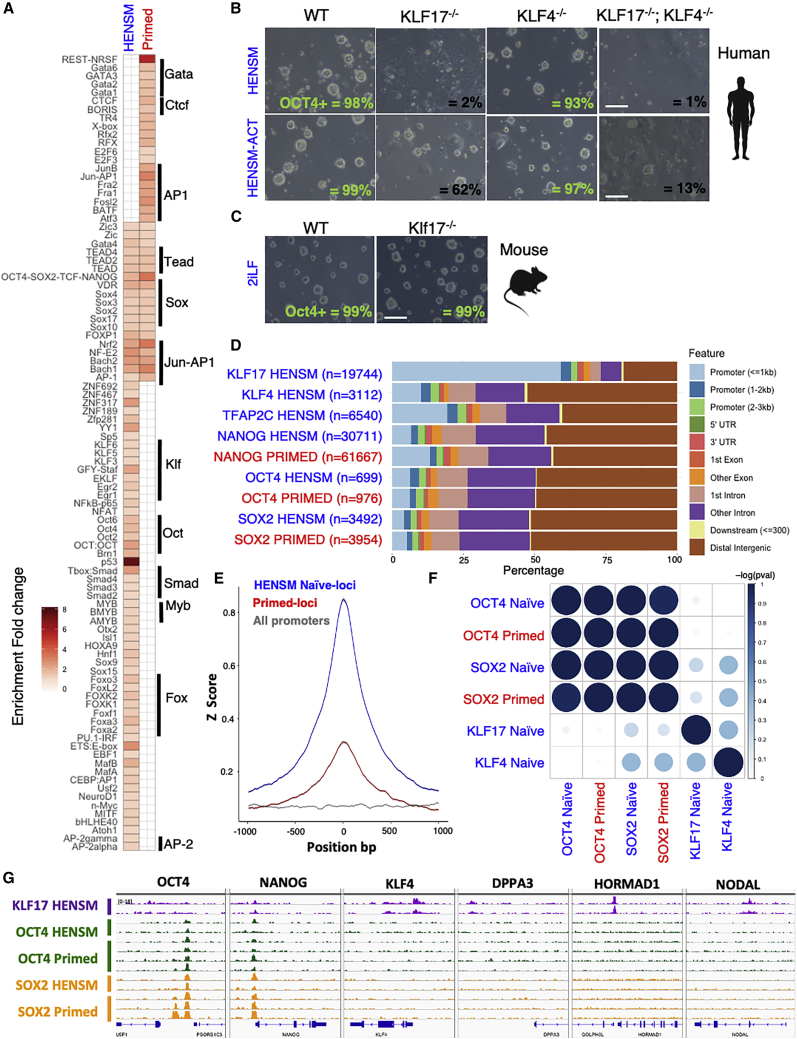
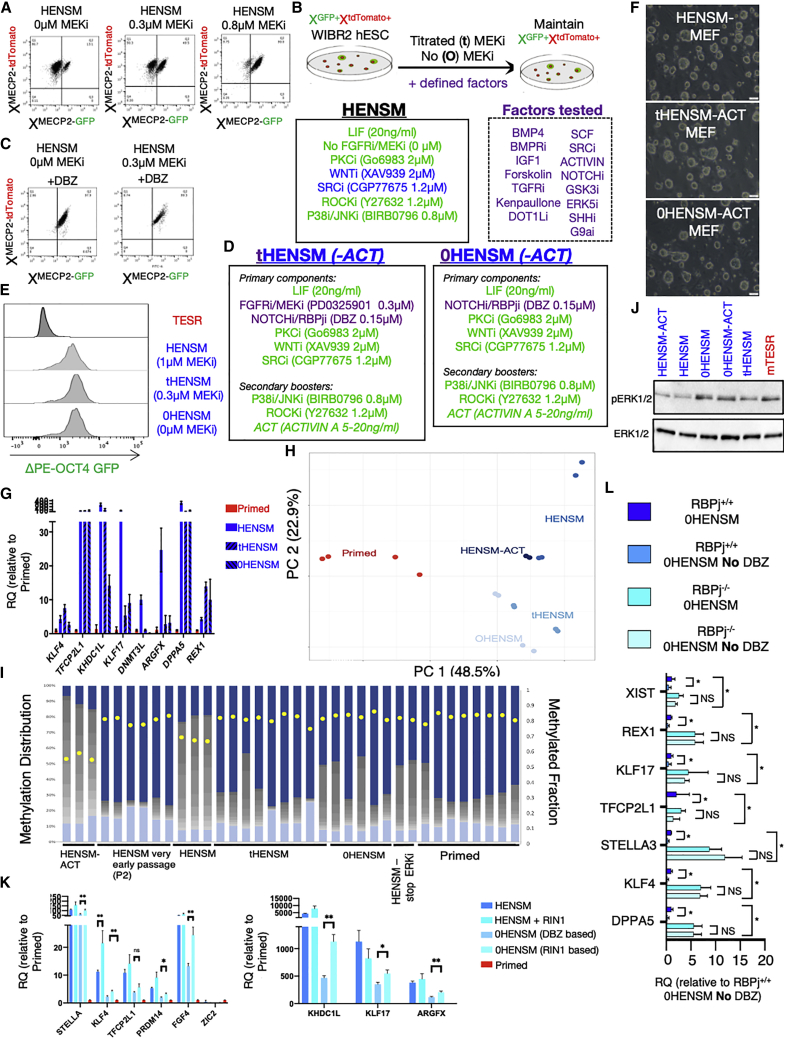
Abstract Different conditions have been devised to isolate MEK/ERK signalling independent human naïve pluripotent stem cells (PSCs) that are distinct from conventional primed PSCs and better correspond to pre-implantation developmental stages. While the naïve conditions described thus far endow human PSCs with different extents of naivety features, isolating human pluripotent cells that retain characteristics of ground state pluripotency while maintaining differentiation potential and genetic integrity, remains a major challenge. Here we engineer reporter systems that allow functional screening for conditions that can endow both the molecular and functional features expected from human naive pluripotency. We establish that simultaneous inhibition of SRC-NFκB, WNT/ßCATENIN and PKC signalling pathways is essential for enabling expansion of teratoma competent fully naïve human PSCs in defined or xeno-free conditions. Divergent signalling and transcriptional requirements for maintaining naïve pluripotency were found between mouse and human. Finally, we establish alternative naïve conditions in which MEK/ERK inhibition is substituted with inhibition for NOTCH/RBPj signalling, which allow obtaining alternative human naïve PSCs with diminished risk for loss of imprinting and deleterious global DNA hypomethylation. Our findings set a framework for the signalling foundations of human naïve pluripotency and may advance its utilization in future translational applications. Highlights of key findings Combined inhibition of SRC, WNT and PKC signaling consolidates human naïve pluripotency Stable expansion of DNA/RNA methylation-independent and TGF/ACTIVIN-independent human naïve PSCs Opposing roles for ACTIVIN and WNT/ßCATENIN signaling on mouse vs. human naive pluripotency 2i and MEK/ERKi independent alternative human naïve PSC conditions via inhibiting NOTCH/RBPj signaling
Overview
The claims and statistics of this paper haven’t been checked yet.
Run the check — free, no account needed. It reads the open-access text and checks the sources it cites.
Integrity signals
Registry
Cites
Statistics
Figures
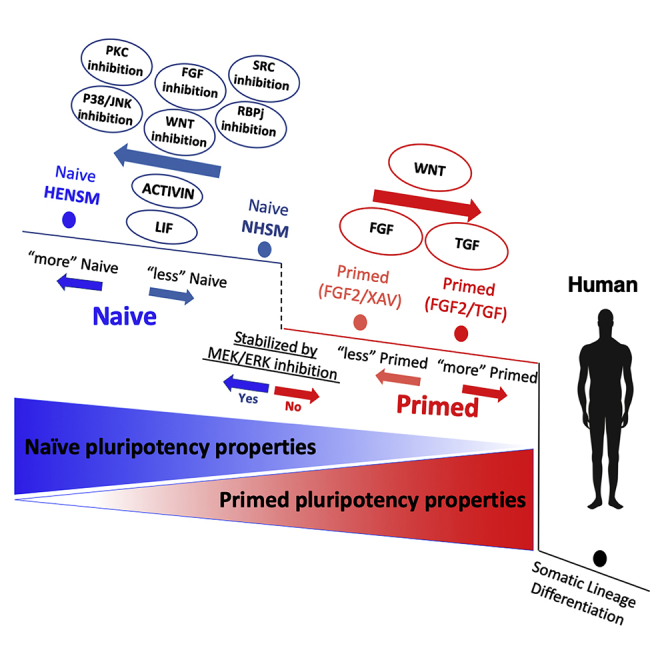
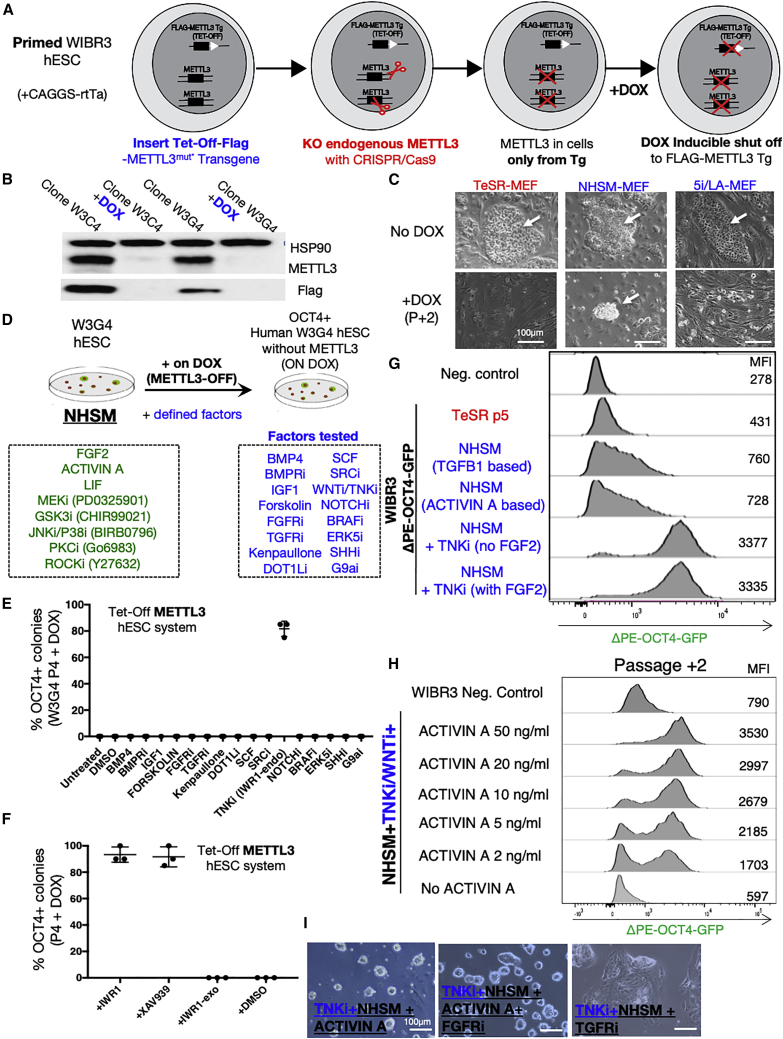
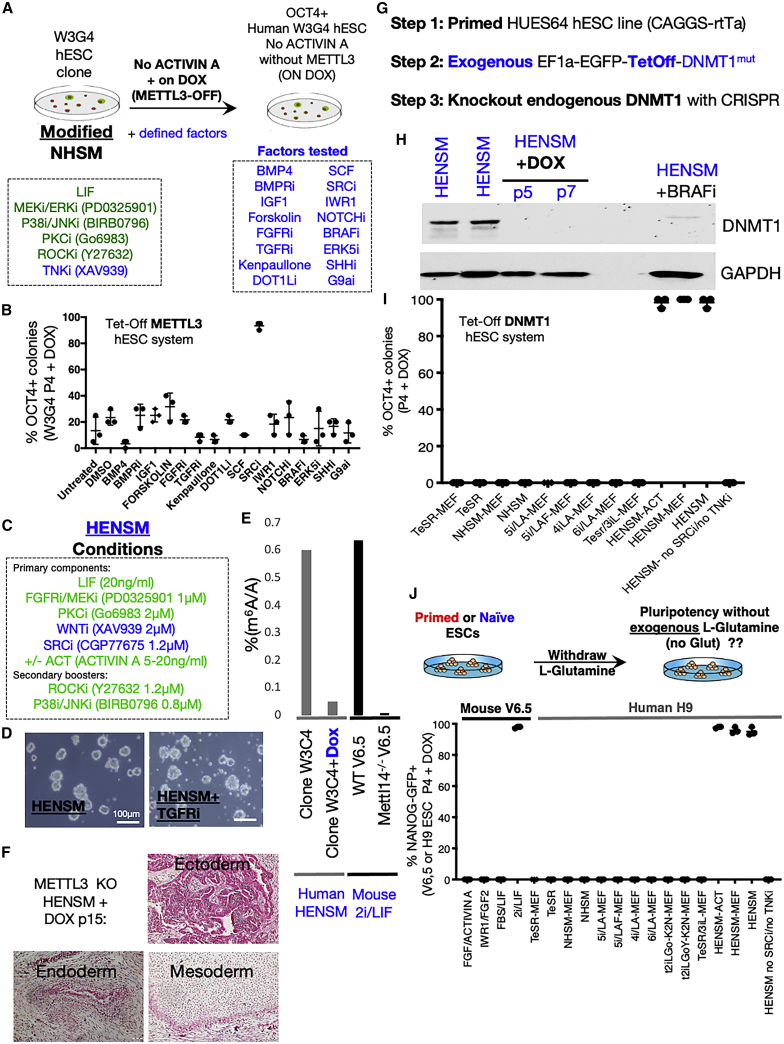
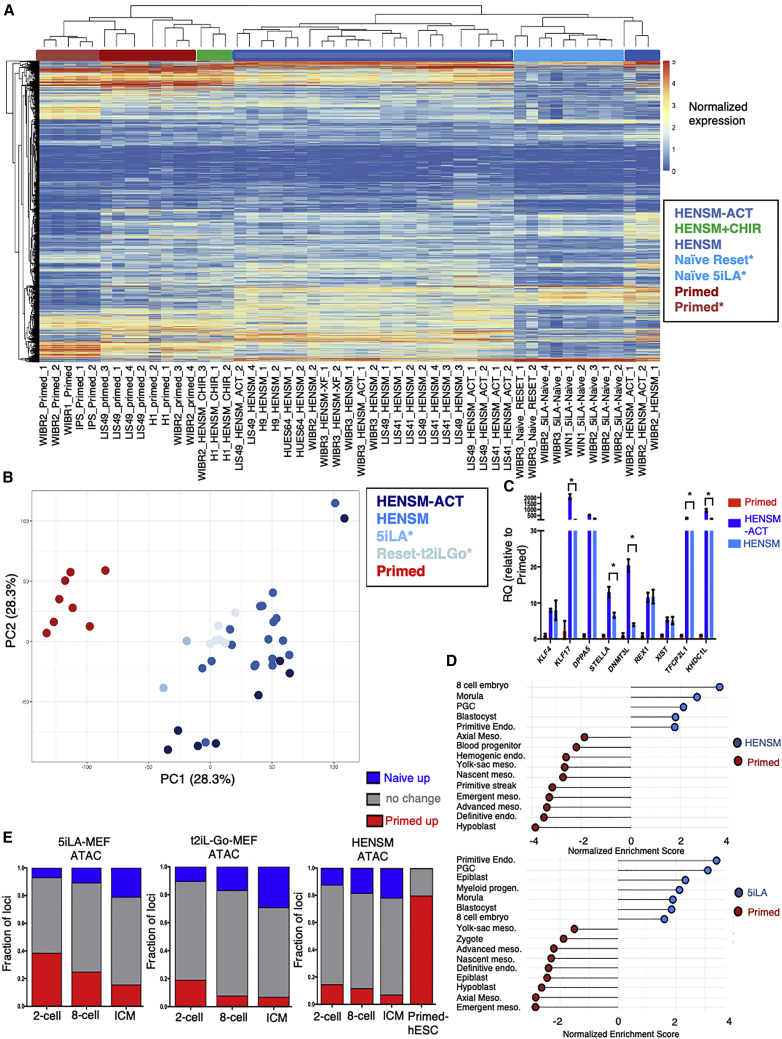
Verification
Claims the paper makes
The claims and statistics of this paper haven’t been checked yet.
Run the check — free, no account needed. It reads the open-access text and checks the sources it cites.
Claims other papers make about this one
Each is checked against this paper’s own text: does it say what the citing paper says it does?
In the citing paper
“TCA cycle activity also varies with PSC identity in human ESCs, which display glutamine independence and increased mitochondrial respiration upon conversion to a more naïve state (215, 216).”
From Regulation and function of the mammalian tricarboxylic acid cycle (2023) · cites this paper as [215]
Self-check
Percentages, sums and reported differences re-computed from the paper’s own numbers.
The self-check needs the paper’s full text.
Citations
Cites
The ground state of embryonic stem cell self-renewal
Ying, Q.-L., Wray, J., Nichols, J., Batlle-Morera, L., Doble, B., Woodgett, J., Cohen, P., & Smith, A. (2008) · Nature · doi:10.1038/nature06968 · Cited by 3,442
Tankyrase inhibition stabilizes axin and antagonizes Wnt signalling
Huang, S.-M. A., Mishina, Y., Liu, S.-M., Cheung, A. K., Stegmeier, F., Michaud, G., Charlat, O., Wiellette, E., Zhang, Y., Wiessner, S., et al. (2009) · Nature · doi:10.1038/nature08356 · Cited by 2,077
Derivation of pluripotent epiblast stem cells from mammalian embryos
Brons, I. G. M., Smithers, L. E., Trotter, M. W. B., Rugg‐Gunn, P. J., Sun, B., Lopes, S. M. C. D. S., Howlett, S., Clarkson, A., Ährlund‐Richter, L., Pedersen, R. A., et al. (2007) · Nature · doi:10.1038/nature05950 · Cited by 2,007
Naive and Primed Pluripotent States
Nichols, J., & Smith, A. G. (2009) · Cell stem cell · doi:10.1016/j.stem.2009.05.015 · Cited by 1,835
Single-cell RNA-Seq profiling of human preimplantation embryos and embryonic stem cells
Yan, L., Yang, M., Guo, H., Yang, L., Wu, J., Li, R., Liu, P., Lian, Y., Zheng, X., Yan, J., et al. (2013) · Nature Structural & Molecular Biology · doi:10.1038/nsmb.2660 · Cited by 1,740
m 6 A mRNA methylation facilitates resolution of naïve pluripotency toward differentiation
Geula, S., Moshitch-Moshkovitz, S., Dominissini, D., Mansour, A. A., Kol, N., Salmon‐Divon, M., Hershkovitz, V., Peer, E., Mor, N., Manor, Y. S., et al. (2015) · Science · doi:10.1126/science.1261417 · Cited by 1,583
Reconstitution of the Mouse Germ Cell Specification Pathway in Culture by Pluripotent Stem Cells
Hayashi, K., Ohta, H., Kurimoto, K., Aramaki, S., & Saitou, M. (2011) · Cell · doi:10.1016/j.cell.2011.06.052 · Cited by 1,413
Single-Cell RNA-Seq Reveals Lineage and X Chromosome Dynamics in Human Preimplantation Embryos
Petropoulos, S., Edsgärd, D., Reinius, B., Deng, Q., Panula, S. P., Codeluppi, S., Plaza Reyes, A., Linnarsson, S., Sandberg, R., & Lanner, F. (2016) · Cell · doi:10.1016/j.cell.2016.03.023 · Cited by 1,063
Derivation of novel human ground state naive pluripotent stem cells
Gafni, O., Weinberger, L., Mansour, A. A., Manor, Y. S., Chomsky, E., Ben‐Yosef, D., Kalma, Y., Viukov, S. V., Maza, I., Zviran, A., et al. (2013) · Nature · doi:10.1038/nature12745 · Cited by 1,058
Intracellular α-ketoglutarate maintains the pluripotency of embryonic stem cells
Carey, B. W., Finley, L. W. S., Cross, J. R., Allis, C. D., & Thompson, C. B. (2015) · Nature · doi:10.1038/nature13981 · Cited by 1,007
Cited by
Sorted by citations
Regulation and function of the mammalian tricarboxylic acid cycle
Arnold, P. K., & Finley, L. W. S. (2023) · Journal of Biological Chemistry · doi:10.1016/j.jbc.2022.102838 · Cited by 535
“TCA cycle activity also varies with PSC identity in human ESCs, which display glutamine independence and increased mitochondrial respiration upon conversion to a more naïve state (215, 216).”
BackgroundRolling back human pluripotent stem cells to an eight-cell embryo-like stage
Mazid, M. A., Ward, C., Luo, Z., Liu, C., Li, Y., Lai, Y., Wu, L. L., Li, J., Jia, W., Jiang, Y., et al. (2022) · Nature · doi:10.1038/s41586-022-04625-0 · Cited by 259
Post-gastrulation synthetic embryos generated ex utero from mouse naive ESCs
Tarazi, S., Aguilera-Castrejon, A., Joubran, C., Ghanem, N., Ashouokhi, S., Roncato, F., Wildschutz, E., Haddad, M., Oldak, B., Gomez-Cesar, E., et al. (2022) · Cell · doi:10.1016/j.cell.2022.07.028 · Cited by 246
Complete human day 14 post-implantation embryo models from naive ES cells
Oldak, B., Wildschutz, E., Bondarenko, V., Comar, M.-Y., Zhao, C., Aguilera-Castrejon, A., Tarazi, S., Viukov, S. V., Pham, T. X. A., Ashouokhi, S., et al. (2023) · Nature · doi:10.1038/s41586-023-06604-5 · Cited by 232
WNT and NOTCH signaling in human trophoblast development and differentiation
Dietrich, B., Haider, S., Meinhardt, G., Pollheimer, J., & Knöfler, M. (2022) · Cellular and Molecular Life Sciences · doi:10.1007/s00018-022-04285-3 · Cited by 141
A patterned human neural tube model using microfluidic gradients
Xue, X., Kim, Y. S., Ponce, I., O’Laughlin, R., Yan, R. Z., Kobayashi, N., Tshuva, R. Y., Tsai, Y.-H., Sun, S., Zheng, Y., et al. (2024) · Nature · doi:10.1038/s41586-024-07204-7 · Cited by 123
Chimeric contribution of human extended pluripotent stem cells to monkey embryos ex vivo
Tan, T., Wu, J., Si, C., Dai, S., Zhang, Y., Sun, N., Zhang, E., Shao, H., Si, W., Yang, P., et al. (2021) · Cell · doi:10.1016/j.cell.2021.03.020 · Cited by 132
Metabolic regulation of the hallmarks of stem cell biology
Jackson, B. T., & Finley, L. W. S. (2024) · Cell stem cell · doi:10.1016/j.stem.2024.01.003 · Cited by 132
Dissecting peri-implantation development using cultured human embryos and embryo-like assembloids
Ai, Z., Niu, B., Yin, Y., Xiang, L., Shi, G., Duan, K., Wang, S., Hu, Y., Zhang, C., Zhang, C., et al. (2023) · Cell Research · doi:10.1038/s41422-023-00846-8 · Cited by 108
Cell competition constitutes a barrier for interspecies chimerism
Zheng, C., Hu, Y., Sakurai, M., Pinzón-Arteaga, C. A., Li, J., Wei, Y., Okamura, D., Ravaux, B., Barlow, H. R., Yu, L., et al. (2021) · Nature · doi:10.1038/s41586-021-03273-0 · Cited by 105
Recapitulating early human development with 8C-like cells
Xiu, Y., Liang, S., Chen, M., Yu, H., Li, R., Qu, Y., Kong, X., Guo, R., Zheng, R., Izsvák, Z., et al. (2022) · Cell Reports · doi:10.1016/j.celrep.2022.110994 · Cited by 96
Molecular Mechanisms Underlying Pluripotency and Self-Renewal of Embryonic Stem Cells
Varzideh, F., Gambardella, J., Kansakar, U., Jankauskas, S. S., & Santulli, G. (2023) · International Journal of Molecular Sciences · doi:10.3390/ijms24098386 · Cited by 99
Hallmarks of totipotent and pluripotent stem cell states
Du, P., & Wu, J. (2024) · Cell stem cell · doi:10.1016/j.stem.2024.01.009 · Cited by 92
Chemical reprogramming for cell fate manipulation: Methods, applications, and perspectives
Wang, J., Sun, S., & Deng, H. (2023) · Cell Stem Cell · doi:10.1016/j.stem.2023.08.001 · Cited by 91
Pera, M. F., & Rossant, J. (2021) · Cell stem cell · doi:10.1016/j.stem.2021.10.001 · Cited by 86
Integrated multi-omics reveal polycomb repressive complex 2 restricts human trophoblast induction
Zijlmans, D. W., Talón, I., Verhelst, S., Bendall, A., van Nerum, K., Javali, A., Malcolm, A. A., van Knippenberg, S. S. F. A., Biggins, L., To, S. K., et al. (2022) · Nature Cell Biology · doi:10.1038/s41556-022-00932-w · Cited by 78
Modeling human embryo development with embryonic and extra-embryonic stem cells
Weatherbee, B. A. T., Cui, T., & Zernicka‐Goetz, M. (2020) · Developmental Biology · doi:10.1016/j.ydbio.2020.12.010 · Cited by 79
Early human development and stem cell-based human embryo models
Shahbazi, M. N., & Pasque, V. (2024) · Cell stem cell · doi:10.1016/j.stem.2024.09.002 · Cited by 81
Wang, J., Xie, W., Li, N., Li, W., Zhang, Z., Fan, N., Ouyang, Z., Zhao, Y., Lai, C., Li, H., et al. (2023) · Cell stem cell · doi:10.1016/j.stem.2023.08.003 · Cited by 69
TGFβ signalling is required to maintain pluripotency of human naïve pluripotent stem cells
Osnato, A., Brown, S. E., Krueger, C., Andrews, S., Collier, A. J., Nakanoh, S., Londoño, M. Q., Wesley, B. T., Muraro, D., Brumm, A. S., et al. (2021) · eLife · doi:10.7554/elife.67259 · Cited by 61
Carter, T. A., Singh, M., Dumbović, G., Chobirko, J. D., Rinn, J. L., & Feschotte, C. (2022) · eLife · doi:10.7554/elife.76257 · Cited by 61
mTOR activity paces human blastocyst stage developmental progression
Iyer, D. P., Khoei, H. H., van der Weijden, V. A., Kagawa, H., Pradhan, S. J., Novatchkova, M., McCarthy, A., Rayón, T., Simon, C. S., Dunkel, I., et al. (2024) · Cell · doi:10.1016/j.cell.2024.08.048 · Cited by 56
Simunovic, M., Siggia, E. D., & Brivanlou, A. H. (2022) · Cell stem cell · doi:10.1016/j.stem.2022.05.001 · Cited by 56
Human primed and naïve PSCs are both able to differentiate into trophoblast stem cells
Viukov, S. V., Shani, T., Bayerl, J., Aguilera-Castrejon, A., Oldak, B., Sheban, D., Tarazi, S., Stelzer, Y., Hanna, J. H., & Novershtern, N. (2022) · Stem Cell Reports · doi:10.1016/j.stemcr.2022.09.008 · Cited by 63
Zheng, C., Ballard, E. B., & Wu, J. (2021) · Development · doi:10.1242/dev.195792 · Cited by 49
Generating human blastoids modeling blastocyst-stage embryos and implantation
Khoei, H. H., Javali, A., Kagawa, H., Sommer, T. M., Sestini, G., David, L., Slováková, J., Novatchkova, M., Reimer, Y. S. O., & Rivron, N. C. (2023) · Nature Protocols · doi:10.1038/s41596-023-00802-1 · Cited by 54
Overcoming Chemotherapy Resistance in Germ Cell Tumors
Országhová, Z., Kaľavská, K., Mego, M., & Chovanec, M. (2022) · Biomedicines · doi:10.3390/biomedicines10050972 · Cited by 42
Induction and application of human naive pluripotency
Zhou, J., Hu, J., Wang, Y., & Gao, S. (2023) · Cell Reports · doi:10.1016/j.celrep.2023.112379 · Cited by 42
A new era of stem cell and developmental biology: from blastoids to synthetic embryos and beyond
Kim, Y., Kim, I. S., & Shin, K. (2023) · Experimental & Molecular Medicine · doi:10.1038/s12276-023-01097-8 · Cited by 44
Toward developing human organs via embryo models and chimeras
Wu, J., & Fu, J. (2024) · Cell · doi:10.1016/j.cell.2024.05.027 · Cited by 40
Bi, Y., Tu, Z., Zhou, J., Zhu, X., Wang, H., Gao, S., & Wang, Y. (2022) · Nature Communications · doi:10.1038/s41467-022-30924-1 · Cited by 36
Live birth of chimeric monkey with high contribution from embryonic stem cells
Cao, J., Li, W., Li, J., Mazid, M. A., Li, C., Jiang, Y., Jia, W., Wu, L. L., Liao, Z., Sun, S., et al. (2023) · Cell · doi:10.1016/j.cell.2023.10.005 · Cited by 38
Alves-Lopes, J. P., Wong, F. C. K., Tang, W. W. C., Gruhn, W. H., Ramakrishna, N. B., Jowett, G. M., Jahnukainen, K., & Surani, M. A. (2023) · Cell Reports · doi:10.1016/j.celrep.2022.111907 · Cited by 36
LINE1 and PRC2 control nucleolar organization and repression of the 8C state in human ESCs
Zhang, J., Ataei, L., Mittal, K., Wu, L. L., Caldwell, L., Huynh, L., Sarajideen, S., Tse, K. Y., Simon, M.-M., Mazid, M. A., et al. (2024) · Developmental Cell · doi:10.1016/j.devcel.2024.09.024 · Cited by 34
Wang, X., Song, C., Ye, Y., Gu, Y., Li, X., Chen, P., Leng, D., Xiao, J., Wu, H., Xie, S., et al. (2023) · Nucleic Acids Research · doi:10.1093/nar/gkad907 · Cited by 30
KLF17 promotes human naïve pluripotency but is not required for its establishment
Lea, R. A., McCarthy, A., Boeing, S., Fallesen, T. L., Elder, K. T., Snell, P., Christie, L., Adkins, S., Shaikly, V., Taranissi, M., et al. (2021) · Development · doi:10.1242/dev.199378 · Cited by 26
TFEB controls syncytiotrophoblast formation and hormone production in placenta
Cesana, M., Tufano, G., Panariello, F., Zampelli, N., Soldati, C., Mutarelli, M., Montefusco, S., Grieco, G., Sepe, L. V., Rossi, B., et al. (2024) · Cell Death and Differentiation · doi:10.1038/s41418-024-01337-y · Cited by 26
Establishment of human induced trophoblast stem cells via reprogramming of fibroblasts
Tan, J. P., Liu, X., & Polo, J. M. (2022) · Nature Protocols · doi:10.1038/s41596-022-00742-2 · Cited by 26
Suppression of YAP safeguards human naïve pluripotency
Dattani, A., Huang, T., Liddle, C., Smith, A. G., & Guo, G. (2022) · Development · doi:10.1242/dev.200988 · Cited by 26
van Nerum, K., Wenzel, A., Argemi‐Muntadas, L., Kafkia, E., Drews, A., Brun, I. S., Lavro, V., Roelofsen, A., Stamidis, N., Bagés‐Arnal, S., et al. (2025) · Nature Cell Biology · doi:10.1038/s41556-025-01658-1 · Cited by 25
Ito, J., Seita, Y., Kojima, S., Parrish, N. F., Sasaki, K., & Sato, K. (2022) · PLoS Genetics · doi:10.1371/journal.pgen.1009846 · Cited by 25
Generation of rat forebrain tissues in mice
Huang, J., He, B., Yang, X., Long, X., Wei, Y., Li, L., Tang, M., Gao, Y., Fang, Y., Ying, W., et al. (2024) · Cell · doi:10.1016/j.cell.2024.03.017 · Cited by 28
VGLL1 cooperates with TEAD4 to control human trophectoderm lineage specification
Yang, Y., Jia, W., Luo, Z., Li, Y., Liu, H., Fu, L., Li, J., Jiang, Y., Lai, J., Li, H., et al. (2024) · Nature Communications · doi:10.1038/s41467-024-44780-8 · Cited by 25
Collier, A. J., Bendall, A., Fabian, C., Malcolm, A. A., Tilgner, K., Semprich, C. I., Wojdyła, K., Nisi, P. S., Kishore, K., Franklin, V. N. R., et al. (2022) · Science Advances · doi:10.1126/sciadv.abk0013 · Cited by 21
Amino acid intake strategies define pluripotent cell states
Todorova, P. K., Jackson, B. T., Garg, V., Paras, K. I., Brunner, J. S., Bridgeman, A. E., Chen, Y., Baksh, S. C., Yan, J., Hadjantonakis, A., et al. (2024) · Nature Metabolism · doi:10.1038/s42255-023-00940-6 · Cited by 21
From Mice to Men: Generation of Human Blastocyst-Like Structures In Vitro
Luijkx, D. G., Shankar, V., van Blitterswijk, C., Giselbrecht, S., & Vrij, E. (2022) · Frontiers in Cell and Developmental Biology · doi:10.3389/fcell.2022.838356 · Cited by 19
Bouchereau, W., Jouneau, L., Archilla, C., Aksoy, I., Moulin, A., Daniel, N., Peynot, N., Caldérari, S., Joly, T., Godet, M., et al. (2022) · Development · doi:10.1242/dev.200538 · Cited by 19
Zhu, Q., Wang, F., Gao, D., Gao, J., Li, G., Jiao, D., Zhu, G., Xu, K., Guo, J., Chen, T., et al. (2023) · Cell Proliferation · doi:10.1111/cpr.13487 · Cited by 17
Yılmaz, A., Gurhan, G., Comar, M.-Y., Viukov, S. V., Serfaty, I., Gayretli, M., Golenchenko, S., Lokshtanov, D., Ashouokhi, S., Polanco, A., et al. (2025) · Cell Stem Cell · doi:10.1016/j.stem.2025.07.005 · Cited by 15
Selective RNA sequestration in biomolecular condensates directs cell fate transitions
Pessina, P., Nevo, M., Shi, J., Kodali, S., Casas, E., Cui, Y., Richards, A., Park, E. J., Chen, X., Levin-Ferreyra, F., et al. (2025) · Nature Biotechnology · doi:10.1038/s41587-025-02853-z · Cited by 23
Recent advances in understanding cell types during human gastrulation
Tyser, R. C. V., & Srinivas, S. (2022) · Seminars in Cell and Developmental Biology · doi:10.1016/j.semcdb.2022.05.004 · Cited by 21
Manipulating cell fate through reprogramming: approaches and applications
Yagi, M., Horng, J. E., & Hochedlinger, K. (2024) · Development · doi:10.1242/dev.203090 · Cited by 17
New insights into the epitranscriptomic control of pluripotent stem cell fate
Hyun, Y. S., Lee, H.-J., & Kim, Y. J. (2022) · Experimental & Molecular Medicine · doi:10.1038/s12276-022-00824-x · Cited by 17
Chen, A. C. H., Lee, Y. L., Ruan, H., Huang, W. M., Fong, S. W., Tian, S. I. P., Lee, K. C., Wu, G. M., Tan, Y., Wong, T. C. H., et al. (2023) · Advanced Science · doi:10.1002/advs.202204797 · Cited by 16
Chemical conversion of human conventional PSCs to TSCs following transient naive gene activation
Zorzan, I., Betto, R. M., Rossignoli, G., Arboit, M., Drusin, A., Corridori, C., Martini, P. G. V., & Martello, G. (2023) · EMBO Reports · doi:10.15252/embr.202255235 · Cited by 16
Mechanisms of human germ cell development
Saitou, M., Nagano, M., & Mizuta, K. (2025) · Nature Reviews Molecular Cell Biology · doi:10.1038/s41580-025-00893-6 · Cited by 15
Zhang, Y., Zhang, H., Li, Y., Liang, G., Zhu, C., Wang, Y., Ji, S., He, C., Sun, J., & Zhang, J. (2023) · Reproductive BioMedicine Online · doi:10.1016/j.rbmo.2023.06.004 · Cited by 15
Capturing Pluripotency and Beyond
Yeh, C.-Y., Huang, W., Chen, H., & Meir, Y. J. (2021) · Cells · doi:10.3390/cells10123558 · Cited by 16
Generation and characterization of mature hepatocyte organoids for liver metabolic studies
Liu, Y., Zhou, Y., Ahodantin, J., Jin, Y., Zhu, J., Sun, Z., Wu, X., Su, L., & Yang, Y. (2024) · Journal of Cell Science · doi:10.1242/jcs.261961 · Cited by 17
Chemical-based epigenetic reprogramming to advance pluripotency and totipotency
Wen, S., Zheng, R., Cai, C., & Jiang, W. (2025) · Nature Chemical Biology · doi:10.1038/s41589-025-01874-8 · Cited by 14
Research progress and application prospects of stable porcine pluripotent stem cells
Zhang, J., Zhi, M., Gao, D., Zhu, Q., Gao, J., Zhu, G., Cao, S., & Han, J. (2022) · Biology of Reproduction · doi:10.1093/biolre/ioac119 · Cited by 13
The building blocks of embryo models: embryonic and extraembryonic stem cells
Ren, H., Jia, X.-J., & Yu, L. (2025) · Cell Discovery · doi:10.1038/s41421-025-00780-6 · Cited by 12
Xiao, Y., Sosa, F., Ross, P. J., Diffenderfer, K. E., & Hansen, P. J. (2021) · Biology Open · doi:10.1242/bio.058669 · Cited by 13
Stem cells used to model a two-week-old human embryo
Moris, N. (2023) · Nature · doi:10.1038/d41586-023-03150-y · Cited by 12
Delay of human early development via in vitro diapausePreprint
Iyer, D. P., van der Weijden, V. A., Khoei, H. H., McCarthy, A., Rayón, T., Simon, C. S., Dunkel, I., Wamaitha, S. E., Elder, K. T., Snell, P., et al. (2023) · bioRxiv (Cold Spring Harbor Laboratory) · doi:10.1101/2023.05.29.541316 · Cited by 14
METTL3 safeguards cell identity and epigenome of human trophoblast stem cells
Fu, H., Chen, C. L., Huang, Y., Zhang, W., Li, S., Chan, F.-F., Xu, L., Ruan, D., Ouyang, X., Ma, L., et al. (2025) · Nature Communications · doi:10.1038/s41467-025-67484-z · Cited by 12
Tu, Z., Bi, Y., Mao, T., Wang, H., Gao, S., & Wang, Y. (2023) · Cell Regeneration · doi:10.1186/s13619-023-00179-2 · Cited by 12
Ma, J., Xia, M., Guo, J., Li, W., Sun, S., & Chen, B. (2024) · Stem Cells Translational Medicine · doi:10.1093/stcltm/szae030 · Cited by 11
An expedition in the jungle of pluripotent stem cells of non-human primates
Anwised, P., Moorawong, R., Samruan, W., Somredngan, S., Srisutush, J., Laowtammathron, C., Aksoy, I., Parnpai, R., & Savatier, P. (2023) · Stem Cell Reports · doi:10.1016/j.stemcr.2023.09.013 · Cited by 11
Pluripotent cell states and fates in human embryo models
Sözen, B., Tam, P., & Pera, M. F. (2025) · Development · doi:10.1242/dev.204565 · Cited by 10
Intracellular metabolic gradients dictate dependence on exogenous pyruvate
Jackson, B. T., Montero, A. M., Chakraborty, S., Brunner, J. S., Arnold, P. K., Bridgeman, A. E., Todorova, P. K., Paras, K. I., & Finley, L. W. S. (2025) · Nature Metabolism · doi:10.1038/s42255-025-01289-8 · Cited by 10
Zhang, W., Fu, H., Huang, Y., Zeng, M., Ouyang, X., Wang, X., Ruan, D., Ma, L., Hu, X., Guo, J., et al. (2025) · Nucleic Acids Research · doi:10.1093/nar/gkaf349 · Cited by 10
Pham, H.-T., Perold, F., Pijoff, Y., Doerflinger, N., Rival‐Gervier, S., Givelet, M., Moulin, A., Ressaire, M., Fernandes, E. D. S., Bidault, V., et al. (2025) · Nature Communications · doi:10.1038/s41467-025-60314-2 · Cited by 10
Pluripotency Dynamics during Embryogenesis and in Cell Culture
Gordeev, M. N., Bakhmet, E. I., & Tomilin, A. N. (2021) · Russian Journal of Developmental Biology · doi:10.1134/s1062360421060059 · Cited by 10
Dupont, C. (2024) · Frontiers in Cell and Developmental Biology · doi:10.3389/fcell.2024.1386739 · Cited by 10
Unde venisti PGRMC? Grand-Scale Biology from Early Eukaryotes and Eumetazoan Animal Origins
Cahill, M. A. (2022) · Frontiers in Bioscience-Landmark · doi:10.31083/j.fbl2711317 · Cited by 9
Current state of stem cell research in non-human primates: an overview
Wu, J., Shi, Y., Yang, S., Tang, Z., Li, Z., Li, Z., Zuo, J., Ji, W., & Niu, Y. (2023) · Medical Review · doi:10.1515/mr-2023-0035 · Cited by 9
O-GlcNAcase regulates pluripotency states of human embryonic stem cells
Liu, Q., Chen, C., Fan, Z., Song, H., Sha, Y., Yu, L., Wang, Y., Qin, W., & Yi, W. (2024) · Stem Cell Reports · doi:10.1016/j.stemcr.2024.05.009 · Cited by 8
Wu, H., & Wang, H. (2026) · Nature Reviews Molecular Cell Biology · doi:10.1038/s41580-025-00942-0 · Cited by 8
KLF17 promotes human naive pluripotency through repressing MAPK3 and ZIC2
Wang, S., Hao, J., Zhang, C., Duan, F., Chiu, Y.-T., Shi, M., Huang, X., Yang, J., Cao, H., & Wang, Y. (2022) · Science China Life Sciences · doi:10.1007/s11427-021-2076-x · Cited by 9
Kshirsagar, A., Doroshev, S., Gorelik, A., Olender, T., Sapir, T., Tsuboi, D., Rosenhek‐Goldian, I., Malitsky, S., Itkin, M., Argoetti, A., et al. (2023) · Nature Communications · doi:10.1038/s41467-023-38797-8 · Cited by 8
The nuclear matrix stabilizes primed-specific genes in human pluripotent stem cells
Ma, G., Fu, X., Zhou, L. B., Babarinde, I. A., Shi, L., Yang, W., Chen, J., Xiao, Z., Qiao, Y., Ma, L., et al. (2025) · Nature Cell Biology · doi:10.1038/s41556-024-01595-5 · Cited by 9
Deconstructing human peri-implantation embryogenesis based on embryos and embryoids
Ai, Z., Yin, Y., Niu, B., & Li, T. (2022) · Biology of Reproduction · doi:10.1093/biolre/ioac096 · Cited by 6
Short C-terminal Musashi-1 proteins regulate pluripotency states in embryonic stem cells
Chen, Y., Chen, Y., Li, Q., Liu, H., Han, J., Zhang, H., Cheng, L., & Lin, G. (2023) · Cell Reports · doi:10.1016/j.celrep.2023.113308 · Cited by 7
In vitro models of human hypoblast and mouse primitive endoderm
Perera, M., & Brickman, J. M. (2023) · Current Opinion in Genetics & Development · doi:10.1016/j.gde.2023.102115 · Cited by 7
Viukov, S. V., Shani, T., Bayerl, J., Sheban, D., Stelzer, Y., Novershtern, N., & Hanna, J. H. (2022) · bioRxiv (Cold Spring Harbor Laboratory) · doi:10.1101/2022.05.20.492766 · Cited by 7
Human and Pig Pluripotent Stem Cells: From Cellular Products to Organogenesis and Beyond
Xuan, Y., Petersen, B., & Liu, P. (2023) · Cells · doi:10.3390/cells12162075 · Cited by 6
Matsuo‐Takasaki, M., Kambayashi, S., Hemmi, Y., Wakabayashi, T., Shimizu, T., An, Y., Ito, H., Takeuchi, K., Ibuki, M., Kawashima, T., et al. (2024) · eLife · doi:10.7554/elife.89724.3 · Cited by 5
EIF3D safeguards the homeostasis of key signaling pathways in human primed pluripotency
Okubo, C., Nakamura, M., Sato, M., Shichino, Y., Mito, M., Takashima, Y., Iwasaki, S., & Takahashi, K. (2025) · Science Advances · doi:10.1126/sciadv.adq5484 · Cited by 5
H3K27ac Is Essential for Human Naive Pluripotency Modulated by m6A‐Driven EP300 Expression
An, C., Zhong, K., Kang, X., Zhang, Y., Shang, Y., Liu, H., Ji, Y., Zeng, J., Lin, J., Jin, L. G., et al. (2025) · Advanced Science · doi:10.1002/advs.202507549 · Cited by 5
Ross, C., Balestrini, P. A., Bates, L. E., Azami, T., Adakole, T., Semple, M. J., Salonna, M., Gyuris, R., Nichols, J., Fogarty, N. E., et al. (2025) · Journal of Cell Science · doi:10.1242/jcs.264257 · Cited by 5
Yang, J., Yang, Y., Zhang, X., Yan, C., Jiang, L., Zhang, D., & Jiang, W. (2025) · Cell Reports · doi:10.1016/j.celrep.2025.116414 · Cited by 5
The road to restore male fertility using in vitro -derived germ cells
Macedo, T., & Alves-Lopes, J. P. (2025) · Human Reproduction Update · doi:10.1093/humupd/dmaf029 · Cited by 5
Baral, I., Shirude, M. B., Jothi, D. L., Mukherjee, A., & Dutta, D. (2023) · Stem Cell Reviews and Reports · doi:10.1007/s12015-023-10513-5 · Cited by 5
Current Status of Synthetic Mammalian Embryo Models
Kim, H., & Kim, E. (2024) · International Journal of Molecular Sciences · doi:10.3390/ijms252312862 · Cited by 5
Hua, L., Peng, Y., Yan, L., Yuan, P., & Qiao, J. (2025) · Human Reproduction Update · doi:10.1093/humupd/dmaf006 · Cited by 4
ELABELA targets the MEK/ERK axis to enhance trophoblast invasion in early-onset preeclampsia
Wang, L., Wang, X., He, N., Yang, L., Zou, Y., Weng, Z., & Guo, L. (2025) · Scientific Reports · doi:10.1038/s41598-025-15533-4 · Cited by 4
Wang, D., Ming, H., Yang, D., Cui, X., Freeman, Z., Tsai, L., Wei, Z., Liu, L., Scatolin, G. N., Bennett, B., et al. (2026) · Cell Research · doi:10.1038/s41422-026-01276-y · Cited by 4
Alves-Lopes, J. P., Wong, F. C. K., & Surani, M. A. (2024) · Nature Protocols · doi:10.1038/s41596-023-00945-1 · Cited by 4
Parikh, C. R., Glenn, R. A., Shi, Y., Chatterjee, K., Kasliwal, K., Swanzey, E., Singer, S., Do, S. C., Zhan, Y. A., Furuta, Y., et al. (2025) · Stem Cell Reports · doi:10.1016/j.stemcr.2025.102450 · Cited by 4
Metadata
- Authors
- Bayerl, J., Ayyash, M., Shani, T., Manor, Y. S., Gafni, O., Massarwa, R., Kalma, Y., Aguilera-Castrejon, A., Zerbib, M., Amir, H., Sheban, D., Geula, S., Mor, N., Weinberger, L., Naveh Tassa, S., Krupalnik, V., Oldak, B., Livnat, N., Tarazi, S., Tawil, S., Wildschutz, E., Ashouokhi, S., Lasman, L., Rotter, V., Hanna, S., Ben-Yosef, D., Novershtern, N., Viukov, S., & Hanna, J. H.
- Affiliations
- Weizmann Institute of Science (IL)
- Tel Aviv University (IL)
- Rambam Health Care Campus (IL)
- Corresponding author
- Bayerl, Jonathan
- Novershtern, Noa
- Hanna, Jacob H.
- ORCID
- Venue
- Cell stem cell
- Publisher
- Elsevier BV
- Published
- 2021-09
- Volume
- 28
- Issue
- 9
- Pages
- 1549-1565.e12
- ISSN
- 1875-9777 (ISSN-L)
- 1934-5909
- PMC
- PMC8423434
- OpenAlex
- W3159163097
- Cited by
- 165
- References
- 83
- Citations by year
- 2026: 24 · 2025: 36 · 2024: 29 · 2023: 39 · 2022: 26 · 2021: 9
- FWCI
- 8.08
- Type
- journal article
- Language
- en
- Open access
- hybrid
- doi.org
- Licence
- Locations
- Cell stem cell (publishedVersion, cc-by-nc-nd)
- bioRxiv (Cold Spring Harbor Laboratory) (acceptedVersion, cc-by-nc-nd)
- PubMed Central (publishedVersion, cc-by-nc-nd)
- PubMed (publishedVersion)
- Funders
- Israel Cancer Research Fund
- Flight Attendant Medical Research Institute
- Minerva Foundation
- Israel Science Foundation
- New York Stem Cell Foundation
- BSF
- European Research Council (ERC-CoG-2016 726497)
- Topics
- Life Sciences › Biochemistry, Genetics and Molecular Biology › Molecular Biology › Pluripotent Stem Cells Research
- Life Sciences › Biochemistry, Genetics and Molecular Biology › Molecular Biology › Developmental Biology and Gene Regulation
- Life Sciences › Biochemistry, Genetics and Molecular Biology › Molecular Biology › Epigenetics and DNA Methylation
- Keywords
- naive pluripotency, human pluripotent stem cells, MEK/ERK signaling, Wnt/β-catenin signaling, protein kinase C signaling, Src signaling, trophoblast stem cells, extraembryonic endoderm, p53, DNA hypomethylation
- MeSH terms
- Animals, Cell Differentiation, Embryo, Mammalian, Humans, Trophoblasts, Signal Transduction, Pluripotent Stem Cells, Mice
About these checks
Registry, retraction, Cites and statistics results are computed, not judged, with one exception: a printed reference that no index lists is read once by a model before it counts as a citation error. Claims are extracted by a model and kept only when their quote appears verbatim in the text; each cited source is then checked, with a model’s help, for whether it says what the claim relies on. Those verdicts can be wrong — read the claim’s quote and the cited source before relying on one.
Statistics and arithmetic are recomputed, not judged.
Confidence bands are shown only for fields calibrated on our annotated test set. None is calibrated yet, so no band is shown.
What counts as a claim ›How we measure confidence ›How we check this ›
Are you an author, or do you see a problem with this page? Request a review
