Cited by 24

The DOI matches its Crossref record; 1 of the 1 references it cites were found in a registry or an index.

Functional redundancy among Polycomb complexes in maintaining the pluripotent state of embryonic stem cells

Zhu, Yaru, Dong, Lixia, Wang, Congcong, Hao, Kunying, Wang, Jingnan, Zhao, Linchun, Xu, Lijun, Xia, Yin, Jiang, Qing, Qin, Jinzhong·2022·Stem Cell Reports

Overview

The claims and statistics of this paper haven’t been checked yet.

Run the check — free, no account needed. It reads the open-access text and checks the sources it cites.

A few free checks a day · papers already verified open instantly · results are public

Integrity signals

Registry

Crossref · 10.1016/j.stemcr.2022.02.020

Cites

1 of 1 references verified0 citation errors · 0 not checkable

Statistics

Figures

Graphical abstract
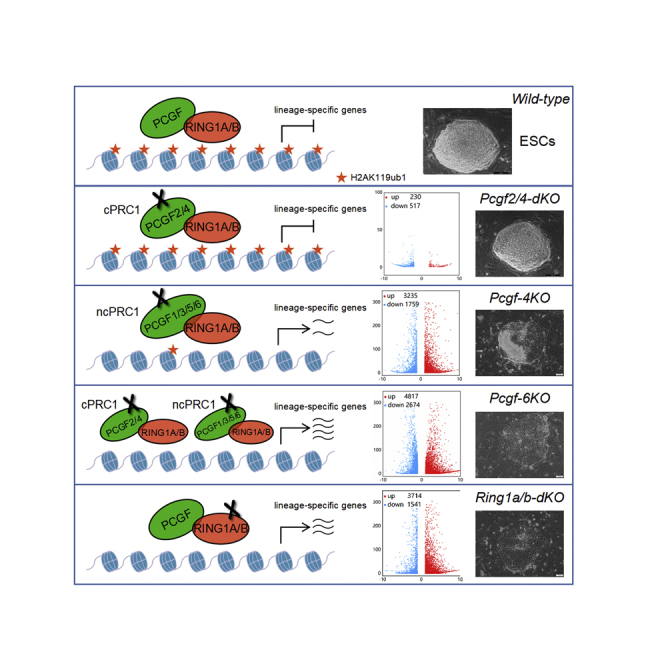
Graphical abstract CC BY-NC-ND · PubMed Central
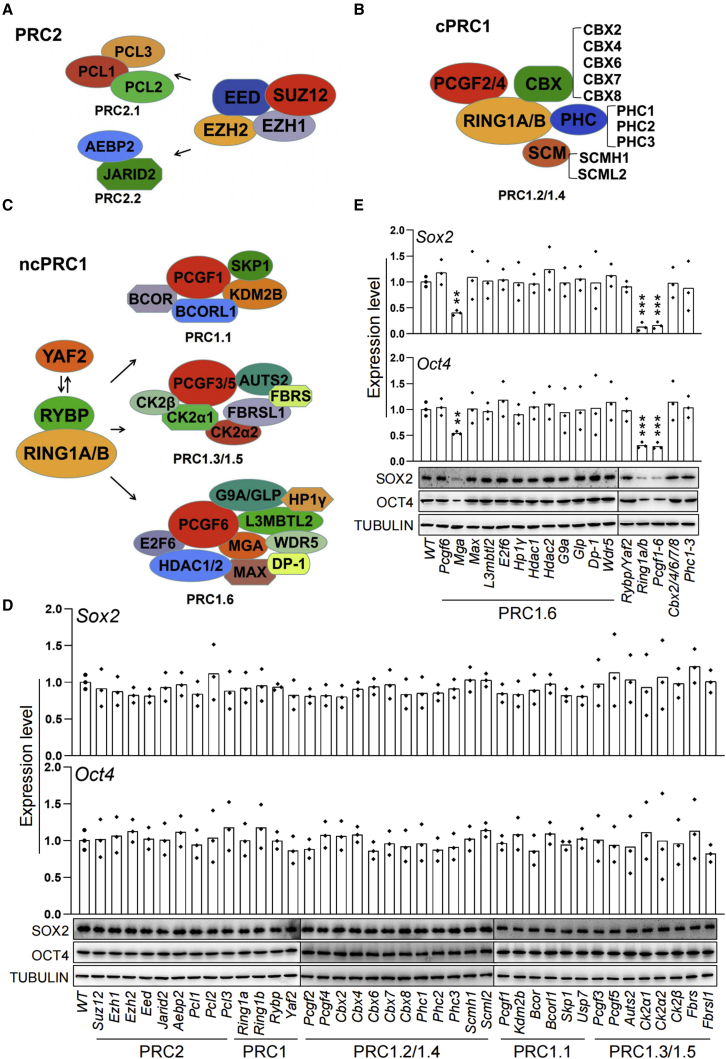
Figure 1 Effect of ablation of PcG genes on the expression of core pluripotency transcription factors Oct4 and Sox2 in ESCs (A–C) (A) Schematic representation of the subunit composition of the mammalian PRC2, (B) cPRC1, and (C) ncPRC1 complexes. (D and E) Effect of CRISPR-mediated knockout of PcG genes on the expression of the pluripotency core regulators Oct4 and Sox2 in ESCs determined by qRT-PCR (top) and western blot (bottom). Each value was normalized to its corresponding actin value and the expression level in wild-type (WT) ESCs was arbitrarily set to 1. Data in (D) and (E) represent mean ± SD obtained from three independent experiments, ∗p < 0.05, ∗∗p < 0.01, ∗∗∗p < 0.001 (Student’s t test) compared with the control.
Figure 1 Effect of ablation of PcG genes on the expression of core pluripotency transcription factors Oct4 and Sox2 in ESCs (A–C) (A) Schematic representation of the subunit composition of the mammalian PRC2, (B) cPRC1, and (C) ncPRC1 complexes. (D and E) Effect of CRISPR-mediated knockout of PcG genes on the expression of the pluripotency core regulators Oct4 and Sox2 in ESCs determined by qRT-PCR (top) and western blot (bottom). Each value was normalized to its corresponding actin value and the expression level in wild-type (WT) ESCs was arbitrarily set to 1. Data in (D) and (E) represent mean ± SD obtained from three independent experiments, ∗p < 0.05, ∗∗p < 0.01, ∗∗∗p < 0.001 (Student’s t test) compared with the control.CC BY-NC-ND · PubMed Central
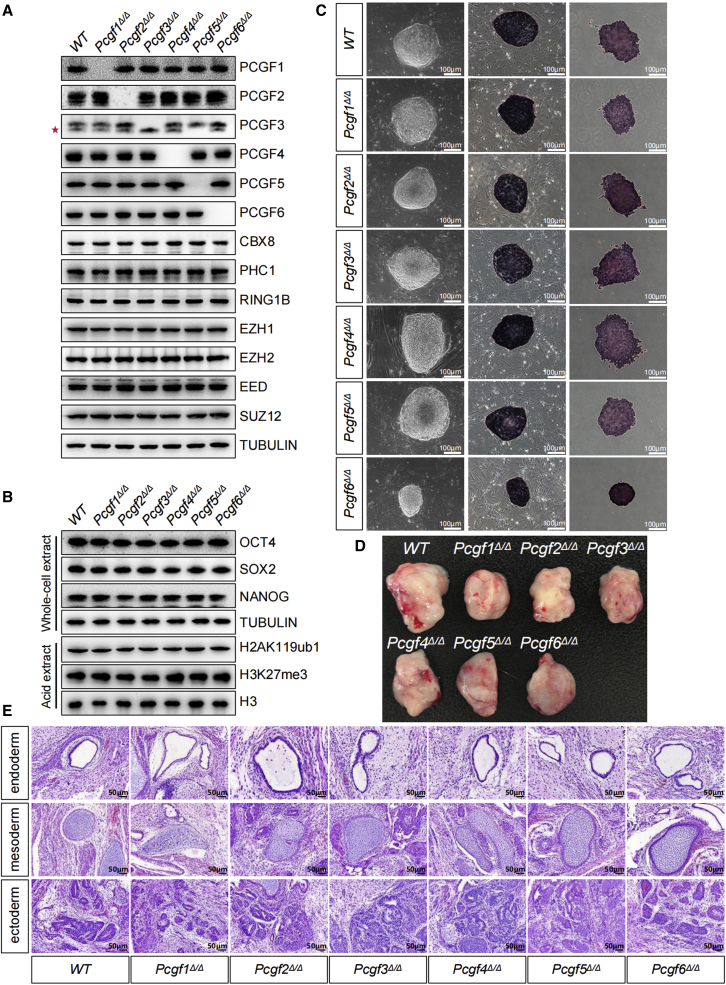
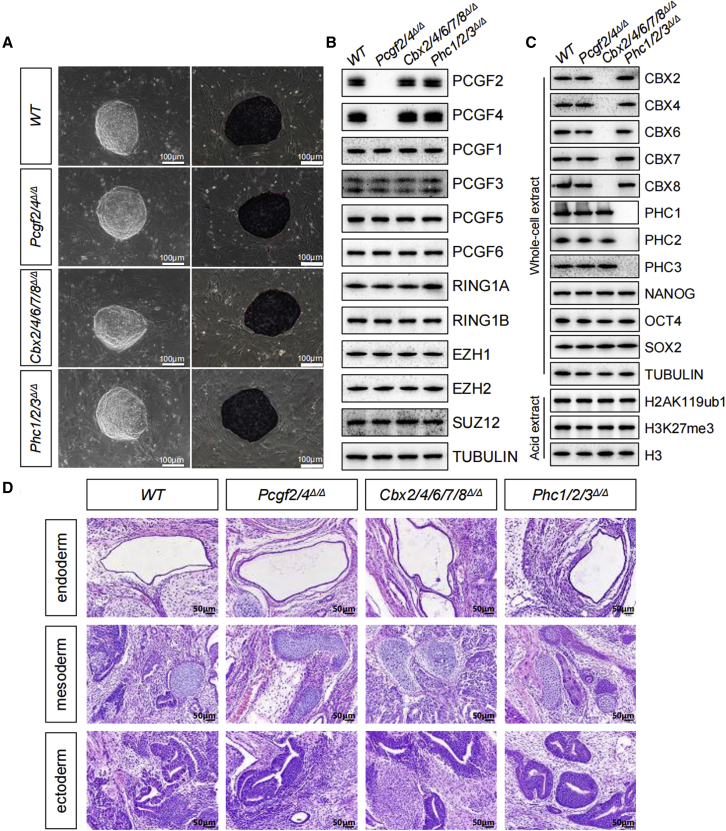
Figure 2 Loss of individual PCGF family members has no or a mild effect on the pluripotent properties of ESCs (A) Western blot analyses showing changes in the global levels of PcG proteins in ESCs of indicated genotypes. Note, the PCGF3 antibody also recognized PCGF5 (∗). (B) Western blot analyses showing changes in the global levels of pluripotency factors, H2AK119ub1 and H3K27me3 in ESCs of indicated genotypes. Tubulin and H3 were used as loading controls. (C) Left: phase-contrast images of ESC colonies cultured on a feeder layer of MEFs. Middle and right: representative images of AP staining of WT and mutant ESC colonies cultured on a feeder layer of MEFs (middle) or gelatin (right). Scale bar, 100 μm. (D) Teratoma formation in immunodeficiency mice by ESCs of indicated genotypes. (E) Representative images of tissues of all three germ layers, including gut epithelium (endoderm), cartilage (mesoderm), and neural rosette (ectoderm), from H&E staining of teratomas generated from ESCs of the indicated genotypes. Shown is a representative of three injected mice. Scale bars, 50 μm.
Figure 2 Loss of individual PCGF family members has no or a mild effect on the pluripotent properties of ESCs (A) Western blot analyses showing changes in the global levels of PcG proteins in ESCs of indicated genotypes. Note, the PCGF3 antibody also recognized PCGF5 (∗). (B) Western blot analyses showing changes in the global levels of pluripotency factors, H2AK119ub1 and H3K27me3 in ESCs of indicated genotypes. Tubulin and H3 were used as loading controls. (C) Left: phase-contrast images of ESC colonies cultured on a feeder layer of MEFs. Middle and right: representative images of AP staining of WT and mutant ESC colonies cultured on a feeder layer of MEFs (middle) or gelatin (right). Scale bar, 100 μm. (D) Teratoma formation in immunodeficiency mice by ESCs of indicated genotypes. (E) Representative images of tissues of all three germ layers, including gut epithelium (endoderm), cartilage (mesoderm), and neural rosette (ectoderm), from H&E staining of teratomas generated from ESCs of the indicated genotypes. Shown is a representative of three injected mice. Scale bars, 50 μm.CC BY-NC-ND · PubMed Central
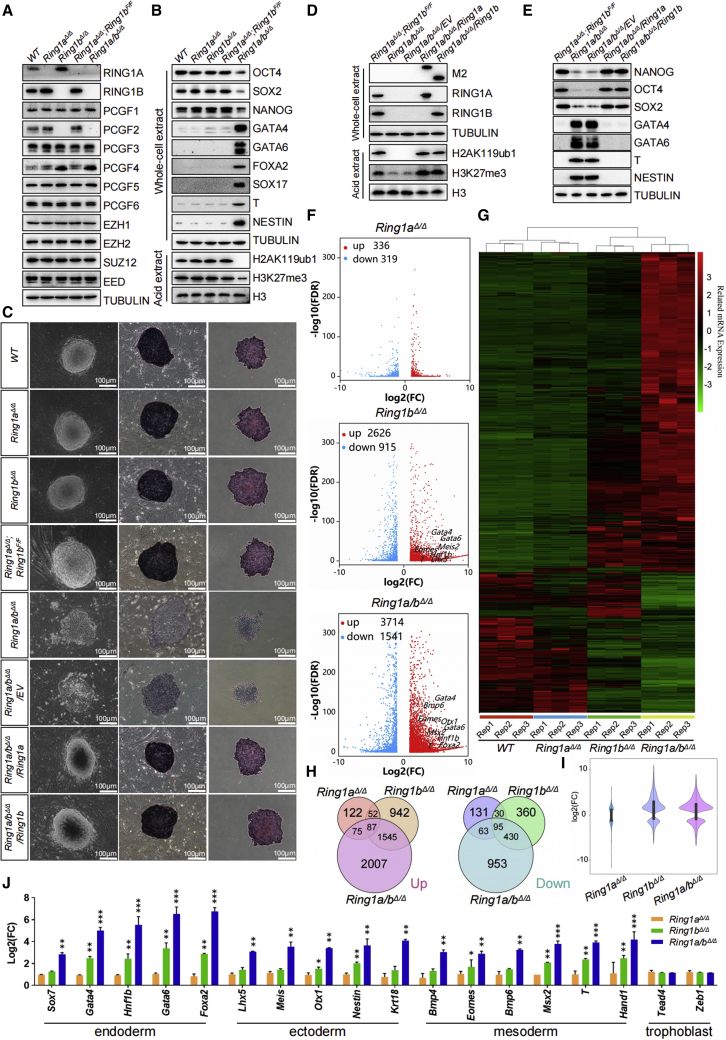
Figure 3 RING1A/B coordinate redundant mechanisms that ensure robust repression of key lineage-specific genes for sustaining ESC identity (A and B) (A) Western blot demonstrating changes in the levels of PcG proteins, (B) pluripotency factors, endodermal (GATA4, GATA6, FOXA2, SOX17), mesodermal (T), and ectodermal (NESTIN) markers in ESCs of indicated genotypes. Tubulin and H3 were used as loading controls. (C) Left: phase-contrast images of ESC colonies of indicated genotypes cultured on a feeder layer of MEFs. Middle and right: images of ESC colonies cultured on feeder layers (middle) or gelatin (right) after AP staining. Scale bar, 100 μm. (D and E) (D) Western blot for selected PcG proteins, H2AK119ub1, H3K27me3, (E) pluripotency factors and selected germ layer markers in ESCs of indicated genotypes. The expression levels of the indicated FLAG-tagged proteins were detected with anti-Flag M2 antibody. Tubulin and H3 were used as loading controls. (F) Volcano plots of –log10 (p value) against log2-fold change representing the differences in gene expression in ESCs of indicated genotypes. Upregulated (red) and downregulated (blue) genes are highlighted. (G) Heatmap depicting fold changes in gene expression in ESCs of indicated genotypes. False discovery rate <0.05. Up- and downregulated genes are reported as red and green, respectively. (H) Venn diagram showing overlap of upregulated (top) or downregulated (bottom) genes in Ring1aΔ/Δ, Ring1bΔ/Δ, and Ring1a/bΔ/Δ ESCs. (I) A violin plot comparing log2-fold changes of genes in ESCs deficient for Ring1a, Ring1b, or both. (J) qRT-PCR analysis of changes in the expression of lineage-specific genes. Each value was normalized to actin expression, and for each gene, the expression level in the wild-type ESCs was arbitrarily set to 1. Data are shown as the means ± SD for triplicate analysis. ∗p < 0.05, ∗∗p < 0.01, ∗∗∗p < 0.001 (Student’s t test) compared with the control.
Figure 3 RING1A/B coordinate redundant mechanisms that ensure robust repression of key lineage-specific genes for sustaining ESC identity (A and B) (A) Western blot demonstrating changes in the levels of PcG proteins, (B) pluripotency factors, endodermal (GATA4, GATA6, FOXA2, SOX17), mesodermal (T), and ectodermal (NESTIN) markers in ESCs of indicated genotypes. Tubulin and H3 were used as loading controls. (C) Left: phase-contrast images of ESC colonies of indicated genotypes cultured on a feeder layer of MEFs. Middle and right: images of ESC colonies cultured on feeder layers (middle) or gelatin (right) after AP staining. Scale bar, 100 μm. (D and E) (D) Western blot for selected PcG proteins, H2AK119ub1, H3K27me3, (E) pluripotency factors and selected germ layer markers in ESCs of indicated genotypes. The expression levels of the indicated FLAG-tagged proteins were detected with anti-Flag M2 antibody. Tubulin and H3 were used as loading controls. (F) Volcano plots of –log10 (p value) against log2-fold change representing the differences in gene expression in ESCs of indicated genotypes. Upregulated (red) and downregulated (blue) genes are highlighted. (G) Heatmap depicting fold changes in gene expression in ESCs of indicated genotypes. False discovery rate <0.05. Up- and downregulated genes are reported as red and green, respectively. (H) Venn diagram showing overlap of upregulated (top) or downregulated (bottom) genes in Ring1aΔ/Δ, Ring1bΔ/Δ, and Ring1a/bΔ/Δ ESCs. (I) A violin plot comparing log2-fold changes of genes in ESCs deficient for Ring1a, Ring1b, or both. (J) qRT-PCR analysis of changes in the expression of lineage-specific genes. Each value was normalized to actin expression, and for each gene, the expression level in the wild-type ESCs was arbitrarily set to 1. Data are shown as the means ± SD for triplicate analysis. ∗p < 0.05, ∗∗p < 0.01, ∗∗∗p < 0.001 (Student’s t test) compared with the control.CC BY-NC-ND · PubMed Central
Figure 4 Individual disruption of cPRC1 does not induce exit from pluripotency in ESCs (A) Phase-contrast images of ESC colonies on MEF feeders (left). Representative images of AP staining of WT and mutant ESC colonies of indicated genotypes (right). (B and C) Western blot demonstrating changes in the levels of indicated PcG proteins, pluripotency factors, and histone modifications in ESCs of indicated genotypes. Tubulin and H3 were used as loading controls. (D) Representative images showing H&E staining of histological sections derived from teratomas generated from ESCs of the indicated genotypes. Shown is a representative of three injected mice. Scale bars, 50 μm.
Figure 4 Individual disruption of cPRC1 does not induce exit from pluripotency in ESCs (A) Phase-contrast images of ESC colonies on MEF feeders (left). Representative images of AP staining of WT and mutant ESC colonies of indicated genotypes (right). (B and C) Western blot demonstrating changes in the levels of indicated PcG proteins, pluripotency factors, and histone modifications in ESCs of indicated genotypes. Tubulin and H3 were used as loading controls. (D) Representative images showing H&E staining of histological sections derived from teratomas generated from ESCs of the indicated genotypes. Shown is a representative of three injected mice. Scale bars, 50 μm.CC BY-NC-ND · PubMed Central
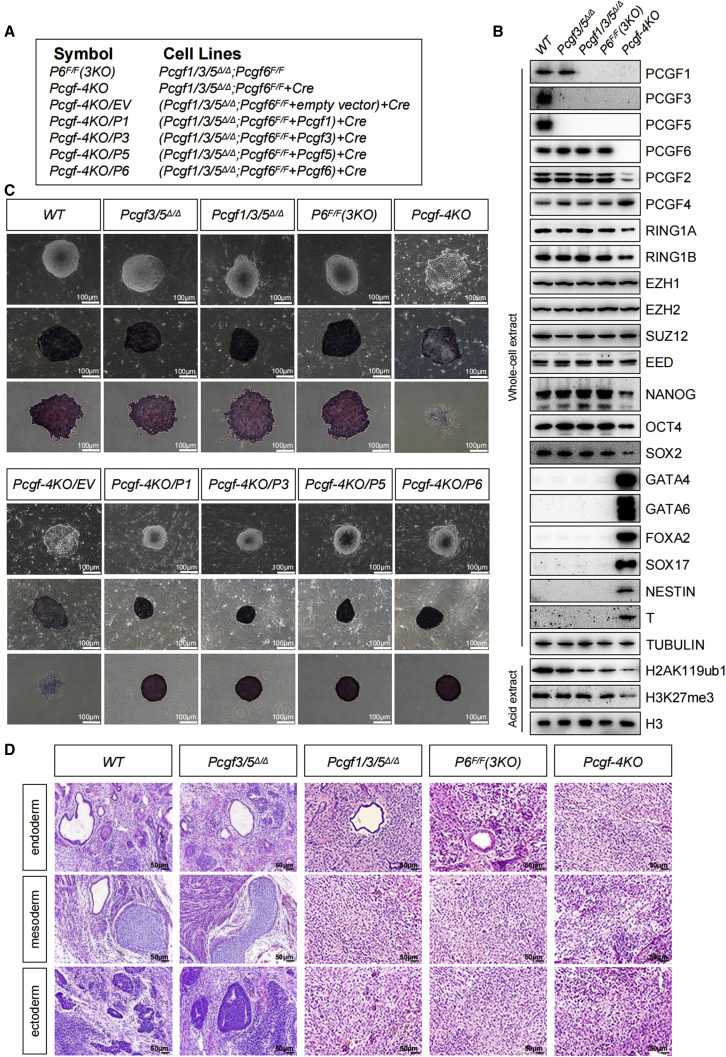
Figure 5 Combined loss of Pcgf1/3/5/6 unleash precocious differentiation of ESCs (A) Reference legend for cell lines used in this figure and in Figure S5. (B) Western blot demonstrating changes in the levels of selected PcG proteins, pluripotency factors, germ layer markers, H2AK119ub1, and H3K27me3 in ESCs of indicated genotypes. Tubulin and H3 were used as loading controls. (C) Top: phase-contrast images of ESC colonies cultured on a layer of MEFs. Middle and bottom: representative images of AP staining of ESC colonies of indicated genotypes cultured together with a feeder layer of MEFs (middle) or on gelatin (bottom). Scale bar, 100 μm. (D) H&E staining of teratoma sections revealed cells from various cell lineages including gut epithelium (endoderm), cartilage (mesoderm) and neural rosette (ectoderm). Shown is a representative of three injected mice. Scale bars, 50 μm.
Figure 5 Combined loss of Pcgf1/3/5/6 unleash precocious differentiation of ESCs (A) Reference legend for cell lines used in this figure and in Figure S5. (B) Western blot demonstrating changes in the levels of selected PcG proteins, pluripotency factors, germ layer markers, H2AK119ub1, and H3K27me3 in ESCs of indicated genotypes. Tubulin and H3 were used as loading controls. (C) Top: phase-contrast images of ESC colonies cultured on a layer of MEFs. Middle and bottom: representative images of AP staining of ESC colonies of indicated genotypes cultured together with a feeder layer of MEFs (middle) or on gelatin (bottom). Scale bar, 100 μm. (D) H&E staining of teratoma sections revealed cells from various cell lineages including gut epithelium (endoderm), cartilage (mesoderm) and neural rosette (ectoderm). Shown is a representative of three injected mice. Scale bars, 50 μm.CC BY-NC-ND · PubMed Central
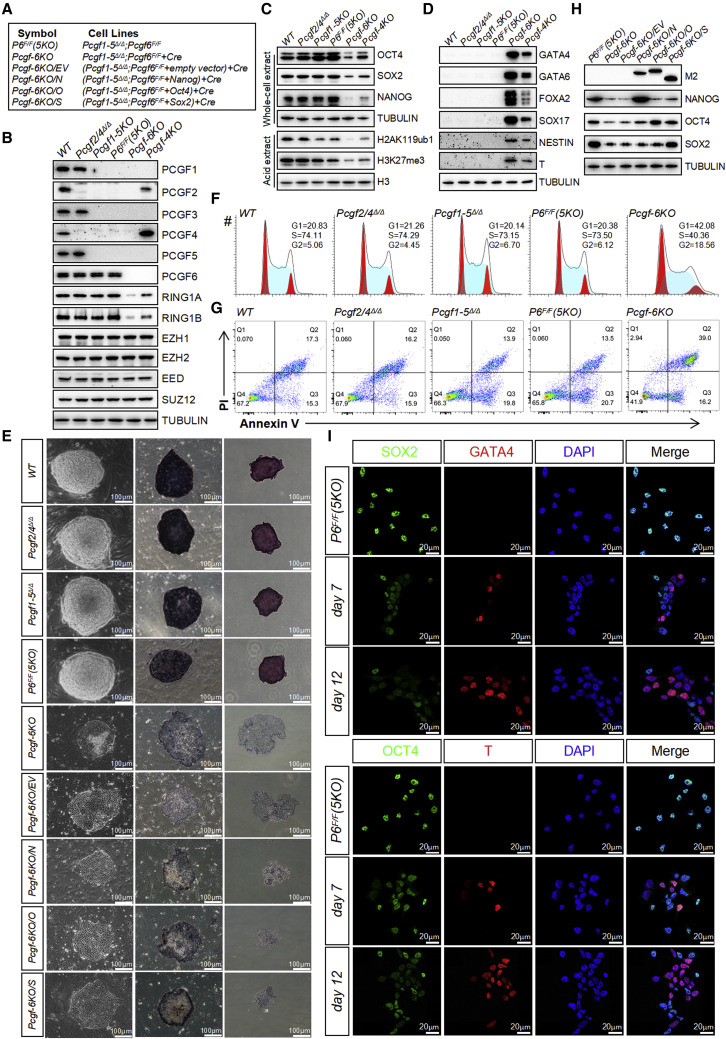
Figure 6 Simultaneous ablation of cPRC1 and ncPRC1 triggers spontaneous differentiation and loss of self-renewal (A) Reference legend for cell lines used in this figure and in Figure 7. (B–D) Western blot demonstrating changes in the levels of selected (B) PcG proteins, (C) pluripotency factors, histone modifications, and (D) germ layer markers in ESCs of indicated genotypes. Tubulin and H3 were used as loading controls. (E) Left: phase-contrast images of ESC colonies of indicated genotypes cultured on a feeder layer. Middle and right: images of ESC colonies cultured on feeder layers (middle) or gelatin (right) after AP staining. Scale bar, 100 μm. (F) Representative cell-cycle profiles determined by propidium iodide (PI) staining and FACS analysis. (G) Flow cytometric quantification of apoptosis with Annexin V and PI. The percentages of Annexin V-positive (apoptotic) cells are within the two right quadrants. (H) Western blot analyses using the indicated antibodies on whole-cell lysates from ESCs of indicated genotypes. The expression levels of the indicated FLAG-tagged proteins were detected with anti-Flag M2 antibody. (I) IF analysis for SOX2, OCT4 (green), GATA4, T (red), or DAPI (blue) in Pcgf1-5Δ/Δ;Pcgf6F/F ESCs following lenti-Cre infection. Images were taken at 63× magnification using confocal microscopy. Merge, merged images.
Figure 6 Simultaneous ablation of cPRC1 and ncPRC1 triggers spontaneous differentiation and loss of self-renewal (A) Reference legend for cell lines used in this figure and in Figure 7. (B–D) Western blot demonstrating changes in the levels of selected (B) PcG proteins, (C) pluripotency factors, histone modifications, and (D) germ layer markers in ESCs of indicated genotypes. Tubulin and H3 were used as loading controls. (E) Left: phase-contrast images of ESC colonies of indicated genotypes cultured on a feeder layer. Middle and right: images of ESC colonies cultured on feeder layers (middle) or gelatin (right) after AP staining. Scale bar, 100 μm. (F) Representative cell-cycle profiles determined by propidium iodide (PI) staining and FACS analysis. (G) Flow cytometric quantification of apoptosis with Annexin V and PI. The percentages of Annexin V-positive (apoptotic) cells are within the two right quadrants. (H) Western blot analyses using the indicated antibodies on whole-cell lysates from ESCs of indicated genotypes. The expression levels of the indicated FLAG-tagged proteins were detected with anti-Flag M2 antibody. (I) IF analysis for SOX2, OCT4 (green), GATA4, T (red), or DAPI (blue) in Pcgf1-5Δ/Δ;Pcgf6F/F ESCs following lenti-Cre infection. Images were taken at 63× magnification using confocal microscopy. Merge, merged images.CC BY-NC-ND · PubMed Central
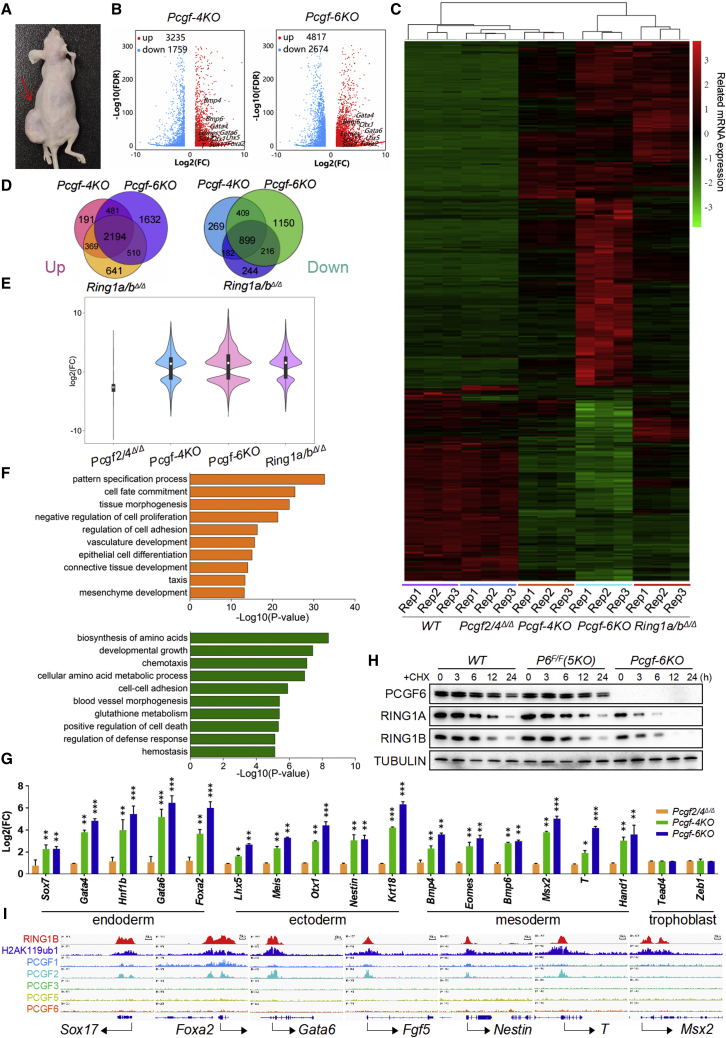
Figure 7 cPRC1 and ncPRC1 act redundantly to silence lineage-specific genes (A) Representative images of mice bearing teratomas 28 days after the injection of Pcgf1/3/5/2/4Δ/Δ;Pcgf6F/F (left side, indicated by a red arrow) or Pcgf1-6Δ/Δ ESCs (right side). Four mice were injected per condition. (B) Volcano plots of –log10 (p value) against log2-fold change representing the differences in gene expression in ESCs of indicated genotypes. Upregulated (red) and downregulated (blue) genes are highlighted. (C) Heatmap illustrating fold changes in gene expression in ESCs of indicated genotypes. False discovery rate <0.05. Up- and downregulated genes are reported as red and green, respectively. (D) Venn diagram showing overlap of upregulated (left) or downregulated (right) genes between Pcgf-4KO, Pcgf-6KO, and Ring1a/bΔ/Δ ESCs. (E) A violin plot comparing log2-fold changes of genes in ESCs deficient for Pcgf2/4, Pcgf1/3/5/6, Pcgf1-6, and Ring1a/b. (F) Gene ontology analysis of overlapping genes upregulated (top) and downregulated (bottom) between Pcgf-4KO and Pcgf-6KO ESCs. (G) qRT-PCR of germ layer markers, measured in WT, Pcgf-4KO, and Pcgf-6KO ESCs. Each value was normalized to actin expression, and for each gene the expression level in the wild-type ESCs was arbitrarily set to 1. (H) ESCs of indicated genotypes were treated with cycloheximide (CHX) as indicated and lysates were blotted with the indicated antibodies. Tubulin was used as a loading control. (I) Genomic snapshots of the indicated ChIP-seq profiles at selected germ layer gene loci in WT ESCs. Published ChIP-seq data were obtained from NCBI GEO (accession numbers GSE122715 and GSE107377). Data in (G) represent the mean ± SD of three independent experiments. ∗p < 0.05, ∗∗p < 0.01, ∗∗∗p < 0.001 (Student’s t test) compared with the control.
Figure 7 cPRC1 and ncPRC1 act redundantly to silence lineage-specific genes (A) Representative images of mice bearing teratomas 28 days after the injection of Pcgf1/3/5/2/4Δ/Δ;Pcgf6F/F (left side, indicated by a red arrow) or Pcgf1-6Δ/Δ ESCs (right side). Four mice were injected per condition. (B) Volcano plots of –log10 (p value) against log2-fold change representing the differences in gene expression in ESCs of indicated genotypes. Upregulated (red) and downregulated (blue) genes are highlighted. (C) Heatmap illustrating fold changes in gene expression in ESCs of indicated genotypes. False discovery rate <0.05. Up- and downregulated genes are reported as red and green, respectively. (D) Venn diagram showing overlap of upregulated (left) or downregulated (right) genes between Pcgf-4KO, Pcgf-6KO, and Ring1a/bΔ/Δ ESCs. (E) A violin plot comparing log2-fold changes of genes in ESCs deficient for Pcgf2/4, Pcgf1/3/5/6, Pcgf1-6, and Ring1a/b. (F) Gene ontology analysis of overlapping genes upregulated (top) and downregulated (bottom) between Pcgf-4KO and Pcgf-6KO ESCs. (G) qRT-PCR of germ layer markers, measured in WT, Pcgf-4KO, and Pcgf-6KO ESCs. Each value was normalized to actin expression, and for each gene the expression level in the wild-type ESCs was arbitrarily set to 1. (H) ESCs of indicated genotypes were treated with cycloheximide (CHX) as indicated and lysates were blotted with the indicated antibodies. Tubulin was used as a loading control. (I) Genomic snapshots of the indicated ChIP-seq profiles at selected germ layer gene loci in WT ESCs. Published ChIP-seq data were obtained from NCBI GEO (accession numbers GSE122715 and GSE107377). Data in (G) represent the mean ± SD of three independent experiments. ∗p < 0.05, ∗∗p < 0.01, ∗∗∗p < 0.001 (Student’s t test) compared with the control.CC BY-NC-ND · PubMed Central

Verification

Claims the paper makes

The claims and statistics of this paper haven’t been checked yet.

Run the check — free, no account needed. It reads the open-access text and checks the sources it cites.

A few free checks a day · papers already verified open instantly · results are public

Claims other papers make about this one

Each is checked against this paper’s own text: does it say what the citing paper says it does?

Self-check

Percentages, sums and reported differences re-computed from the paper’s own numbers.

The self-check needs the paper’s full text.

Citations

Cites

Show all 1 references

Research works printed but not linked: 34

  1. Akasaka, 2001, Mice doubly deficient for the Polycomb Group genes Mel18 and Bmi1 reveal synergy and requirement for maintenance but not initiation of Hox gene expression, Development, 128, 1587, 10.1242/dev.128.9.1587 · DOI
  2. Almeida, 2017, PCGF3/5-PRC1 initiates Polycomb recruitment in X chromosome inactivation, Science, 356, 1081, 10.1126/science.aal2512 · DOI
  3. Boyer, 2005, Core transcriptional regulatory circuitry in human embryonic stem cells, Cell, 122, 947, 10.1016/j.cell.2005.08.020 · DOI · Paper page
  4. Boyer, 2006, Polycomb complexes repress developmental regulators in murine embryonic stem cells, Nature, 441, 349, 10.1038/nature04733 · DOI
  5. Coré, 1997, Altered cellular proliferation and mesoderm patterning in Polycomb-M33-deficient mice, Development, 124, 721, 10.1242/dev.124.3.721 · DOI
  6. del Mar Lorente, 2000, Loss- and gain-of-function mutations show a polycomb group function for Ring1A in mice, Development, 127, 5093, 10.1242/dev.127.23.5093 · DOI
  7. Endoh, 2017, PCGF6-PRC1 suppresses premature differentiation of mouse embryonic stem cells by regulating germ cell-related genes, Elife, 6, e21064, 10.7554/eLife.21064 · DOI
  8. Evans, 1981, Establishment in culture of pluripotential cells from mouse embryos, Nature, 292, 154, 10.1038/292154a0 · DOI
  9. Forzati, 2012, CBX7 is a tumor suppressor in mice and humans, J. Clin. Invest., 122, 612, 10.1172/JCI58620 · DOI
  10. Fursova, 2019, Synergy between variant PRC1 complexes defines polycomb-mediated gene repression, Mol. Cell, 74, 1020, 10.1016/j.molcel.2019.03.024 · DOI · Paper page
  11. Gao, 2012, PCGF homologs, CBX proteins, and RYBP define functionally distinct PRC1 family complexes, Mol. Cell, 45, 344, 10.1016/j.molcel.2012.01.002 · DOI
  12. Hauri, 2016, A high-density map for navigating the human polycomb complexome, Cell Rep., 17, 583, 10.1016/j.celrep.2016.08.096 · DOI
  13. Isono, 2005, Mammalian polyhomeotic homologues Phc2 and Phc1 act in synergy to mediate polycomb repression of Hox genes, Mol. Cell. Biol., 25, 6694, 10.1128/MCB.25.15.6694-6706.2005 · DOI
  14. Lau, 2017, Mutation of a nucleosome compaction region disrupts Polycomb-mediated axial patterning, Science, 355, 1081, 10.1126/science.aah5403 · DOI
  15. Liu, 2020, The polycomb group protein PCGF6 mediates germline gene silencing by recruiting histone-modifying proteins to target gene promoters, J. Biol. Chem., 295, 9712, 10.1074/jbc.RA119.012121 · DOI
  16. Martin, 1981, Isolation of a pluripotent cell line from early mouse embryos cultured in medium conditioned by teratocarcinoma stem cells, Proc. Natl. Acad. Sci. U S A, 78, 7634, 10.1073/pnas.78.12.7634 · DOI
  17. Morey, 2015, Polycomb regulates mesoderm cell fate-specification in embryonic stem cells through activation and repression mechanisms, Cell Stem Cell, 17, 300, 10.1016/j.stem.2015.08.009 · DOI
  18. Pirity, 2005, Rybp/DEDAF is required for early postimplantation and for central nervous system development, Mol. Cell. Biol., 25, 7193, 10.1128/MCB.25.16.7193-7202.2005 · DOI
  19. Piunti, 2021, The roles of Polycomb repressive complexes in mammalian development and cancer, Nat. Rev. Mol. Cel. Biol., 22, 326, 10.1038/s41580-021-00341-1 · DOI
  20. Posfai, 2012, Polycomb function during oogenesis is required for mouse embryonic development, Genes Dev., 26, 920, 10.1101/gad.188094.112 · DOI
  21. Qin, 2021, Mga safeguards embryonic stem cells from acquiring extraembryonic endoderm fates, Sci. Adv., 7, eabe5689, 10.1126/sciadv.abe5689 · DOI
  22. Qin, 2012, The polycomb group protein L3mbtl2 assembles an atypical PRC1-family complex that is essential in pluripotent stem cells and early development, Cell Stem Cell, 11, 319, 10.1016/j.stem.2012.06.002 · DOI
  23. Saurin, 2001, A Drosophila Polycomb group complex includes Zeste and dTAFII proteins, Nature, 412, 655, 10.1038/35088096 · DOI
  24. Scelfo, 2019, Functional landscape of PCGF proteins reveals both RING1A/B-Dependent-and RING1A/B-Independent-Specific activities, Mol. Cell, 74, 1037, 10.1016/j.molcel.2019.04.002 · DOI
  25. Schuettengruber, 2017, Genome regulation by polycomb and Trithorax: 70 Years and counting, Cell, 171, 34, 10.1016/j.cell.2017.08.002 · DOI · Paper page
  26. Shao, 1999, Stabilization of chromatin structure by PRC1, a Polycomb complex, Cell, 98, 37, 10.1016/S0092-8674(00)80604-2 · DOI
  27. Simon, 2009, Mechanisms of polycomb gene silencing: knowns and unknowns, Nat. Rev. Mol. Cel. Biol., 10, 697, 10.1038/nrm2763 · DOI
  28. Stielow, 2018, MGA, L3MBTL2 and E2F6 determine genomic binding of the non-canonical Polycomb repressive complex PRC1.6, PLoS Genet., 14, e1007193, 10.1371/journal.pgen.1007193 · DOI
  29. Voncken, 2003, Rnf2 (Ring1b) deficiency causes gastrulation arrest and cell cycle inhibition, Proc. Natl. Acad. Sci. U S A, 100, 2468, 10.1073/pnas.0434312100 · DOI
  30. Washkowitz, 2015, Mga is essential for the survival of pluripotent cells during peri-implantation development, Development, 142, 31, 10.1242/dev.111104 · DOI
  31. Yan, 2017, Loss of polycomb group protein Pcgf1 severely compromises proper differentiation of embryonic stem cells, Scientific Rep., 7, 46276, 10.1038/srep46276 · DOI
  32. Zepeda-Martinez, 2020, Parallel PRC2/cPRC1 and vPRC1 pathways silence lineage-specific genes and maintain self-renewal in mouse embryonic stem cells, Sci. Adv., 6, eaax5692, 10.1126/sciadv.aax5692 · DOI
  33. Zhao, 2017, Polycomb group RING finger proteins 3/5 activate transcription via an interaction with the pluripotency factor Tex10 in embryonic stem cells, J. Biol. Chem., 292, 21527, 10.1074/jbc.M117.804054 · DOI
  34. Zhao, 2017, Essential role for polycomb group protein Pcgf6 in embryonic stem cell maintenance and a noncanonical polycomb repressive complex 1 (PRC1) integrity, J. Biol. Chem., 292, 2773, 10.1074/jbc.M116.763961 · DOI

Cited by

Sorted by citations

Metadata

Authors
Zhu, Y., Dong, L., Wang, C., Hao, K., Wang, J., Zhao, L., Xu, L., Xia, Y., Jiang, Q., & Qin, J.
Venue
Stem Cell Reports
Publisher
Elsevier BV
Published
2022-05
Volume
17
Issue
5
Pages
1198-1214
ISSN
2213-6711
Cited by
24
References
1
Language
en
Funders
  • Foundation for Innovative Research Groups of the National Natural Science Foundation of China (31970810)
  • National Natural Science Foundation of China

About these checks

Registry, retraction, Cites and statistics results are computed, not judged, with one exception: a printed reference that no index lists is read once by a model before it counts as a citation error. Claims are extracted by a model and kept only when their quote appears verbatim in the text; each cited source is then checked, with a model’s help, for whether it says what the claim relies on. Those verdicts can be wrong — read the claim’s quote and the cited source before relying on one.

Statistics and arithmetic are recomputed, not judged.

Confidence bands are shown only for fields calibrated on our annotated test set. None is calibrated yet, so no band is shown.

What counts as a claim ›How we measure confidence ›How we check this ›

Are you an author, or do you see a problem with this page? Request a review