

The DOI matches its Crossref record; 6 of the 6 references it cites were found in a registry or an index.
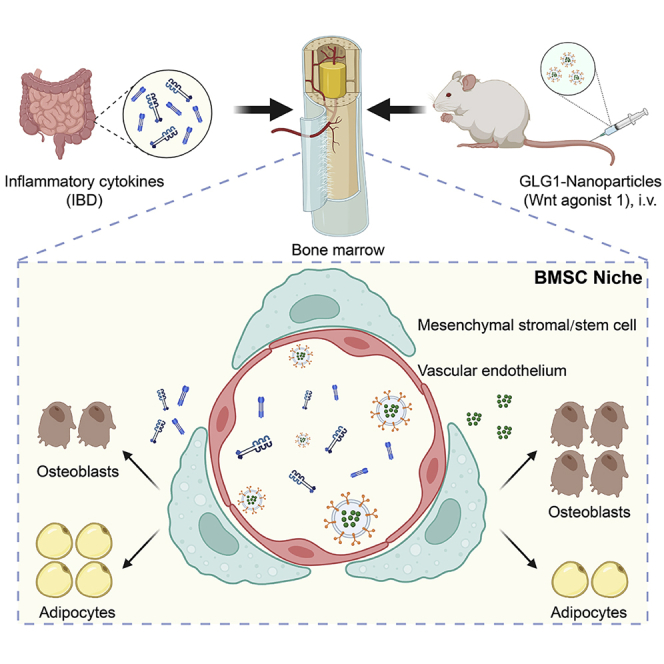
Exosome-based bone-targeting drug delivery alleviates impaired osteoblastic bone formation and bone loss in inflammatory bowel diseases
Overview
The claims and statistics of this paper haven’t been checked yet.
Run the check — free, no account needed. It reads the open-access text and checks the sources it cites.
Integrity signals
Registry
Cites
Statistics
Figures
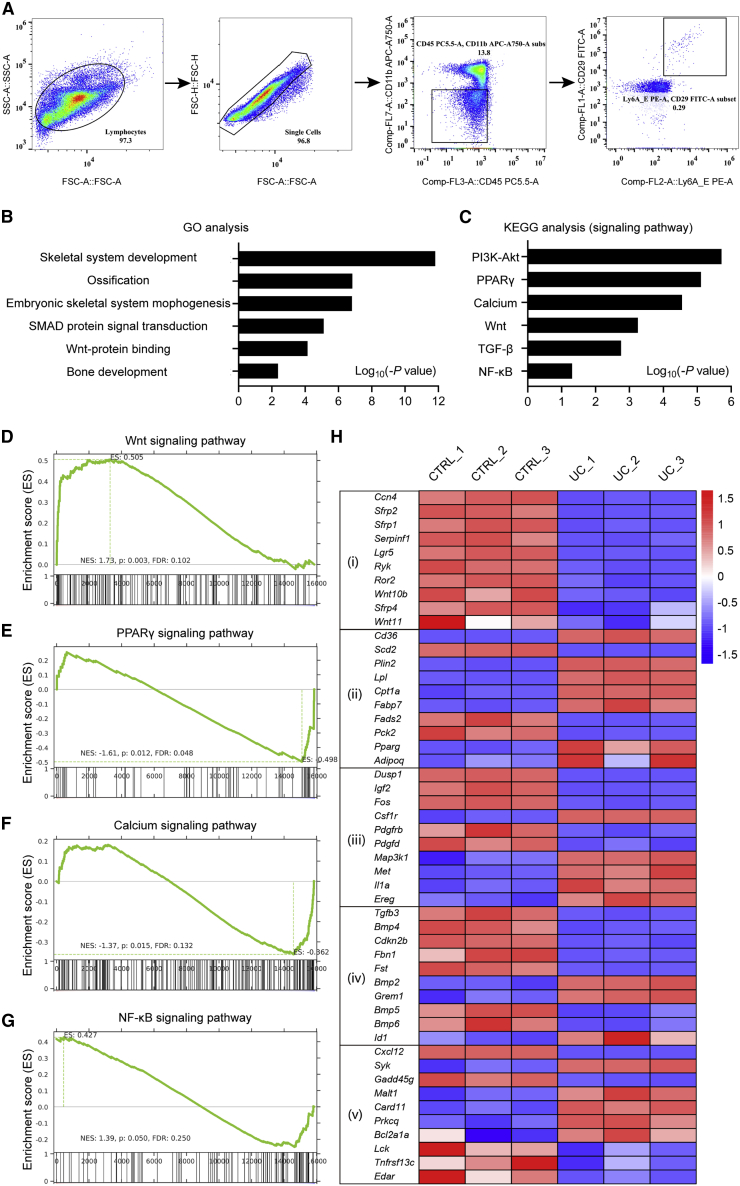
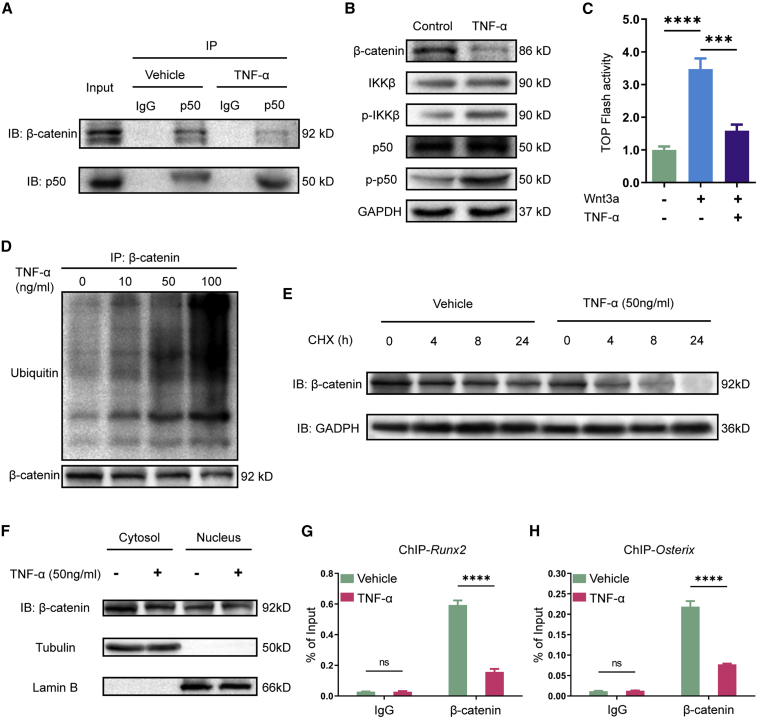
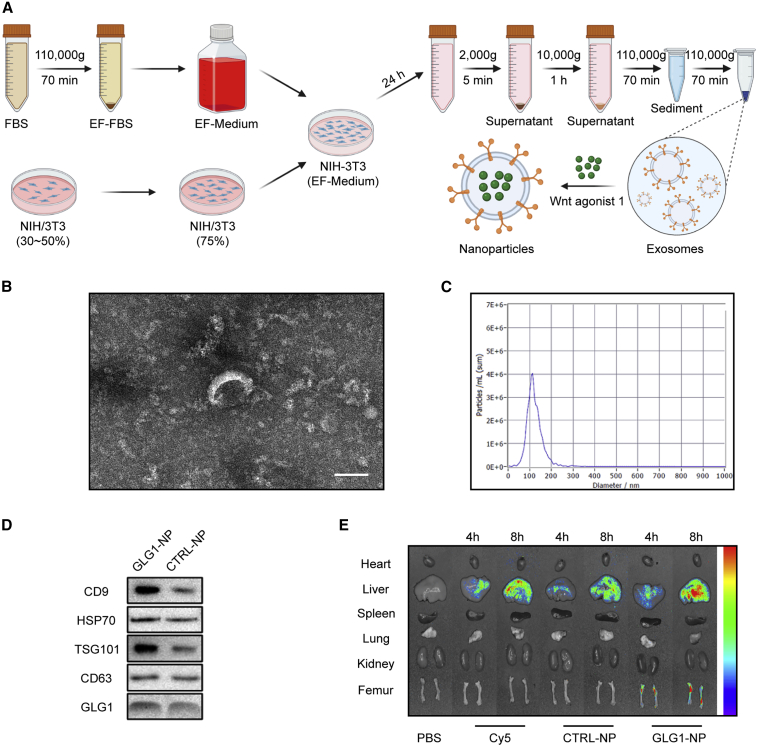
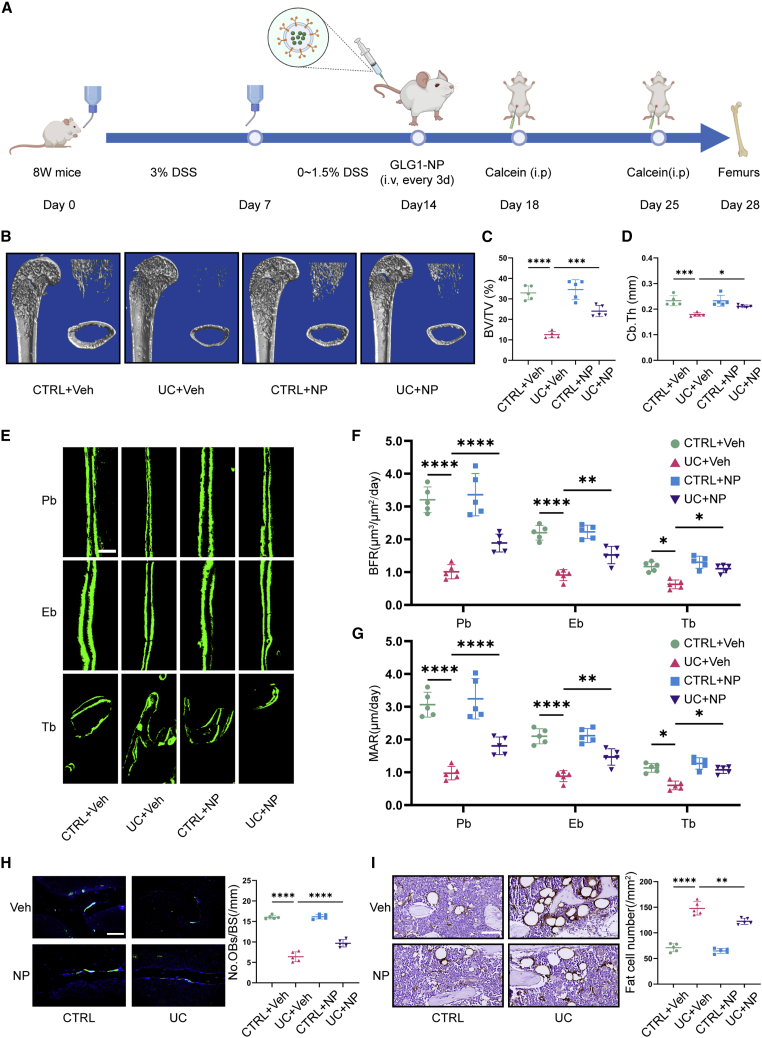
Verification
Claims the paper makes
The claims and statistics of this paper haven’t been checked yet.
Run the check — free, no account needed. It reads the open-access text and checks the sources it cites.
Claims other papers make about this one
Each is checked against this paper’s own text: does it say what the citing paper says it does?
In the citing paper
“For example, exosomes used in bone-targeting therapies have shown promising results in preventing bone loss and promoting bone formation without causing significant immune responses [27].”
From Emerging role of exosomes in cancer therapy: progress and challenges (2025) · cites this paper as [27]
Self-check
Percentages, sums and reported differences re-computed from the paper’s own numbers.
The self-check needs the paper’s full text.
Citations
Cites
The four epidemiological stages in the global evolution of inflammatory bowel disease
Kaplan, G. G., & Windsor, J. W. (2021) · Nature Reviews Gastroenterology & Hepatology · doi:10.1038/s41575-020-00360-x · Cited by 1,351
Use of bone turnover markers in postmenopausal osteoporosis
Eastell, R., & Szulc, P. (2017) · The Lancet Diabetes & Endocrinology · doi:10.1016/s2213-8587(17)30184-5 · Cited by 594
Gut, inflammation and osteoporosis: Basic and clinical concepts
Tilg, H., Moschen, A. R., Kaser, A., Pines, A., & Dotan, I. (2008) · Gut · doi:10.1136/gut.2006.117382 · Cited by 292
Role of inflammation in the aging bones
Abdelmagid, S. M., Barbe, M. F., & Safadi, F. F. (2015) · Life Sciences · doi:10.1016/j.lfs.2014.11.011 · Cited by 134
Targeting actin-bundling protein L-plastin as an anabolic therapy for bone loss
Li, X., Wang, L., Huang, B., Gu, Y., Luo, Y., Zhi, X., Hu, Y., Zhang, H., Gu, Z., Cui, J., et al. (2020) · Science Advances · doi:10.1126/sciadv.abb7135 · Cited by 90
Self-citationNew insight into unexpected bone formation by denosumab
Wang, L., Huang, B., Chen, X., & Su, J. (2020) · Drug Discovery Today · doi:10.1016/j.drudis.2020.09.001 · Cited by 13
Self-citation
Research works printed but not linked: 72
- Hardy, 2009, Bone loss in inflammatory disorders, J. Endocrinol., 201, 309, 10.1677/JOE-08-0568 · DOI
- Merlotti, 2022, Bone fragility in gastrointestinal disorders, Int. J. Mol. Sci., 23, 2713, 10.3390/ijms23052713 · DOI
- Liu, 2021, The microbiome in inflammatory bowel diseases: from pathogenesis to therapy, Nat. Nanotechnol., 16, 331, 10.1038/s41565-020-00818-8 · DOI
- Kaplan, 2015, The global burden of IBD: from 2015 to 2025, Nat. Rev. Gastroenterol. Hepatol., 12, 720, 10.1038/nrgastro.2015.150 · DOI · Paper page
- Ye, 2013, Review of inflammatory bowel disease in China, Sci. World J., 2013, 10.1155/2013/296470 · DOI · Paper page
- Rodríguez-Bores, 2007, Basic and clinical aspects of osteoporosis in inflammatory bowel disease, World J. Gastroenterol., 13, 6156, 10.3748/wjg.v13.i46.6156 · DOI
- Szafors, 2018, Risk of fracture and low bone mineral density in adults with inflammatory bowel diseases. A systematic literature review with meta-analysis, Osteoporos. Int., 29, 2389, 10.1007/s00198-018-4586-6 · DOI
- Lamb, 2019, British Society of Gastroenterology consensus guidelines on the management of inflammatory bowel disease in adults, Gut, 68, s1, 10.1136/gutjnl-2019-318484 · DOI · Paper page
- Oliveira, 2017, Diagnosis and management of inflammatory bowel disease in children, BMJ, 357, j2083, 10.1136/bmj.j2083 · DOI
- Chen, 2018, RANKL signaling in bone marrow mesenchymal stem cells negatively regulates osteoblastic bone formation, Bone Res., 6, 34, 10.1038/s41413-018-0035-6 · DOI · Paper page
- Hu, 2021, RANKL from bone marrow adipose lineage cells promotes osteoclast formation and bone loss, EMBO Rep., 22, 10.15252/embr.202152481 · DOI
- Hamdani, 2008, Dextran sodium sulfate-induced colitis causes rapid bone loss in mice, Bone, 43, 945, 10.1016/j.bone.2008.06.018 · DOI
- Metzger, 2017, Inflammatory bowel disease in a rodent model alters osteocyte protein levels controlling bone turnover, J. Bone Miner. Res., 32, 802, 10.1002/jbmr.3027 · DOI
- Dresner-Pollak, 2004, Interleukin 10-deficient mice develop osteopenia, decreased bone formation, and mechanical fragility of long bones, Gastroenterology, 127, 792, 10.1053/j.gastro.2004.06.013 · DOI
- Al Saedi, 2022, Characterization of skeletal phenotype and associated mechanisms with chronic intestinal inflammation in the winnie mouse model of spontaneous chronic colitis, Inflamm. Bowel Dis., 28, 259, 10.1093/ibd/izab174 · DOI
- Khosla, 2017, Osteoporosis treatment: recent developments and ongoing challenges, Lancet Diabetes Endocrinol., 5, 898, 10.1016/S2213-8587(17)30188-2 · DOI
- Estell, 2021, Emerging insights into the comparative effectiveness of anabolic therapies for osteoporosis, Nat. Rev. Endocrinol., 17, 31, 10.1038/s41574-020-00426-5 · DOI
- Bernstein, 2014, What is the role for bisphosphonates in IBD?, Gut, 63, 1369, 10.1136/gutjnl-2013-306141 · DOI
- Narayanan, 2018, Inflammation-induced lymphatic architecture and bone turnover changes are ameliorated by irisin treatment in chronic inflammatory bowel disease, Faseb. J., 32, 4848, 10.1096/fj.201800178R · DOI
- Chen, 2022, The horizon of bone organoid: a perspective on construction and application, Bioact. Mater., 18, 15
- Chen, 2020, Gli1(+) cells couple with type H vessels and are required for type H vessel formation, Stem Cell Rep., 15, 110, 10.1016/j.stemcr.2020.06.007 · DOI
- Salhotra, 2020, Mechanisms of bone development and repair, Nat. Rev. Mol. Cell Biol., 21, 696, 10.1038/s41580-020-00279-w · DOI
- Leppkes, 2020, Cytokines in inflammatory bowel diseases - update 2020, Pharmacol. Res., 158, 10.1016/j.phrs.2020.104835 · DOI
- Yang, 2013, Tumor necrosis factor alpha suppresses the mesenchymal stem cell osteogenesis promoter miR-21 in estrogen deficiency-induced osteoporosis, J. Bone Miner. Res., 28, 559, 10.1002/jbmr.1798 · DOI
- Du, 2018, TNF-alpha suppresses osteogenic differentiation of MSCs by accelerating P2Y2 receptor in estrogen-deficiency induced osteoporosis, Bone, 117, 161, 10.1016/j.bone.2018.09.012 · DOI
- Russell, 2021, IL-17A and TNF modulate normal human spinal entheseal bone and soft tissue mesenchymal stem cell osteogenesis, adipogenesis, and stromal function, Cells, 10, 341, 10.3390/cells10020341 · DOI
- Tevlin, 2017, Pharmacological rescue of diabetic skeletal stem cell niches, Sci. Transl. Med., 9, 10.1126/scitranslmed.aag2809 · DOI
- Xue, 2021, Recent advances in design of functional biocompatible hydrogels for bone tissue engineering, Adv. Funct. Mater., 31, 10.1002/adfm.202009432 · DOI
- Xue, 2022, Fabrication of physical and chemical crosslinked hydrogels for bone tissue engineering, Bioact. Mater., 12, 327
- Song, 2019, Reversal of osteoporotic activity by endothelial cell-secreted bone targeting and biocompatible exosomes, Nano Lett., 19, 3040, 10.1021/acs.nanolett.9b00287 · DOI
- Hu, 2021, Exosome-guided bone targeted delivery of Antagomir-188 as an anabolic therapy for bone loss, Bioact. Mater., 6, 2905
- Liu, 2022, Bacterial extracellular vesicles as bioactive nanocarriers for drug delivery: advances and perspectives, Bioact. Mater., 14, 169
- Esposito, 2019, Bone vascular niche E-selectin induces mesenchymal-epithelial transition and Wnt activation in cancer cells to promote bone metastasis, Nat. Cell Biol., 21, 627, 10.1038/s41556-019-0309-2 · DOI
- Wang, 2020, HucMSC-exosomes carrying miR-326 inhibit neddylation to relieve inflammatory bowel disease in mice, Clin. Transl. Med., 10, e113, 10.1002/ctm2.113 · DOI
- Holgersen, 2015, Piroxicam treatment augments bone abnormalities in interleukin-10 knockout mice, Inflamm. Bowel Dis., 21, 257, 10.1097/MIB.0000000000000269 · DOI
- Seul, 2011, Osteoblast-specific expression of MEF induces osteopenia through downregulation of osteoblastogenesis and upregulation of osteoclastogenesis, J. Bone Miner. Res., 26, 341, 10.1002/jbmr.208 · DOI
- Baek, 2012, Myeloid Elf-1-like factor stimulates adipogenic differentiation through the induction of peroxisome proliferator-activated receptor gamma expression in bone marrow, J. Cell. Physiol., 227, 3603, 10.1002/jcp.24064 · DOI
- Wang, 2022, Disruption of hematopoiesis attenuates the osteogenic differentiation capacity of bone marrow stromal cells, Stem Cell Res. Ther., 13, 27, 10.1186/s13287-022-02708-3 · DOI
- Chang, 2013, NF-kappaB inhibits osteogenic differentiation of mesenchymal stem cells by promoting beta-catenin degradation, Proc. Natl. Acad. Sci. USA, 110, 9469, 10.1073/pnas.1300532110 · DOI
- Compston, 2019, Lancet, 393, 364, 10.1016/S0140-6736(18)32112-3 · DOI · Paper page
- Liang, 2022, Osteoporosis pathogenesis and treatment: existing and emerging avenues, Cell. Mol. Biol. Lett., 27, 72, 10.1186/s11658-022-00371-3 · DOI
- Song, 2022, Advances in pathogenesis and therapeutic strategies for osteoporosis, Pharmacol. Ther., 237, 10.1016/j.pharmthera.2022.108168 · DOI · Paper page
- Komatsu, 2022, Mechanisms of joint destruction in rheumatoid arthritis - immune cell-fibroblast-bone interactions, Nat. Rev. Rheumatol., 18, 415, 10.1038/s41584-022-00793-5 · DOI
- de Oliveira, 2020, Obesity/metabolic syndrome and diabetes mellitus on peri-implantitis, Trends Endocrinol. Metabol., 31, 596, 10.1016/j.tem.2020.05.005 · DOI
- Ke, 2019, Mechanisms underlying bone loss associated with gut inflammation, Int. J. Mol. Sci., 20, 6323, 10.3390/ijms20246323 · DOI
- Zouali, 2021, B lymphocytes, the gastrointestinal tract and autoimmunity, Autoimmun. Rev., 20, 10.1016/j.autrev.2021.102777 · DOI
- Kaplan, 2017, Understanding and preventing the global increase of inflammatory bowel disease, Gastroenterology, 152, 313, 10.1053/j.gastro.2016.10.020 · DOI · Paper page
- Zhou, 2020, Bone mineral density is negatively correlated with ulcerative colitis: a systematic review and meta-analysis, Clin. Transl. Med., 9, 18, 10.1186/s40169-020-00270-0 · DOI
- Haschka, 2016, High-resolution quantitative computed tomography demonstrates structural defects in cortical and trabecular bone in IBD patients, J. Crohns Colitis, 10, 532, 10.1093/ecco-jcc/jjw012 · DOI
- van Staa, 2003, Inflammatory bowel disease and the risk of fracture, Gastroenterology, 125, 1591, 10.1053/j.gastro.2003.09.027 · DOI
- Agrawal, 2011, Bone, inflammation, and inflammatory bowel disease, Curr. Osteoporos. Rep., 9, 251, 10.1007/s11914-011-0077-9 · DOI
- Ciucci, 2015, Bone marrow Th17 TNFalpha cells induce osteoclast differentiation, and link bone destruction to IBD, Gut, 64, 1072, 10.1136/gutjnl-2014-306947 · DOI
- Chen, 2020, A selected small molecule prevents inflammatory osteolysis through restraining osteoclastogenesis by modulating PTEN activity, Clin. Transl. Med., 10, e240, 10.1002/ctm2.240 · DOI
- Meirow, 2022, Specific inflammatory osteoclast precursors induced during chronic inflammation give rise to highly active osteoclasts associated with inflammatory bone loss, Bone Res., 10, 36, 10.1038/s41413-022-00206-z · DOI
- Redlich, 2012, Inflammatory bone loss: pathogenesis and therapeutic intervention, Nat. Rev. Drug Discov., 11, 234, 10.1038/nrd3669 · DOI
- Bischoff, 1997, Altered bone metabolism in inflammatory bowel disease, Am. J. Gastroenterol., 92, 1157
- Silvennoinen, 1996, Increased degradation of type I collagen in patients with inflammatory bowel disease, Gut, 38, 223, 10.1136/gut.38.2.223 · DOI
- Ludvigsson, 2019, Fracture risk in patients with inflammatory bowel disease: a nationwide population-based cohort study from 1964 to 2014, Am. J. Gastroenterol., 114, 291, 10.14309/ajg.0000000000000062 · DOI
- Ahn, 2022, High risk of fractures within 7 Years of diagnosis in asian patients with inflammatory bowel diseases, Clin. Gastroenterol. Hepatol., 20, e1022, 10.1016/j.cgh.2021.06.026 · DOI
- Uluçkan, 2016, Chronic skin inflammation leads to bone loss by IL-17-mediated inhibition of Wnt signaling in osteoblasts, Sci. Transl. Med., 8, 330ra37, 10.1126/scitranslmed.aad8996 · DOI
- Munir, 2017, Adipogenic differentiation of mesenchymal stem cells alters their immunomodulatory properties in a tissue-specific manner, Stem Cell., 35, 1636, 10.1002/stem.2622 · DOI
- Osorio, 2022, Inflammatory stimuli alter bone marrow composition and compromise bone health in the malnourished host, Front. Immunol., 13, 10.3389/fimmu.2022.846246 · DOI
- da Silva, 2016, Obesity modifies bone marrow microenvironment and directs bone marrow mesenchymal cells to adipogenesis, Obesity, 24, 2522, 10.1002/oby.21660 · DOI
- Noack, 2015, Prostaglandin E2 impairs osteogenic and facilitates adipogenic differentiation of human bone marrow stromal cells, Prostaglandins Leukot. Essent. Fatty Acids, 94, 91, 10.1016/j.plefa.2014.11.008 · DOI
- Tian, 2022, Skeletal muscle mitoribosomal defects are linked to low bone mass caused by bone marrow inflammation in male mice, J. Cachexia Sarcopenia Muscle, 13, 1785, 10.1002/jcsm.12975 · DOI
- Li, 2018, PPAR-Gamma and Wnt regulate the differentiation of MSCs into adipocytes and osteoblasts respectively, Curr. Stem Cell Res. Ther., 13, 185, 10.2174/1574888X12666171012141908 · DOI
- Soós, 2022, Effects of targeted therapies on bone in rheumatic and musculoskeletal diseases, Nat. Rev. Rheumatol., 18, 249, 10.1038/s41584-022-00764-w · DOI
- Cui, 2022, A bone-targeted engineered exosome platform delivering siRNA to treat osteoporosis, Bioact. Mater., 10, 207
- Jiang, 2022, Engineered extracellular vesicles for bone therapy, Nano Today, 44, 10.1016/j.nantod.2022.101487 · DOI
- Kiesler, 2015, Experimental models of inflammatory bowel diseases, Cell. Mol. Gastroenterol. Hepatol., 1, 154, 10.1016/j.jcmgh.2015.01.006 · DOI
- Wirtz, 2017, Chemically induced mouse models of acute and chronic intestinal inflammation, Nat. Protoc., 12, 1295, 10.1038/nprot.2017.044 · DOI · Paper page
- Lee, 2014, TSG-6 as a biomarker to predict efficacy of human mesenchymal stem/progenitor cells (hMSCs) in modulating sterile inflammation in vivo, Proc. Natl. Acad. Sci. USA, 111, 16766, 10.1073/pnas.1416121111 · DOI
Cited by
Sorted by citations
Emerging role of exosomes in cancer therapy: progress and challenges
Li, J., Wang, J., & Chen, Z. (2025) · Molecular Cancer · doi:10.1186/s12943-024-02215-4 · Cited by 297
Li, X., Si, Y., Liang, J., Li, M., Wang, Z., Qin, Y., & Sun, L. (2024) · Journal of Colloid and Interface Science · doi:10.1016/j.jcis.2024.05.209 · Cited by 72
Chen, L., Zhu, J., Ge, N., Liu, Y., Yan, Z., Liu, G., Li, Y., Wang, Y., Wu, G., Qiu, T., et al. (2025) · Biomaterials · doi:10.1016/j.biomaterials.2024.122992 · Cited by 53
Metadata
- Authors
- Guo, J., Wang, F., Hu, Y., Luo, Y., Wei, Y., Xu, K., Zhang, H., Liu, H., Bo, L., Lv, S., Sheng, S., Zhuang, X., Zhang, T., Xu, C., Chen, X., & Su, J.
- Venue
- Cell Reports Medicine
- Publisher
- Elsevier BV
- Published
- 2023-01
- Volume
- 4
- Issue
- 1
- Pages
- 100881
- ISSN
- 2666-3791
- PMC
- PMC9873828
- Cited by
- 126
- References
- 6
- Language
- en
- Licence
- Funders
- National Natural Science Foundation of China (21QA1412000, 81871099, 82172098, 82230071)
- Ministry of Science and Technology of the People's Republic of China (2018YFC2001500)
- Shanghai Municipality Science and Technology Commission
- National Key Research and Development Program of China
- Shanghai Rising-Star Program
About these checks
Registry, retraction, Cites and statistics results are computed, not judged, with one exception: a printed reference that no index lists is read once by a model before it counts as a citation error. Claims are extracted by a model and kept only when their quote appears verbatim in the text; each cited source is then checked, with a model’s help, for whether it says what the claim relies on. Those verdicts can be wrong — read the claim’s quote and the cited source before relying on one.
Statistics and arithmetic are recomputed, not judged.
Confidence bands are shown only for fields calibrated on our annotated test set. None is calibrated yet, so no band is shown.
What counts as a claim ›How we measure confidence ›How we check this ›
Are you an author, or do you see a problem with this page? Request a review
