

The DOI matches its Crossref record; 42 of the 43 references it cites were found in a registry or an index.
Age-specific and sex-specific prevalence of cerebral β-amyloidosis, tauopathy, and neurodegeneration in cognitively unimpaired individuals aged 50–95 years: a cross-sectional study
Open accessAbstract
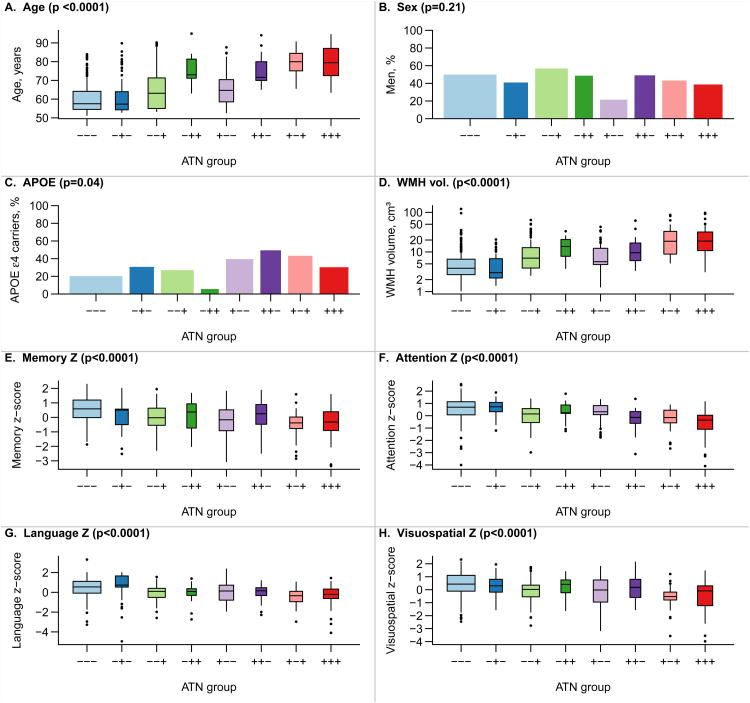
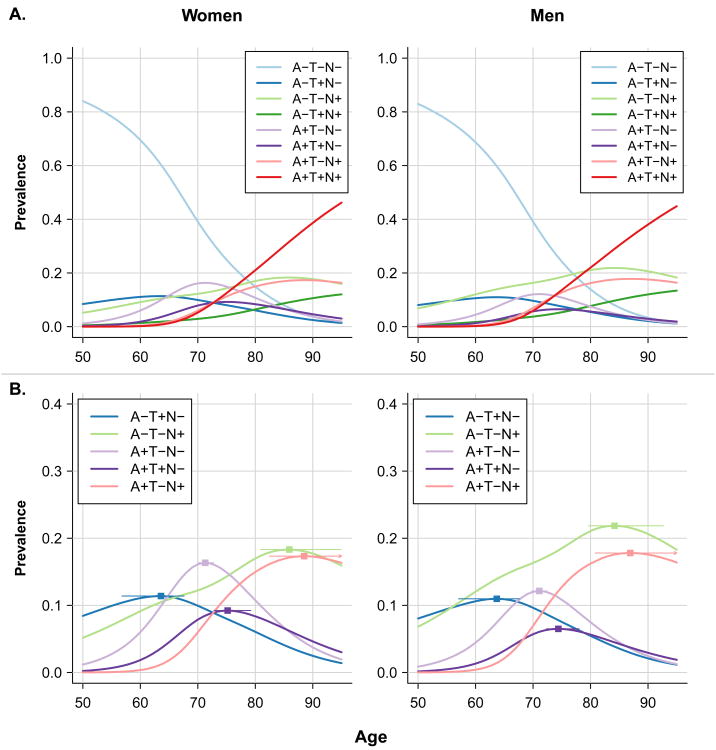
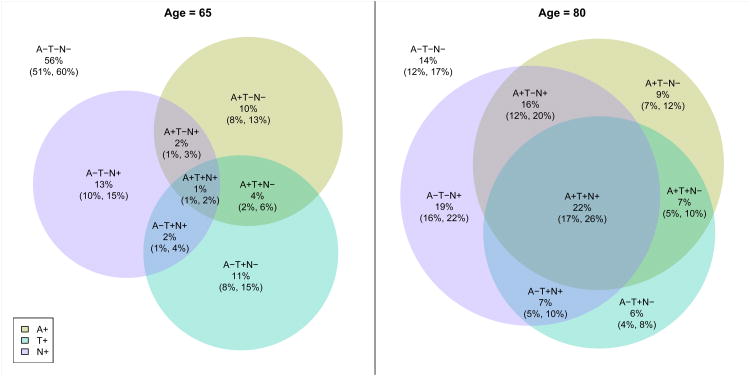
Background A new classification for biomarkers in Alzheimer's disease and cognitive ageing research is based on grouping the markers into three categories: amyloid deposition (A), tauopathy (T), and neurodegeneration or neuronal injury (N). Dichotomising these biomarkers as normal or abnormal results in eight possible profiles. We determined the clinical characteristics and prevalence of each ATN profile in cognitively unimpaired individuals aged 50 years and older. Methods All participants were in the Mayo Clinic Study of Aging, a population-based study that uses a medical records linkage system to enumerate all individuals aged 50-89 years in Olmsted County, MN, USA. Potential participants are randomly selected, stratified by age and sex, and invited to participate in cognitive assessments; individuals without medical contraindications are invited to participate in brain imaging studies. Participants who were judged clinically as having no cognitive impairment and underwent multimodality imaging between Oct 11, 2006, and Oct 5, 2016, were included in the current study. Participants were classified as having normal (A-) or abnormal (A+) amyloid using amyloid PET, normal (T-) or abnormal (T+) tau using tau PET, and normal (N-) or abnormal (N+) neurodegeneration or neuronal injury using cortical thickness assessed by MRI. We used the cutoff points of standard uptake value ratio (SUVR) 1·42 (centiloid 19) for amyloid PET, 1·23 SUVR for tau PET, and 2·67 mm for MRI cortical thickness. Age-specific and sex-specific prevalences of the eight groups were determined using multinomial models combining data from 435 individuals with amyloid PET, tau PET, and MRI assessments, and 1113 individuals who underwent amyloid PET and MRI, but not tau PET imaging. Findings The numbers of participants in each profile group were 165 A-T-N-, 35 A-T+N-, 63 A-T-N+, 19 A-T+N+, 44 A+T-N-, 25 A+T+N-, 35 A+T-N+, and 49 A+T+N+. Age differed by ATN group (p<0·0001), ranging from a median 58 years (IQR 55-64) in A-T-N- and 57 years (54-64) in A-T+N- to a median 80 years (75-84) in A+T-N+ and 79 years (73-87) in A+T+N+. The number of APOE ε4 carriers differed by ATN group (p=0·04), with carriers roughly twice as frequent in each A+ group versus the corresponding A- group. White matter hyperintensity volume (p<0·0001) and cognitive performance (p<0·0001) also differed by ATN group. Tau PET and neurodegeneration biomarkers were discordant in most individuals who would be categorised as stage 2 or 3 preclinical Alzheimer's disease (A+T+N-, A+T-N+, and A+T+N+; 86% at age 65 years and 51% at age 80 years) or with suspected non-Alzheimer's pathophysiology (A-T+N-, A-T-N+, and A-T+N+; 92% at age 65 years and 78% at age 80 years). From age 50 years, A-T-N- prevalence declined and A+T+N+ and A-T+N+ prevalence increased. In both men and women, A-T-N- was the most prevalent until age late 70s. After about age 80 years, A+T+N+ was most prevalent. By age 85 years, more than 90% of men and women had one or more biomarker abnormalities. Interpretation Biomarkers of fibrillar tau deposition can be included with those of β-amyloidosis and neurodegeneration or neuronal injury to more fully characterise the heterogeneous pathological profiles in the population. Both amyloid- dependent and amyloid-independent pathological profiles can be identified in the cognitively unimpaired population. The prevalence of each ATN group changed substantially with age, with progression towards more biomarker abnormalities among individuals who remained cognitively unimpaired. Funding National Institute on Aging (part of the US National Institutes of Health), the Alexander Family Professorship of Alzheimer's Disease Research, the Mayo Clinic, and the GHR Foundation.
Overview
The claims and statistics of this paper haven’t been checked yet.
Run the check — free, no account needed. It reads the open-access text and checks the sources it cites.
Integrity signals
Registry
Cites
Statistics
Figures
Verification
Claims the paper makes
The claims and statistics of this paper haven’t been checked yet.
Run the check — free, no account needed. It reads the open-access text and checks the sources it cites.
Claims other papers make about this one
Each is checked against this paper’s own text: does it say what the citing paper says it does?
The source backs part of the claim, not all of it — or backs it for a different population, condition or comparison.
In the citing paper
“Up to 60% of CU individuals over age 80 years have AD neuropathologic changes at autopsy or by biomarkers [60,152,212–214].”
From NIA‐AA Research Framework: Toward a biological definition of Alzheimer's disease (2018) · cites this paper as [152]
Experimental — accuracy not yet measuredThe cited source says what the claim attributes to it.
In the citing paper
“We believe that A+T−(N)+ represents evidence of comorbidity, that is, A+T− represents Alzheimer’s pathologic change while in the A+T− context, (N) + represents evidence of non-AD neurodegeneration/neuronal injury [152] and thus A+T−(N)− and A+T−(N)+ indicate meaningfully different pathologic states [153].”
From NIA‐AA Research Framework: Toward a biological definition of Alzheimer's disease (2018) · cites this paper as [152]
Self-check
Percentages, sums and reported differences re-computed from the paper’s own numbers.
The self-check needs the paper’s full text.
Citations
Cites
McKhann, G. M., Knopman, D. S., Chertkow, H., Hyman, B. T., Jack, C. R., Kawas, C. H., Klunk, W. E., Koroshetz, W. J., Manly, J. J., Mayeux, R., et al. (2011) · Alzheimer's & Dementia · doi:10.1016/j.jalz.2011.03.005 · Cited by 18,657
Self-citationAlbert, M. S., DeKosky, S. T., Dickson, D., Dubois, B., Feldman, H. H., Fox, N. C., Gamst, A., Holtzman, D. M., Jagust, W. J., Petersen, R. C., et al. (2011) · Alzheimer's & Dementia · doi:10.1016/j.jalz.2011.03.008 · Cited by 10,152
Self-citationSperling, R. A., Aisen, P. S., Beckett, L. A., Bennett, D. A., Craft, S., Fagan, A. M., Iwatsubo, T., Jack, C. R., Kaye, J., Montine, T. J., et al. (2011) · Alzheimer's & Dementia · doi:10.1016/j.jalz.2011.03.003 · Cited by 7,155
Self-citationJack, C. R., Knopman, D. S., Jagust, W. J., Petersen, R. C., Weiner, M. W., Aisen, P. S., Shaw, L. M., Vemuri, P., Wiste, H. J., Weigand, S. D., et al. (2013) · The Lancet Neurology · doi:10.1016/s1474-4422(12)70291-0 · Cited by 4,396
Self-citationAdvancing research diagnostic criteria for Alzheimer's disease: the IWG-2 criteria
Dubois, B., Feldman, H. H., Jacova, C., Hampel, H., Molinuevo, J. L., Blennow, K., DeKosky, S. T., Gauthier, S., Selkoe, D., Bateman, R., et al. (2014) · The Lancet Neurology · doi:10.1016/s1474-4422(14)70090-0 · Cited by 3,321
Albert, M., DeKosky, S. T., Dickson, D. W., Dubois, B., Feldman, H., Fox, N. C., Gamst, A. C., Holtzman, D. M., Jagust, W. J., Petersen, R. C., et al. (2013) · FOCUS The Journal of Lifelong Learning in Psychiatry · doi:10.1176/appi.focus.11.1.96 · Cited by 2,643
Self-citationJack, C. R., Albert, M. S., Knopman, D. S., McKhann, G. M., Sperling, R. A., Carrillo, M. C., Thies, B., & Phelps, C. H. (2011) · Alzheimer's & Dementia · doi:10.1016/j.jalz.2011.03.004 · Cited by 2,042
Self-citationPreclinical Alzheimer’s Disease: Definition, Natural History, and Diagnostic Criteria
Dubois, B., Hampel, H., Feldman, H. H., Scheltens, P., Aisen, P., Andrieu, S., Bakardjian, H., Benali, H., Bertram, L., Blennow, K., et al. (2016) · Alzheimer's & Dementia · doi:10.1016/j.jalz.2016.02.002 · Cited by 1,925
Self-citationA/T/N: An unbiased descriptive classification scheme for Alzheimer disease biomarkers
Jack, C. R., Bennett, D. A., Blennow, K., Carrillo, M. C., Feldman, H. H., Frisoni, G. B., Hampel, H., Jagust, W. J., Johnson, K. A., Knopman, D. S., et al. (2016) · Neurology · doi:10.1212/wnl.0000000000002923 · Cited by 1,864
Self-citationPrimary age-related tauopathy (PART): a common pathology associated with human aging
Crary, J. F., Trojanowski, J. Q., Schneider, J. A., Abisambra, J. F., Abner, E. L., Alafuzoff, I., Arnold, S. E., Attems, J., Beach, T. G., Bigio, E. H., et al. (2014) · Acta Neuropathologica · doi:10.1007/s00401-014-1349-0 · Cited by 1,467
Self-citationThe Centiloid Project: standardizing quantitative amyloid plaque estimation by PET
Klunk, W. E., Koeppe, R. A., Price, J. C., Benzinger, T. L., Devous, M. D., Jagust, W. J., Johnson, K. A., Mathis, C. A., Minhas, D., Pontecorvo, M. J., et al. (2015) · Alzheimer's & Dementia · doi:10.1016/j.jalz.2014.07.003 · Cited by 1,348
CSF markers for incipient Alzheimer's disease
Blennow, K., & Hampel, H. (2003) · The Lancet Neurology · doi:10.1016/s1474-4422(03)00530-1 · Cited by 1,291
PET Imaging of Tau Deposition in the Aging Human Brain
Schöll, M., Lockhart, S. N., Schonhaut, D. R., O’Neil, J. P., Janabi, M., Ossenkoppele, R., Baker, S. L., Vogel, J. W., Faria, J., Schwimmer, H. D., et al. (2016) · Neuron · doi:10.1016/j.neuron.2016.01.028 · Cited by 1,214
Tau positron emission tomographic imaging in aging and early Alzheimer disease
Johnson, K. A., Schultz, A., Betensky, R. A., Becker, J. A., Sepulcre, J., Rentz, D., Mormino, E., Chhatwal, J., Amariglio, R., Papp, K., et al. (2016) · Annals of Neurology · doi:10.1002/ana.24546 · Cited by 986
Defining imaging biomarker cut points for brain aging and Alzheimer's disease
Jack, C. R., Wiste, H. J., Weigand, S. D., Therneau, T. M., Lowe, V. J., Knopman, D. S., Gunter, J. L., Senjem, M. L., Jones, D. T., Kantarci, K., et al. (2017) · Alzheimer's & Dementia · doi:10.1016/j.jalz.2016.08.005 · Cited by 931
Self-citationRoberts, R. O., Geda, Y. E., Knopman, D. S., Cha, R. H., Pankratz, V. S., Boeve, B. F., Ivnik, R. J., Tangalos, E. G., Petersen, R. C., & Rocca, W. A. (2008) · Neuroepidemiology · doi:10.1159/000115751 · Cited by 797
Self-citationTau and Aβ imaging, CSF measures, and cognition in Alzheimer’s disease
Brier, M. R., Gordon, B., Friedrichsen, K., McCarthy, J., Stern, A., Christensen, J., Owen, C., Aldea, P., Su, Y., Hassenstab, J., et al. (2016) · Science Translational Medicine · doi:10.1126/scitranslmed.aaf2362 · Cited by 734
Sauver, J. L. S., Grossardt, B. R., Leibson, C. L., Yawn, B. P., Melton, L. J., & Rocca, W. A. (2012) · Mayo Clinic Proceedings · doi:10.1016/j.mayocp.2011.11.009 · Cited by 652
Self-citationMarquié, M., Normandin, M. D., Vanderburg, C. R., Costantino, I. M., Bien, E. A., Rycyna, L. G., Klunk, W. E., Mathis, C. A., Ikonomovic, M. D., Debnath, M. L., et al. (2015) · Annals of Neurology · doi:10.1002/ana.24517 · Cited by 615
Jack, C. R., Knopman, D. S., Weigand, S. D., Wiste, H. J., Vemuri, P., Lowe, V., Kantarci, K., Gunter, J. L., Senjem, M. L., Ivnik, R. J., et al. (2012) · Annals of Neurology · doi:10.1002/ana.22628 · Cited by 602
Self-citationPreclinical Alzheimer's disease and its outcome: a longitudinal cohort study
Vos, S. J., Xiong, C., Visser, P. J., Jasielec, M. S., Hassenstab, J., Grant, E. A., Cairns, N. J., Morris, J. C., Holtzman, D. M., & Fagan, A. M. (2013) · The Lancet Neurology · doi:10.1016/s1474-4422(13)70194-7 · Cited by 564
Head size, age and gender adjustment in MRI studies: a necessary nuisance?
Barnes, J., Ridgway, G. R., Bartlett, J. W., Henley, S. M. D., Lehmann, M., Hobbs, N. Z., Clarkson, M. J., MacManus, D. G., Sebastien Ourselin, A., & Fox, N. C. (2010) · NeuroImage · doi:10.1016/j.neuroimage.2010.06.025 · Cited by 513
Tau imaging: early progress and future directions
Villemagne, V. L., Fodero-Tavoletti, M. T., Masters, C. L., & Rowe, C. C. (2015) · The Lancet Neurology · doi:10.1016/s1474-4422(14)70252-2 · Cited by 501
An autoradiographic evaluation of AV-1451 Tau PET in dementia
Lowe, V. J., Curran, G., Fang, P., Liesinger, A. M., Josephs, K. A., Parisi, J. E., Kantarci, K., Boeve, B. F., Pandey, M. K., Bruinsma, T., et al. (2016) · Acta Neuropathologica Communications · doi:10.1186/s40478-016-0315-6 · Cited by 474
Self-citationSchwarz, A. J., Yu, P., Miller, B. B., Shcherbinin, S., Dickson, J., Navitsky, M., Joshi, A. D., Devous, M. D., & Mintun, M. S. (2016) · Brain · doi:10.1093/brain/aww023 · Cited by 425
Schwarz, C. G., Gunter, J. L., Wiste, H. J., Przybelski, S. A., Weigand, S. D., Ward, C. P., Senjem, M. L., Vemuri, P., Murray, M. E., Dickson, D. W., et al. (2016) · NeuroImage Clinical · doi:10.1016/j.nicl.2016.05.017 · Cited by 422
Self-citationNelson, P. T., Head, E., Schmitt, F. A., Davis, P. R., Neltner, J. H., Jicha, G. A., Abner, E. L., Smith, C. D., Van Eldik, L. J., Kryscio, R. J., et al. (2011) · Acta Neuropathologica · doi:10.1007/s00401-011-0826-y · Cited by 365
Vulnerable Neural Systems and the Borderland of Brain Aging and Neurodegeneration
Jagust, W. J. (2013) · Neuron · doi:10.1016/j.neuron.2013.01.002 · Cited by 334
Mormino, E. C., Betensky, R. A., Hedden, T., Schultz, A. P., Amariglio, R. E., Rentz, D. M., Johnson, K. A., & Sperling, R. A. (2014) · JAMA Neurology · doi:10.1001/jamaneurol.2014.2031 · Cited by 328
Gouw, A. A., Seewann, A., Vrenken, H., van der Flier, W. M., Rozemuller, J. M., Barkhof, F., Scheltens, P., & Geurts, J. J. G. (2008) · Brain · doi:10.1093/brain/awn265 · Cited by 281
Jack, C. R., Wiste, H. J., Weigand, S. D., Knopman, D. S., Mielke, M. M., Vemuri, P., Lowe, V. J., Senjem, M. L., Gunter, J. L., Reyes, D. A., et al. (2015) · Brain · doi:10.1093/brain/awv283 · Cited by 258
Self-citationBurnham, S. C., Bourgeat, P., Doré, V., Savage, G., Brown, B., Laws, S., Maruff, P., Salvado, O., Ames, D., Martins, R. N., et al. (2016) · The Lancet Neurology · doi:10.1016/s1474-4422(16)30125-9 · Cited by 207
Brain injury biomarkers are not dependent on β‐amyloid in normal elderly
Knopman, D. S., Jack, C. R., Wiste, H. J., Weigand, S. D., Vemuri, P., Lowe, V. J., Kantarci, K., Gunter, J. L., Senjem, M. L., Mielke, M. M., et al. (2013) · Annals of Neurology · doi:10.1002/ana.23816 · Cited by 183
Self-citationPreclinical AD predicts decline in memory and executive functions in subjective complaints
van Harten, A. C., Smits, L. L., Teunissen, C. E., Visser, P. J., Koene, T., Blankenstein, M. A., Scheltens, P., & van der Flier, W. M. (2013) · Neurology · doi:10.1212/wnl.0b013e3182a8418b · Cited by 143
Mild cognitive impairment with suspected nonamyloid pathology (SNAP): Prediction of progression
Caroli, A., Prestia, A., Galluzzi, S., Ferrari, C., van der Flier, W. M., Ossenkoppele, R., Van Berckel, B., Barkhof, F., Teunissen, C., Wall, A. E., et al. (2015) · Neurology · doi:10.1212/wnl.0000000000001209 · Cited by 142
Self-citationGordon, B. A., Blazey, T., Su, Y., Fagan, A. M., Holtzman, D. M., Morris, J. C., & Benzinger, T. L. S. (2016) · JAMA Neurology · doi:10.1001/jamaneurol.2016.2642 · Cited by 105
Thrombogenic microvesicles and white matter hyperintensities in postmenopausal women
Raz, L., Jayachandran, M., Tosakulwong, N., Lesnick, T. G., Wille, S. M., Murphy, M. C., Senjem, M. L., Gunter, J. L., Vemuri, P., Jack, C. R., et al. (2013) · Neurology · doi:10.1212/wnl.0b013e3182840c9f · Cited by 102
Self-citationVos, S. J. B., Gordon, B. A., Su, Y., Visser, P. J., Holtzman, D. M., Morris, J. C., Fagan, A. M., & Benzinger, T. L. S. (2016) · Neurobiology of Aging · doi:10.1016/j.neurobiolaging.2016.03.025 · Cited by 98
Insights into CNS ageing from animal models of senescence
Yeoman, M. S., Scutt, G., & Faragher, R. (2012) · Nature reviews. Neuroscience · doi:10.1038/nrn3230 · Cited by 98
Suspected non-AD pathology in mild cognitive impairment
Wisse, L. E. M., Butala, N., Das, S. R., Davatzikos, C., Dickerson, B. C., Vaishnavi, S. N., Yushkevich, P. A., & Wolk, D. A. (2015) · Neurobiology of Aging · doi:10.1016/j.neurobiolaging.2015.08.029 · Cited by 78
Mormino, E. C., Papp, K. V., Rentz, D. M., Schultz, A. P., LaPoint, M. R., Amariglio, R. E., Hanseeuw, B. J., Marshall, G. A., Hedden, T., Johnson, K. A., et al. (2016) · JAMA Neurology · doi:10.1001/jamaneurol.2016.2237 · Cited by 63
Does amyloid deposition produce a specific atrophic signature in cognitively normal subjects?
Whitwell, J. L., Tosakulwong, N., Weigand, S. D., Senjem, M. L., Lowe, V. J., Gunter, J. L., Boeve, B. F., Knopman, D. S., Dickerson, B. C., Petersen, R. C., et al. (2013) · NeuroImage Clinical · doi:10.1016/j.nicl.2013.01.006 · Cited by 47
Self-citation
Cited by
Sorted by citations
NIA‐AA Research Framework: Toward a biological definition of Alzheimer's disease
Jack, C. R., Bennett, D. A., Blennow, K., Carrillo, M. C., Dunn, B., Haeberlein, S. B., Holtzman, D. M., Jagust, W., Jessen, F., Karlawish, J., et al. (2018) · Alzheimer's & Dementia · doi:10.1016/j.jalz.2018.02.018 · Cited by 10,537
Self-citationLimbic-predominant age-related TDP-43 encephalopathy (LATE): consensus working group report
Nelson, P. T., Dickson, D. W., Trojanowski, J. Q., Jack, C. R., Boyle, P. A., Arfanakis, K., Rademakers, R., Alafuzoff, I., Attems, J., Brayne, C., et al. (2019) · Brain · doi:10.1093/brain/awz099 · Cited by 1,547
Self-citationReligious Orders Study and Rush Memory and Aging Project
Bennett, D. A., Buchman, A. S., Boyle, P. A., Barnes, L. L., Wilson, R. S., & Schneider, J. A. (2018) · Journal of Alzheimer's Disease · doi:10.3233/jad-179939 · Cited by 1,260
Sex differences in Alzheimer disease — the gateway to precision medicine
for the Women’s Brain Project and the Alzheimer Precision Medicine Initiative, Ferretti, M. T., Iulita, M. F., Cavedo, E., Chiesa, P. A., Schumacher Dimech, A., Santuccione Chadha, A., Baracchi, F., Girouard, H., Misoch, S., et al. (2018) · Nature Reviews Neurology · doi:10.1038/s41582-018-0032-9 · Cited by 1,009
A critical appraisal of amyloid-β-targeting therapies for Alzheimer disease
Panza, F., Lozupone, M., Logroscino, G., & Imbimbo, B. P. (2019) · Nature Reviews Neurology · doi:10.1038/s41582-018-0116-6 · Cited by 965
Metadata
- Authors
- Jack, C. R., Wiste, H. J., Weigand, S. D., Therneau, T. M., Knopman, D. S., Lowe, V., Vemuri, P., Mielke, M. M., Roberts, R. O., Machulda, M. M., Senjem, M. L., Gunter, J. L., Rocca, W. A., & Petersen, R. C.
- Affiliations
- Mayo Clinic (US)
- Corresponding author
- Jack, Clifford R
- ORCID
- Venue
- The Lancet Neurology
- Publisher
- Elsevier BV
- Published
- 2017-06
- Volume
- 16
- Issue
- 6
- Pages
- 435-444
- ISSN
- 1474-4422 (ISSN-L)
- PMC
- PMC5516534
- OpenAlex
- W2608642452
- Cited by
- 333
- References
- 43
- Citations by year
- 2026: 28 · 2025: 27 · 2024: 42 · 2023: 26 · 2022: 39 · 2021: 39 · 2020: 36 · 2019: 46 · 2018: 41 · 2017: 9
- FWCI
- 29.66
- Type
- journal article
- Language
- en
- Open access
- green
- www.ncbi.nlm.nih.gov
- Licence
- Locations
- The Lancet Neurology (publishedVersion)
- PubMed (publishedVersion)
- Europe PMC (PubMed Central) (acceptedVersion, cc-by)
- PubMed Central (acceptedVersion, cc-by)
- Funders
- Mayo Clinic
- National Institutes of Health
- National Institute on Aging (R01AG034676, U01AG006786, R01AG011378, R01AG041851, R37AG011378)
- National Institute of Neurological Disorders and Stroke (R01NS097495)
- Topics
- Health Sciences › Medicine › Psychiatry and Mental health › Dementia and Cognitive Impairment Research
- Life Sciences › Neuroscience › Cellular and Molecular Neuroscience › Alzheimer's disease research and treatments
- Health Sciences › Medicine › Oncology › Cancer-related cognitive impairment studies
- Keywords
- Alzheimer's disease biomarkers, tauopathy, neurodegeneration, cognitively unimpaired older adults, amyloid PET, tau PET, cortical thickness, prevalence, age-specific prevalence, sex differences, Mayo Clinic Study of Aging, cognitive aging, neuroimaging biomarkers, centiloid, standard uptake value ratio, multimodal neuroimaging
- MeSH terms
- Age Factors, Aged, Aged, 80 and over, Amyloidosis, Cross-Sectional Studies, Female, Humans, Magnetic Resonance Imaging, Male, Middle Aged, Minnesota, Sex Factors, Biomarkers, Prevalence, Amyloid beta-Peptides, Neurodegenerative Diseases, Tauopathies, Positron-Emission Tomography
About these checks
Registry, retraction, Cites and statistics results are computed, not judged, with one exception: a printed reference that no index lists is read once by a model before it counts as a citation error. Claims are extracted by a model and kept only when their quote appears verbatim in the text; each cited source is then checked, with a model’s help, for whether it says what the claim relies on. Those verdicts can be wrong — read the claim’s quote and the cited source before relying on one.
Statistics and arithmetic are recomputed, not judged.
Confidence bands are shown only for fields calibrated on our annotated test set. None is calibrated yet, so no band is shown.
What counts as a claim ›How we measure confidence ›How we check this ›
Are you an author, or do you see a problem with this page? Request a review
