

The DOI matches its Crossref record; 4 of the 4 references it cites were found in a registry or an index.
Understanding longevity in Hong Kong: a comparative study with long-living, high-income countries
Overview
The claims and statistics of this paper haven’t been checked yet.
Run the check — free, no account needed. It reads the open-access text and checks the sources it cites.
Integrity signals
Registry
Cites
Statistics
Figures
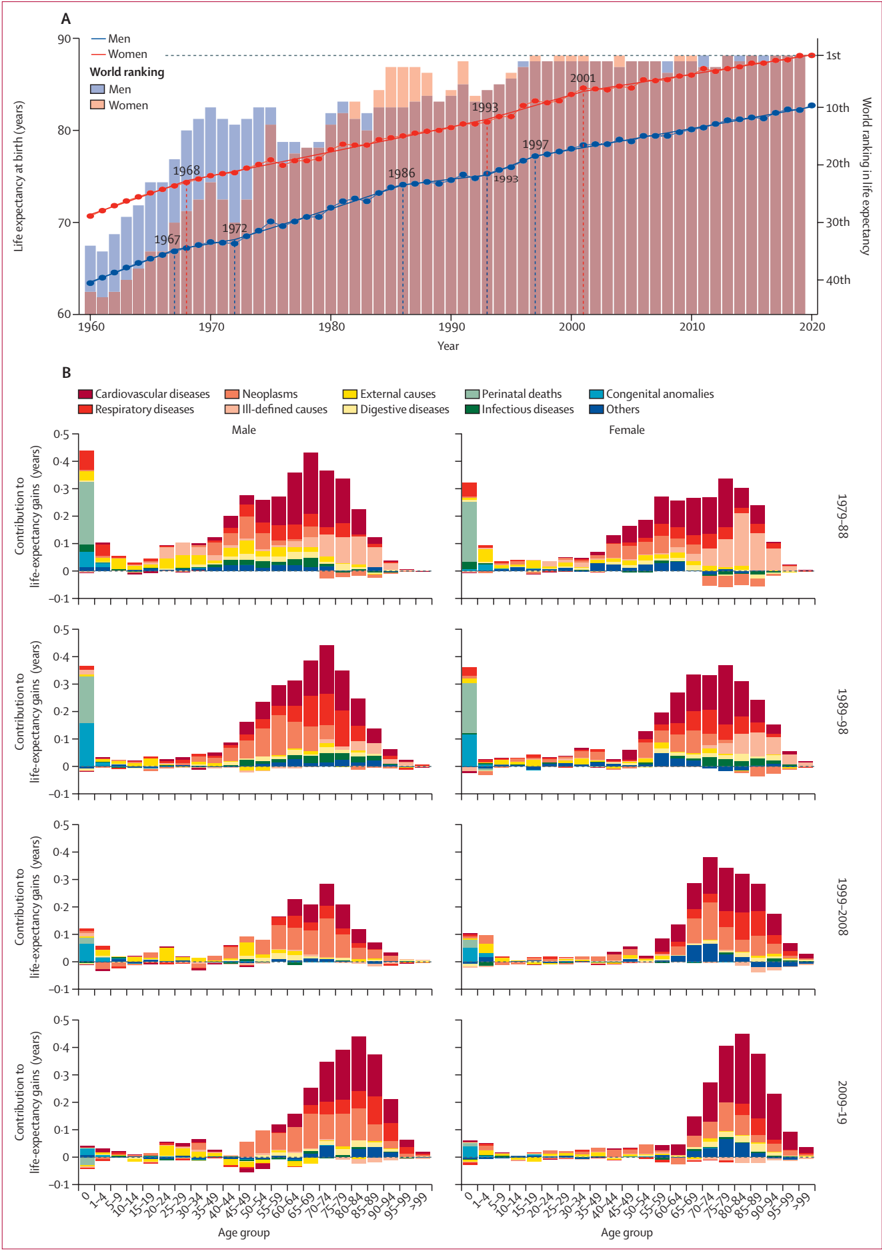
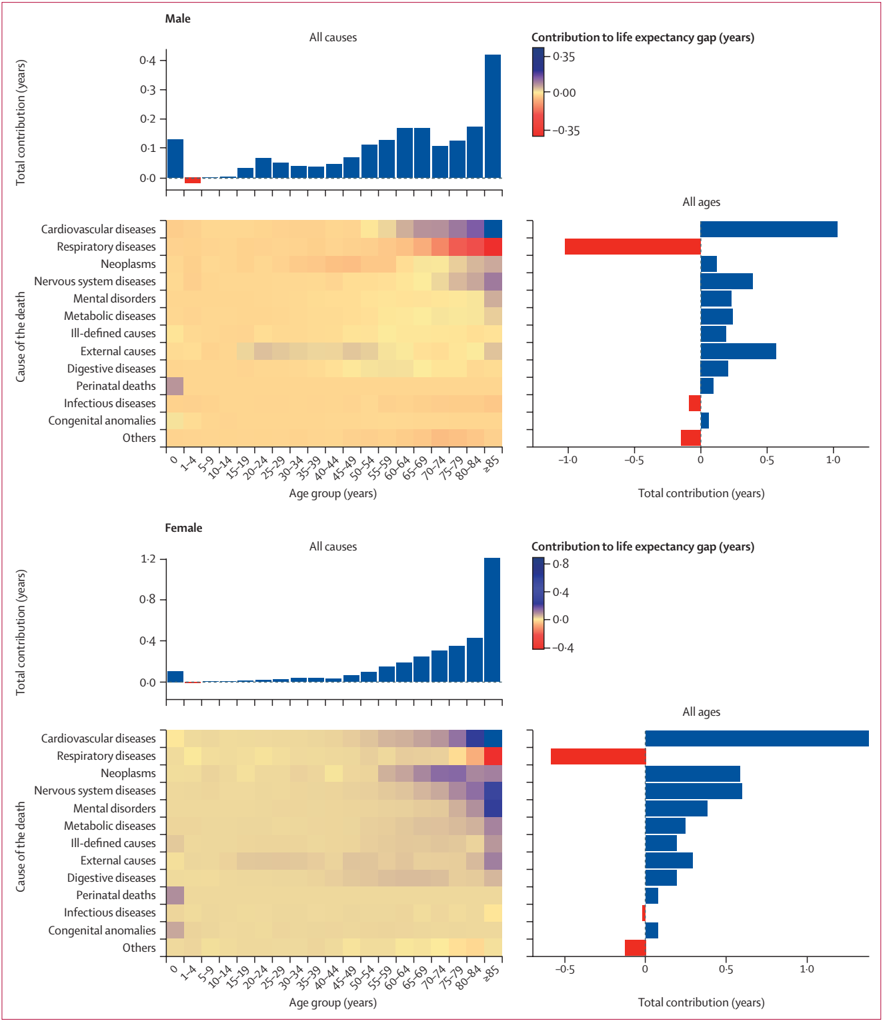
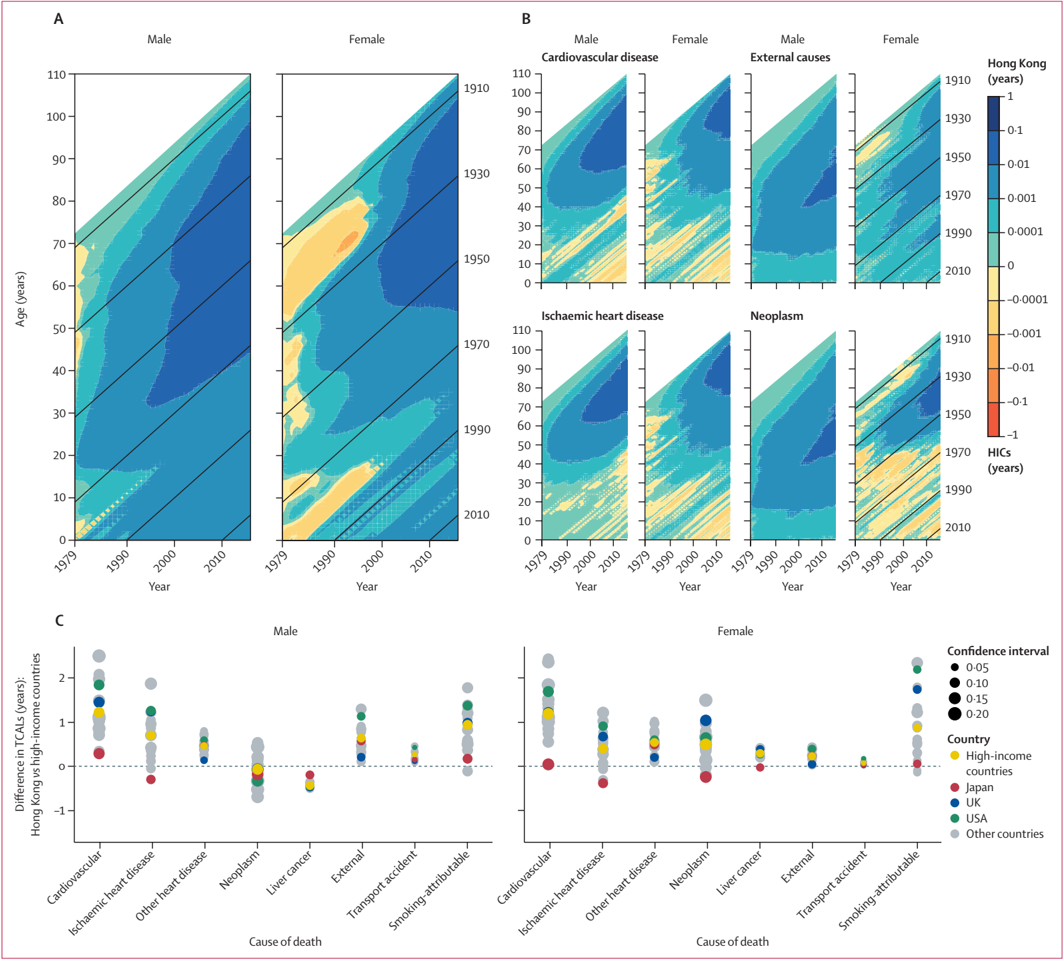
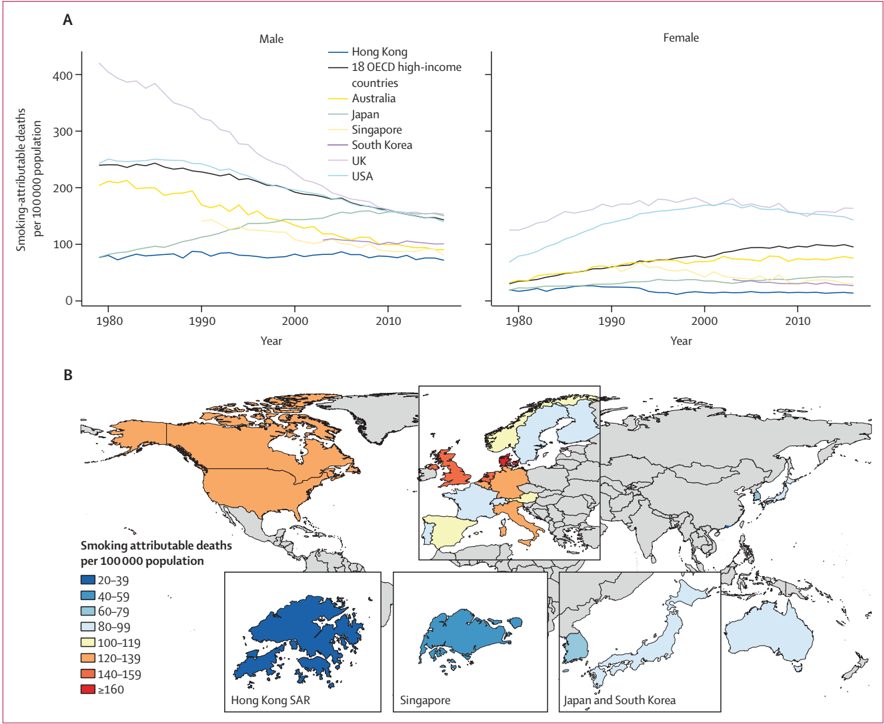
Verification
Claims the paper makes
The claims and statistics of this paper haven’t been checked yet.
Run the check — free, no account needed. It reads the open-access text and checks the sources it cites.
Claims other papers make about this one
Each is checked against this paper’s own text: does it say what the citing paper says it does?
The source backs part of the claim, not all of it — or backs it for a different population, condition or comparison.
In the citing paper
“Using these data, we found that the only populations to experience the required 0.3-year annual improvement or 3.0-year decennial improvement in life expectancy that operationally defines radical life extension (see Supplementary Note 2) were South Korea and Hong Kong17.”
From Implausibility of radical life extension in humans in the twenty-first century (2024) · cites this paper as [17]
Experimental — accuracy not yet measured
Self-check
Percentages, sums and reported differences re-computed from the paper’s own numbers.
The self-check needs the paper’s full text.
Citations
Cites
Social determinants of health inequalities
Marmot, M. (2005) · The Lancet · doi:10.1016/s0140-6736(05)71146-6 · Cited by 5,086
Recent trends in life expectancy across high income countries: retrospective observational study
Ho, J. Y., & Hendi, A. S. (2018) · BMJ · doi:10.1136/bmj.k2562 · Cited by 439
Mortality from cancer in relation to smoking: 50 years observations on British doctors
Doll, R., Peto, R., Boreham, J., & Sutherland, I. (2005) · British Journal of Cancer · doi:10.1038/sj.bjc.6602359 · Cited by 392
Kinge, J. M., Modalsli, J. H., Øverland, S., Gjessing, H. K., Tollånes, M. C., Knudsen, A. K., Skirbekk, V., Strand, B. H., Håberg, S. E., & Vollset, S. E. (2019) · JAMA · doi:10.1001/jama.2019.4329 · Cited by 232
Research works printed but not linked: 41
- Kontis, 2020, Magnitude, demographics and dynamics of the effect of the first wave of the COVID-19 pandemic on all-cause mortality in 21 industrialized countries, Nat Med, 26, 1919, 10.1038/s41591-020-1112-0 · DOI · Paper page
- Andrasfay, 2021, Reductions in 2020 US life expectancy due to COVID-19 and the disproportionate impact on the Black and Latino populations, Proc Natl Acad Sci USA, 118, 10.1073/pnas.2014746118 · DOI
- Iacobucci, 2017, Increase in life expectancy in England has halted, new figures show, BMJ, 358
- Zhou, 2016, Cause-specific mortality for 240 causes in China during 1990–2013: a systematic subnational analysis for the Global Burden of Disease Study 2013, Lancet, 387, 251, 10.1016/S0140-6736(15)00551-6 · DOI
- Leung, 2017, Cohort profile: FAMILY cohort, Int J Epidemiol, 46, e1, 10.1093/ije/dyu257 · DOI
- Chung, 2010, How does socioeconomic development affect risk of mortality? An age-period-cohort analysis from a recently transitioned population in China, Am J Epidemiol, 171, 345, 10.1093/aje/kwp378 · DOI
- Kim, 2000, Permutation tests for joinpoint regression with applications to cancer rates, Stat Med, 19, 335, 10.1002/(SICI)1097-0258(20000215)19:3<335::AID-SIM336>3.0.CO;2-Z · DOI
- Arriaga, 1984, Measuring and explaining the change in life expectancies, Demography, 21, 83, 10.2307/2061029 · DOI · Paper page
- Bennett, 2018, Contributions of diseases and injuries to widening life expectancy inequalities in England from 2001 to 2016: a population-based analysis of vital registration data, Lancet Public Health, 3, e586, 10.1016/S2468-2667(18)30214-7 · DOI
- Canudas-Romo, 2020, Reflection on modern methods: cause of death decomposition of cohort survival comparisons, Int J Epidemiol, 49, 1712, 10.1093/ije/dyz276 · DOI
- Canudas-Romo, 2015, Truncated cross-sectional average length of life: a measure for comparing the mortality history of cohorts, Popul Stud, 69, 147, 10.1080/00324728.2015.1019955 · DOI
- Peto, 1992, Mortality from tobacco in developed countries: indirect estimation from national vital statistics, Lancet, 339, 1268, 10.1016/0140-6736(92)91600-D · DOI · Paper page
- Ezzati, 2003, Estimates of global mortality attributable to smoking in 2000, Lancet, 362, 847, 10.1016/S0140-6736(03)14338-3 · DOI · Paper page
- Liu, 1998, Emerging tobacco hazards in China: 1. Retrospective proportional mortality study of one million deaths, BMJ, 317, 1411, 10.1136/bmj.317.7170.1411 · DOI
- Lam, 2001, Mortality and smoking in Hong Kong: case-control study of all adult deaths in 1998, BMJ, 323, 361, 10.1136/bmj.323.7309.361 · DOI
- Burns, 1987, Immigration from China and the future of Hong Kong, Asian Surv, 27, 661, 10.2307/2644542 · DOI
- Oeppen, 2002, Demography. Broken limits to life expectancy, Science, 296, 1029, 10.1126/science.1069675 · DOI · Paper page
- Yao, 2019, Change in moderate alcohol consumption and quality of life: evidence from 2 population-based cohorts, CMAJ, 191, E753, 10.1503/cmaj.181583 · DOI
- Cao, 2015, Light to moderate intake of alcohol, drinking patterns, and risk of cancer: results from two prospective US cohort studies, BMJ, 351
- Liu, 2019, A territorywide prevalence study on blood-borne and enteric viral hepatitis in Hong Kong, J Infect Dis, 219, 1924, 10.1093/infdis/jiz038 · DOI
- Tian, 2019, Ambient particulate matter pollution and adult hospital admissions for pneumonia in urban China: a national time series analysis for 2014 through 2017, PLoS Med, 16, 10.1371/journal.pmed.1003010 · DOI
- Powles, 2010, National cardiovascular prevention should be based on absolute disease risks, not levels of risk factors, Eur J Public Health, 20, 103, 10.1093/eurpub/ckp067 · DOI
- Lopez, 2019, Is the long-term decline in cardiovascular-disease mortality in high-income countries over? Evidence from national vital statistics, Int J Epidemiol, 48, 1815, 10.1093/ije/dyz143 · DOI
- Adair, 2020, The role of overweight and obesity in adverse cardiovascular disease mortality trends: an analysis of multiple cause of death data from Australia and the USA, BMC Med, 18, 199, 10.1186/s12916-020-01666-y · DOI
- Carter, 2015, Smoking and mortality—beyond established causes, N Engl J Med, 372, 631, 10.1056/NEJMsa1407211 · DOI · Paper page
- Hyland, 2012, Smoke-free air policies: past, present and future, Tob Control, 21, 154, 10.1136/tobaccocontrol-2011-050389 · DOI
- Ma, 2021, Prevalence and trends in tobacco use among adolescents aged 13–15 years in 143 countries, 1999–2018: findings from the Global Youth Tobacco Surveys, Lancet Child Adolesc Health, 5, 245, 10.1016/S2352-4642(20)30390-4 · DOI
- Kendrick, 2021, Spatial, temporal, and demographic patterns in prevalence of chewing tobacco use in 204 countries and territories, 1990–2019: a systematic analysis from the Global Burden of Disease Study 2019, Lancet Public Health, 6, e482, 10.1016/S2468-2667(21)00065-7 · DOI
- Khan, 2019, Effects of nutritional supplements and dietary interventions on cardiovascular outcomes: an umbrella review and evidence map, Ann Intern Med, 171, 190, 10.7326/M19-0341 · DOI · Paper page
- Mackay, 1986, Effects of strong government measures against tobacco in Hong Kong, Br Med J (Clin Res Ed), 292, 1435, 10.1136/bmj.292.6533.1435 · DOI
- Zhao, 2017, The incomparability of cause of death statistics under “one country, two systems”: Shanghai versus Hong Kong, Popul Health Metr, 15, 37, 10.1186/s12963-017-0155-z · DOI
- Thun, 2000, Smoking vs other risk factors as the cause of smoking-attributable deaths: confounding in the courtroom, JAMA, 284, 706, 10.1001/jama.284.6.706 · DOI
- Boffetta, 2014, The Consortium on Health and Ageing: Network of Cohorts in Europe and the United States (CHANCES) project—design, population and data harmonization of a large-scale, international study, Eur J Epidemiol, 29, 929, 10.1007/s10654-014-9977-1 · DOI
- Ni, 2020, The epidemiology of population mental wellbeing in China, Lancet Public Health, 5, e631, 10.1016/S2468-2667(20)30265-6 · DOI
- Razum, 2006, Commentary: of salmon and time travellers—musing on the mystery of migrant mortality, Int J Epidemiol, 35, 919, 10.1093/ije/dyl143 · DOI
- Hastings, 2016, Mortality outcomes for Chinese and Japanese immigrants in the USA and countries of origin (Hong Kong, Japan): a comparative analysis using national mortality records from 2003 to 2011, BMJ Open, 6, 10.1136/bmjopen-2016-012201 · DOI
- Shen, 2013, Alcohol use and death from respiratory disease in a prospective Chinese elderly cohort study in Hong Kong, Prev Med, 57, 819, 10.1016/j.ypmed.2013.09.011 · DOI
- Oishi, 2014, Residents of poor nations have a greater sense of meaning in life than residents of wealthy nations, Psychol Sci, 25, 422, 10.1177/0956797613507286 · DOI · Paper page
- Ni, 2017, Longitudinal patterns and predictors of depression trajectories related to the 2014 Occupy Central/Umbrella Movement in Hong Kong, Am J Public Health, 107, 593, 10.2105/AJPH.2016.303651 · DOI
- Ni, 2020, Depression and post-traumatic stress during major social unrest in Hong Kong: a 10-year prospective cohort study, Lancet, 395, 273, 10.1016/S0140-6736(19)33160-5 · DOI · Paper page
- Ni, 2020, Determinants of physical, mental and social well-being: a longitudinal environment-wide association study, Int J Epidemiol, 49, 380, 10.1093/ije/dyz238 · DOI
Cited by
Sorted by citations
Implausibility of radical life extension in humans in the twenty-first century
Olshansky, S. J., Willcox, B. J., Demetrius, L., & Beltrán-Sánchez, H. (2024) · Nature Aging · doi:10.1038/s43587-024-00702-3 · Cited by 115
Metadata
- Authors
- Ni, M. Y., Canudas-Romo, V., Shi, J., Flores, F. P., Chow, M. S. C., Yao, X. I., Ho, S. Y., Lam, T. H., Schooling, C. M., Lopez, A. D., Ezzati, M., & Leung, G. M.
- Venue
- The Lancet Public Health
- Publisher
- Elsevier BV
- Published
- 2021-12
- Volume
- 6
- Issue
- 12
- Pages
- e919-e931
- ISSN
- 2468-2667
- Cited by
- 60
- References
- 4
- Language
- en
- Licence
- Funders
- University Grants Committee Research Grants Council
About these checks
Registry, retraction, Cites and statistics results are computed, not judged, with one exception: a printed reference that no index lists is read once by a model before it counts as a citation error. Claims are extracted by a model and kept only when their quote appears verbatim in the text; each cited source is then checked, with a model’s help, for whether it says what the claim relies on. Those verdicts can be wrong — read the claim’s quote and the cited source before relying on one.
Statistics and arithmetic are recomputed, not judged.
Confidence bands are shown only for fields calibrated on our annotated test set. None is calibrated yet, so no band is shown.
What counts as a claim ›How we measure confidence ›How we check this ›
Are you an author, or do you see a problem with this page? Request a review
