

Recognizing Indigenous Persistence by Dating Extensive Low-Density Indigenous Occupations across the AD 1480–1630 Radiocarbon Plateau in Wellfleet, Massachusetts
Open accessThe DOI matches its Crossref record; 68 of the 73 references it cites were found in a registry or an index, and 5 are not checked yet; none of the 66 sources its claims cite is checked for support yet.
Abstract
Archaeologists have relied on the presence of European material on Indigenous New England sites as the main indicator that a site was occupied during the sixteenth or early seventeenth centuries—a span often characterized as the Contact period. The AD 1480–1630 span is particularly difficult to sequence because it lies on a radiocarbon calibration plateau. Here we report on a program of AMS dating from an Indigenous site on Great Island on Cape Cod in Massachusetts that highlights evidence of widespread activity during the sixteenth and early seventeenth centuries—absent European material culture. Furthermore, the archaeological evidence indicates that a previously excavated colonial tavern in the same area on Great Island was the last in a long-term occupation in which “European contact” was not a defining event. Instead, the evidence points to a continuous Indigenous presence extending from the Middle Woodland period. Later colonial period activities, including those associated with European material, were mapped onto a long-standing Indigenous task-scape.
Checked 2026-11-20 · 5 references not checked yet
Overview
CoChat Summary
TL;DR
AMS dating at Great Island Site 2 in Wellfleet, Massachusetts, identifies six dates in the AD 1480–1630 radiocarbon plateau and shows sixteenth- to early seventeenth-century Indigenous activity without European material culture. The results indicate long-term continuous Indigenous occupation from the Middle Woodland through the colonial period, with a colonial tavern as the last stage of that occupation rather than a rupture.
Key findings
- Six of 22 AMS dates, from five units, fall in the AD 1480–1630 plateau; none of those plateau deposits contain European material, and most lack temporally diagnostic Indigenous material. Before this project, no Lower Cape sites had been attributed to the sixteenth or seventeenth centuries solely based on radiocarbon dates.
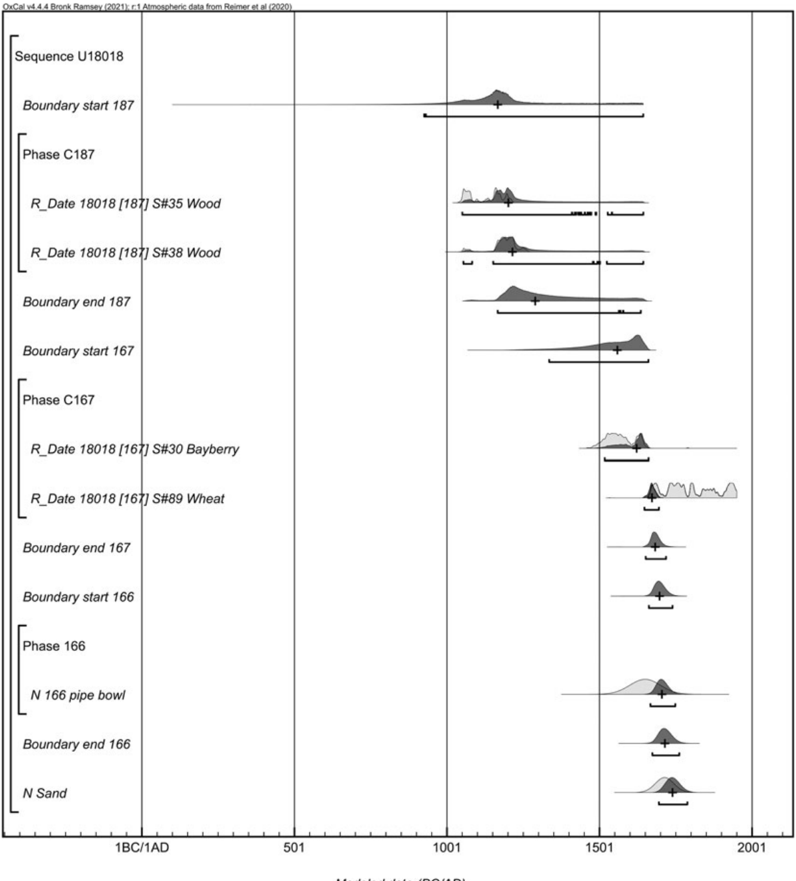
- Great Island Site 2 shows continuous long-term occupation: dates from the Middle Woodland to the colonial period are spatially and stratigraphically adjacent, with no appreciable break between Contact and colonial contexts. In unit 18018, the modeled sequence suggests a median difference of 11 years between Contact and colonial contexts; forced plateau-phase boundaries yield a 95.4% hpd range of 0–142 years (median 65 years) between the first two plateaus, a median 115-year Late Woodland–Contact interval, and a median 159-year Middle–Late Woodland interval.
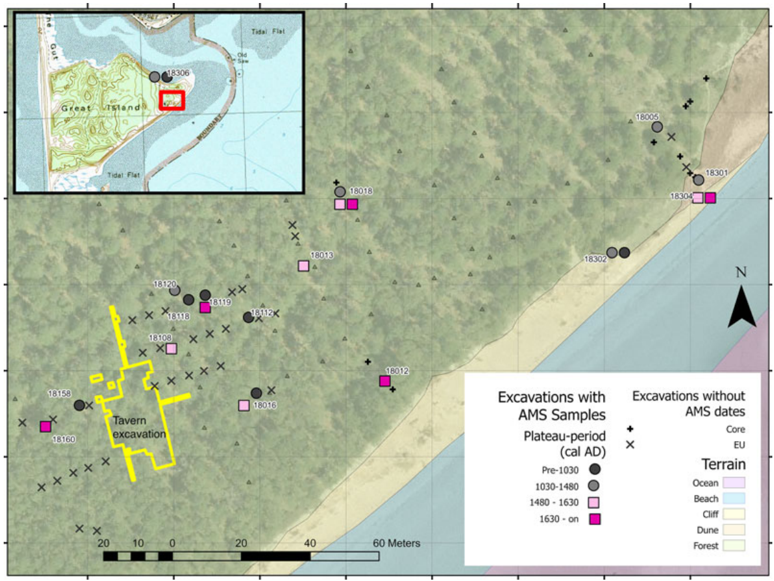
- The previously excavated colonial tavern, dated about AD 1690–1740, was the final stage of an extensive, repeated occupation. The current site is 11,870 m² and may have been larger in the past; the location was part of an active Indigenous landscape starting more than 3,000 years ago and was visited continuously for the past 1,500 years.
Methods
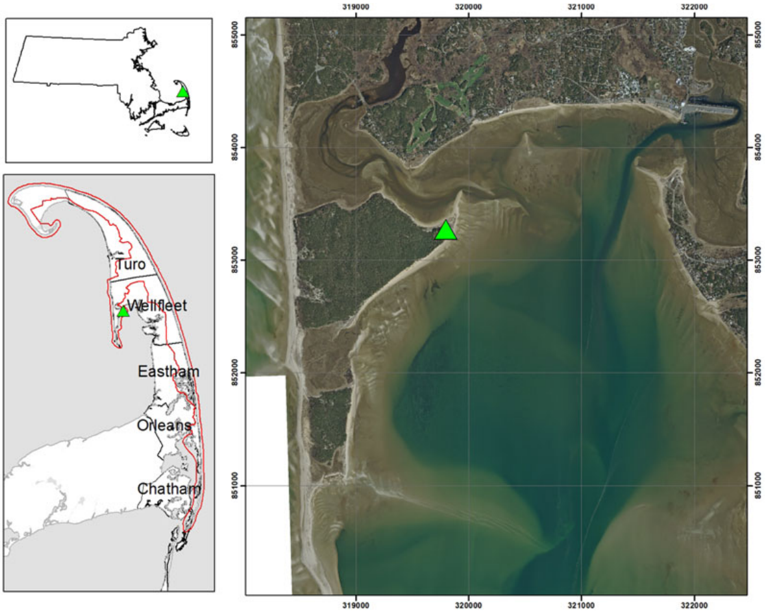
- The 2018 project by the Andrew Fiske Memorial Center for Archaeological Research worked on Great Island, Wellfleet, Massachusetts, for the US National Park Service at Cape Cod National Seashore; Wampanoag Tribal monitors served as field crew. Survey covered more than 250 × 75 m along the coastal bluff and included ground-penetrating radar transects, 58 excavation or coring locations, and cliff-face hand samples.
- AMS dates were obtained on 22 samples from 18 contexts across 16 excavation units; only dates on wood and carbonized seeds are presented. Dates were calibrated and modeled in OxCal 4.4 with IntCal20, using Bayesian models for the whole sequence and for sequential plateau phases.
- Contexts were assigned to periods based on AMS dates, stratigraphic position, and artifact content; analysis also used sum and kernel density plots to summarize date distributions.
Limitations
- The paper states that there are too few samples from Great Island Site 2 for a reliable assessment of the distribution of dates. It also states that most dates used to analyze the sequence are on wood (n = 18), whereas four are on seeds, and that old wood can make reconstructing occupational history difficult because dates on wood may be earlier than the targeted human activity.
- The paper states that the plateau-phase model is circular, assures good agreement, and violates basic assumptions of Bayesian statistics; using it to construct a new chronology or determine a new division would be disingenuous.
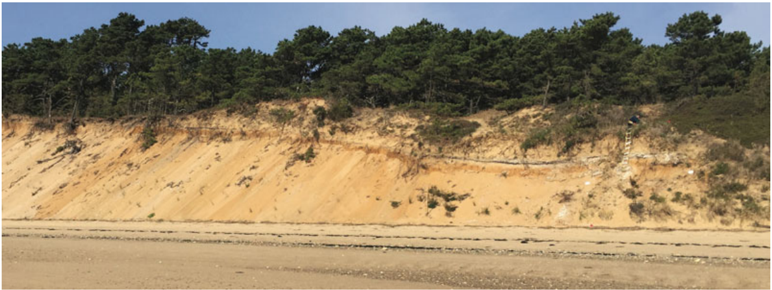
- The text makes evident that one AD 1480–1630 date (EU 18304) comes from a cliff-face sample with no artifact data, and that earlier survey work found site boundaries difficult to determine because of deep sand deposits and limited excavation depths.
Model-written summary. Check it against the paper before relying on it.
Integrity signals
Registry
Cites
Statistics
Figures




Verification
Claims the paper makes
0 Valid · 6 Not valid · 50 Not checked · 111 Own results and interpretations
None of the sources cited for this claim could be matched to a paper, so there is nothing to check it against.
In the paper
“Our results also show that a colonial tavern or whaling station on Great Island (Ekholm andDeetz 1970a, 1970b) was the last in a long-term occupation in which”
§ Recognizing Indigenous Persistence by Dating Extensive Low-Density Indigenous Occupations across the AD 1480-1630 Radiocarbon Plateau in Wellfleet, Massachusetts > Abstract
What the sources say
- Not matchedcites Ekholm and Deetz 1970a
More than one paper fits this citation.
- Not matchedcites Ekholm and Deetz 1970b
More than one paper fits this citation.
plainSingle case- Asserted: passes — The authors put it forward as true.
- Checkable: passes — It can be checked against evidence.
- Load-bearing: passes — The paper’s conclusions depend on it.
- Based: passes — The paper gives a reason why it holds.
- Not matched
A result the paper reports from its own data — it cites no other source for it, so there is none to check. The quote shows it is in the paper.
In the paper
“Here we report on a program of AMS dating from an Indigenous site on Great Island on Cape Cod in Massachusetts that highlights evidence of widespread activity during the sixteenth and early seventeenth centuries-absent European material culture.”
§ Recognizing Indigenous Persistence by Dating Extensive Low-Density Indigenous Occupations across the AD 1480-1630 Radiocarbon Plateau in Wellfleet, Massachusetts > Abstract
plainSingle case- Asserted: passes — The authors put it forward as true.
- Checkable: passes — It can be checked against evidence.
- Load-bearing: passes — The paper’s conclusions depend on it.
- Based: passes — The paper gives a reason why it holds.
A result the paper reports from its own data — it cites no other source for it, so there is none to check. The quote shows it is in the paper.
In the paper
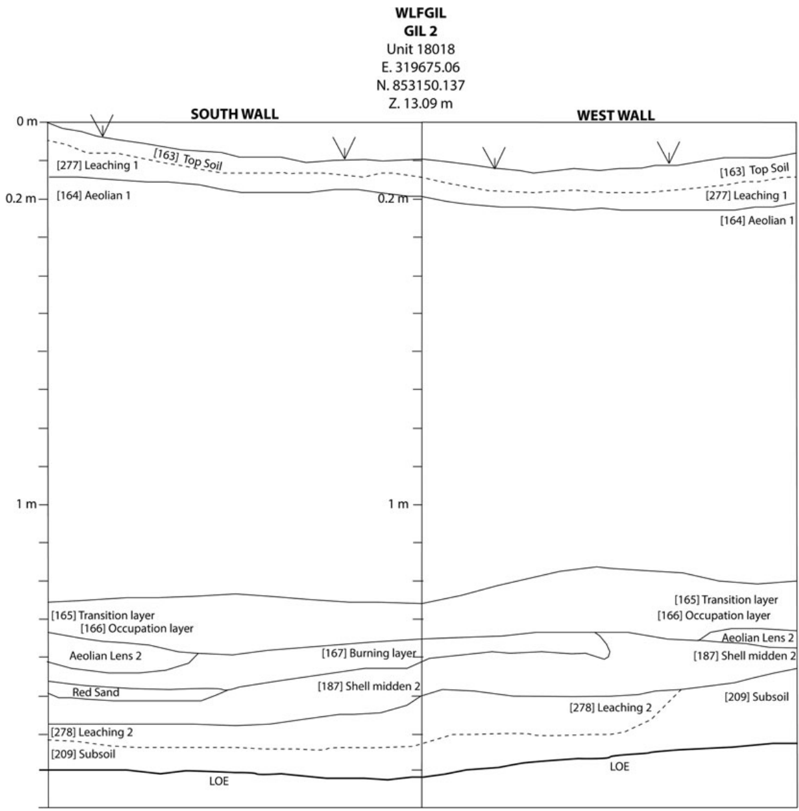
“The two early dates from the shell midden (187) layer immediately underneath the burning feature suggest that the shell midden was occupied during the earlier part of the Late Woodland.”
§ Recognizing Indigenous Persistence by Dating Extensive Low-Density Indigenous Occupations across the AD 1480-1630 Radiocarbon Plateau in Wellfleet, Massachusetts > EU 18018
hedgedstates an association- Asserted: passes — The authors put it forward as true.
- Checkable: passes — It can be checked against evidence.
- Load-bearing: unclear — It is unclear whether the paper’s conclusions depend on it.
- Based: passes — The paper gives a reason why it holds.
A result the paper reports from its own data — it cites no other source for it, so there is none to check. The quote shows it is in the paper.
In the paper
“The earliest date in that area is from the bottom of cliff-face sample 18302 (515), which yielded a Middle Woodland date.”
§ Recognizing Indigenous Persistence by Dating Extensive Low-Density Indigenous Occupations across the AD 1480-1630 Radiocarbon Plateau in Wellfleet, Massachusetts > Location and Distribution of AMS Dates
plainSingle case- Asserted: passes — The authors put it forward as true.
- Checkable: passes — It can be checked against evidence.
- Load-bearing: unclear — It is unclear whether the paper’s conclusions depend on it.
- Based: passes — The paper gives a reason why it holds.
A result the paper reports from its own data — it cites no other source for it, so there is none to check. The quote shows it is in the paper.
In the paper
“This AD 1480-1630 date comes from a charred pinecone in a sample taken from an eroding shell midden visible along the cliff face.”
§ Recognizing Indigenous Persistence by Dating Extensive Low-Density Indigenous Occupations across the AD 1480-1630 Radiocarbon Plateau in Wellfleet, Massachusetts > EU 18304
plainSingle case- Asserted: passes — The authors put it forward as true.
- Checkable: passes — It can be checked against evidence.
- Load-bearing: passes — The paper’s conclusions depend on it.
- Based: passes — The paper gives a reason why it holds.
77 more claims
Create a free account to see all 167 claims and to verify the 36 references still open.
- It may state two separate claims as one. 48
- Probably not a substantial claim. 50
- The quote only partly states this claim. 1
Citations
Cites
Bayesian Analysis of Radiocarbon Dates
Bronk Ramsey, C. (2009) · Radiocarbon · doi:10.1017/s0033822200033865 · Cited by 8,725
The IntCal20 Northern Hemisphere Radiocarbon Age Calibration Curve (0–55 cal kBP)
Reimer, P. J., Austin, W. E. N., Bard, E., Bayliss, A., Blackwell, P. G., Bronk Ramsey, C., Butzin, M., Cheng, H., Edwards, R. L., Friedrich, M., et al. (2020) · Radiocarbon · doi:10.1017/rdc.2020.41 · Cited by 7,900
Discussion Reporting of 14 C Data
Stuiver, M., & Polach, H. A. (1977) · Radiocarbon · doi:10.1017/s0033822200003672 · Cited by 5,640
Radiocarbon Calibration and Analysis of Stratigraphy: The OxCal Program
Bronk Ramsey, C. (1995) · Radiocarbon · doi:10.1017/s0033822200030903 · Cited by 2,409
Methods for Summarizing Radiocarbon Datasets
Ramsey, C. B. (2017) · Radiocarbon · doi:10.1017/rdc.2017.108 · Cited by 1,179
The use of summed radiocarbon probability distributions in archaeology: a review of methods
Williams, A. N. (2012) · Journal of Archaeological Science · doi:10.1016/j.jas.2011.07.014 · Cited by 478
Community-based archaeology: research with, by, and for indigenous and local communities
(2013) · Choice Reviews Online · doi:10.5860/choice.50-4516 · Cited by 464
Collaboration in archaeological practice: engaging descendant communities
(2008) · Choice Reviews Online · doi:10.5860/choice.46-0377 · Cited by 405
A note on the use of temporal frequency distributions in studies of prehistoric demography
Surovell, T. A., & Brantingham, P. J. (2007) · Journal of Archaeological Science · doi:10.1016/j.jas.2007.01.003 · Cited by 255
Culture Contact or Colonialism? Challenges in the Archaeology of Native North America
Silliman, S. W. (2005) · American Antiquity · doi:10.2307/40035268 · Cited by 254
Research works printed but not linked: 22
- Manning, Sturt W. 2020. Radiocarbon Dating, Bayesian Modeling, and American Archaeology. SAA Archaeological Record 20(4): 40-46.
- Steinberg, John M., Christa M. Beranek, Stephen A. Mrozowski, and Dennis V. Piechota. 2022. Inventory and Monitoring Endangered Sites, Great Island, Cape Cod National Seashore, Wellfleet, Massachusetts. Cultural Resource Management Study No. 87. Prepared by Andrew Fiske Memorial Center for Archaeological Research, University of Massachusetts, Boston. Prepared for National Park Service, Northeast Region Archaeology Program.
- Echeverria, Durand. 1993. A History of Billingsgate. Wellfleet Historical Society, Wellfleet, Massachusetts.
- Moffett, Ross. 1946. Some Shell Heaps in Truro, Massachusetts. Bulletin of the Massachusetts Archaeological Society 7(2):17-23.
- Birch, Jennifer, Sturt W. Manning, Megan Anne Conger, and Samantha M. Sanft. 2020. Introduction: Why Are We Dating Iroquoia? Building Chronologies to Write Enhanced Archaeological Histories. SAA Archaeological Record 20(4):38-39.
- Gould, D. Rae, Holly Herbster, Heather Law Pezzarossi, and Stephen A Mrozowski. 2020. Historical Archaeology and Indigenous Collaboration: Discovering Histories That Have Futures. University Press of Florida, Gainesville.
- McManamon, Francis P. 1984b. Prehistoric Cultural Adaptations and Their Evolution on Outer Cape Cod. In Chapters in the Archaeology of Cape Cod, I: Results of the Cape Cod National Seashore Archeological Survey, 1979-1981, Vol. 2: Other Specific Studies and Synthesis, edited by Francis P. McManoman, pp. 339-418. Cultural Resources Management Study No. 8. Division of Cultural Resources, North Atlantic Regional Office, National Park Service, US Department of the Interior, Boston.
- Borden, Simeon. 1844. Topographical Map of Massachusetts, Compiled from Astronomical, Trigonometrical, and Various Local Surveys Made by Order of the Legislature. Engraved by George G. Smith, 1:158,400 scale. S. Borden, Boston.
- McManamon, Francis P., and James W. Bradley. 1986. The Indian Neck Ossuary and Late Woodland Prehistory in Southern New England. In Chapters in the Archeology of Cape Cod, V: The Indian Neck Ossuary, edited by Francis P. McManamon, James W. Bradley, and Ann L. Magennis, pp. 3-47. Division of Cultural Resources, North Atlantic Regional Office, National Park Service, US Department of the Interior, Boston.
- Ekholm, Eric, and James Deetz. 1971. Wellfleet Tavern. Natural History 80(7):49-57.
- Gould, D. Rae. 2013a. The Nipmuc Nation, Federal Acknowledgment, and a Case of Mistaken Identity. In Recognition, Sovereignty Struggles, and Indigenous Rights in the United States: A Sourcebook, edited by Amy E. Den Ouden and Jean M. O'Brien, pp. 213-233. University of North Carolina Press, Chapel Hill.
- McManamon, Francis P. 1984a. Types of Archaeological Deposits and Lithic Assemblage Analysis. In Chapters in the Archaeology of Cape Cod, I: Results of the Cape Cod National Seashore Archeological Survey, 1979-1981, Vol. 2: Other Specific Studies and Synthesis, edited by Franics P. McManamon, pp. 1-41. Cultural Resources Management Study No. 8. Division of Cultural Resources, North Atlantic Regional Office, National Park Service, US Department of the Interior, Boston.
- McManamon, Francis P. 2011. Chapters in the Archaeology of Cape Cod, IV. Faunal Analysis and Metallurgical Analysis from the Cape Cod National Seashore Archaeological Survey. Cape Cod National Seashore, National Park Service, US Department of the Interior, Wellfleet, Massachusetts.
- Dunford, Fred, and Greg O'Brien. 1997. Secrets in the Sand: The Archaeology of Cape Cod. Parnassus Imprints, Hyannis, Massachusetts.
- Bradley, James W., Francis P. McManamon, Thomas F. Mahlstedt, and Ann L. Magennis. 1982. The Indian Neck Ossuary: A Preliminary Report. Bulletin of the Massachusetts Archaeological Society 43(2):47-59.
- Chilton, Elizabeth S., and Dianna L. Doucette. 2002. Archaeological Investigations at the Lucy Vincent Beach Site (19-DK-148): Preliminary Results and Interpretations. In A Lasting Impression: Coastal, Lithic, and Ceramic Research in New England Archaeology, edited by Jordan E. Kerber, pp. 41-69. Praeger, Westport, Connecticut.
- Johnson, Frederick. 1942. The Hemenway Site, M42/42, Eastham, Massachusetts. Bulletin of the Massachusetts Archaeological Society 3(3):27-30.
- Bradley, James W., Peter Stott, Claire Dempsey, Leonard Loparto, Michael Steinitz, and Thomas Mahlstedt. 1986. Historic and Archaeological Resources of Cape Cod and the Islands: A Framework for Preservation Decisions. Massachusetts Historical Commission, Boston.
- Gillis, Nichole, and Holly Herbster. 2013. Endangered Archaeological Sites Project Archaeological Reconnaissance and Intensive Survey: Great Island and Great Beach Hill, Cape Cod National Seashore. Report 2734. Submitted to the US National Park Service (Northeast Region). Copies available from the Public Archaeology Laboratory, Pawtucket, Rhode Island.
- Boudreau, Jeff. 2008. A New England Typology of Native American Projectile Points. Freedom Digital, Ashland, Massachusetts.
- Ceci, Lynn. 1990. Radiocarbon Dating "Village" Sites in Coastal New York: Settlement Pattern Change in the Middle to Late Woodland. Man in the Northeast 39:1-28.
- Ritchie, William A. 1969. The Archaeology of Martha's Vineyard: A Framework for the Prehistory of Southern New England. Natural History Press, Garden City, New Jersey.
Cited by
Starkova, H., Chiappini, L., & Mrozowski, S. A. (2025) · Academia Polonica. · doi:10.23856/7211
Self-citation
Metadata
- Authors
- Beranek, C. M., Mrozowski, S. A., Piechota, D. V., & Steinberg, J. M.
- Affiliations
- University of Massachusetts Boston (US)
- Corresponding author
- Beranek, Christa M.
- Venue
- American Antiquity
- Publisher
- Cambridge University Press (CUP)
- Published
- 2025-04
- Volume
- 90
- Issue
- 2
- Pages
- 307-327
- ISSN
- 0002-7316 (ISSN-L)
- 2325-5064
- OpenAlex
- W4409401153
- Cited by
- 2
- References
- 66
- Citations by year
- 2025: 2
- FWCI
- 2.08
- Type
- journal article
- Language
- en
- Open access
- hybrid
- doi.org
- Licence
- Locations
- American Antiquity (publishedVersion, cc-by-nc-sa)
- Funders
- U.S. Department of the Interior
- University of Massachusetts Boston
- National Park Service
- Topics
- Social Sciences › Archeology › Archaeology and ancient environmental studies
- Social Sciences › Anthropology › Indigenous Cultures and History
- Social Sciences › Anthropology › Historical and Cultural Archaeology Studies
- Keywords
- indigenous occupation, AMS radiocarbon dating, Great Island, Wellfleet, Cape Cod, Middle Woodland period, European contact, 16th century, early seventeenth century, site chronology
About these checks
Registry, retraction, Cites and statistics results are computed, not judged, with one exception: a printed reference that no index lists is read once by a model before it counts as a citation error. Claims are extracted by a model and kept only when their quote appears verbatim in the text; each cited source is then checked, with a model’s help, for whether it says what the claim relies on. Those verdicts can be wrong — read the claim’s quote and the cited source before relying on one.
A language model drew the claims from the paper on 2026-11-20, under version 3 of the claim definition (model deepseek-v4.1-flash, prompt extract-v3).
A second model labelled each claim on 2026-11-20 (model jev-1.13-20260917, definition revision gold-guideline-v0.2).
Statistics and arithmetic are recomputed, not judged.
Confidence bands are shown only for fields calibrated on our annotated test set. None is calibrated yet, so no band is shown.
What counts as a claim ›How we measure confidence ›How we check this ›
Are you an author, or do you see a problem with this page? Request a review
Data sources
Bibliographic data: Semantic Scholar, OpenAlex, Crossref.
Contains information from the Semantic Scholar Academic Graph Datasets, made available under the ODC Attribution License (ODC-BY 1.0).
Semantic Scholar’s data is described in: Kinney, R., et al. (2023). The Semantic Scholar Open Data Platform. arXiv:2301.10140.
