Student or educator? Sign up with your school email and get 6 months of Pro free.
Cited by 9Protein Structure and DynamicsEnzyme Structure and FunctionComputational Drug Discovery Methods

The DOI matches its Crossref record; 87 of the 87 references it cites were found in a registry or an index.

Mapping Protein Conformational Landscapes from Crystallographic Drug Fragment Screens

Open access
Saeed, Ammaar A., Klureza, Margaret A., Hekstra, Doeke R.·2024·Journal of Chemical Information and Modeling

Published version of a preprint

Abstract

Proteins are dynamic macromolecules. Knowledge of a protein's thermally accessible conformations is critical to determining important transitions and designing therapeutics. Accessible conformations are highly constrained by a protein's structure such that concerted structural changes due to external perturbations likely track intrinsic conformational transitions. These transitions can be thought of as paths through a conformational landscape. Crystallographic drug fragment screens are high-throughput perturbation experiments, in which thousands of crystals of a drug target are soaked with small-molecule drug precursors (fragments) and examined for fragment binding, mapping potential drug binding sites on the target protein. Here, we describe an open-source Python package, COnformational LAndscape Visualization (COLAV), to infer conformational landscapes from such large-scale crystallographic perturbation studies. We apply COLAV to drug fragment screens of two medically important systems: protein tyrosine phosphatase 1B (PTP1B), which regulates insulin signaling, and the SARS CoV-2 Main Protease (MPro). With enough fragment-bound structures, we find that such drug screens enable detailed mapping of proteins' conformational landscapes.

Overview

The claims and statistics of this paper haven’t been checked yet.

Run the check — free, no account needed. It reads the open-access text and checks the sources it cites.

A few free checks a day · papers already verified open instantly · results are public

Integrity signals

Registry

Crossref · 10.1021/acs.jcim.4c01380

Cites

87 of 87 references verified0 citation errors · 0 not checkable

Statistics

Figures

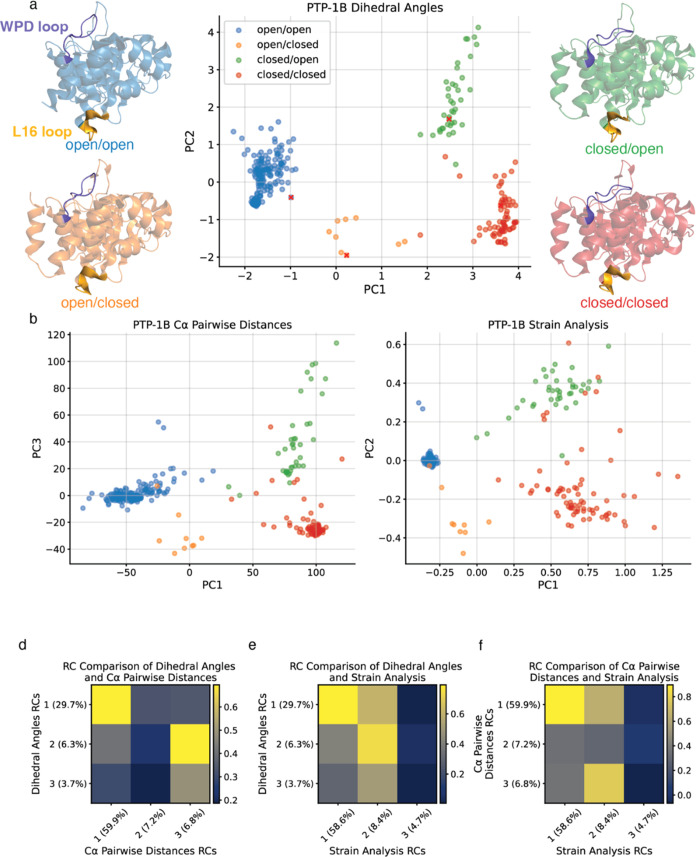
Figure 1 Conformational landscape of PTP1B inferred using three different structural representations and colored by conformation. (a) PTP1B conformational landscape by dihedral angles, flanked by representative PTP1B structures of the four major conformations labeled by the conformational state of the WPD loop (purple) and L16 loop (yellow): (open/open: 1NWL, open/closed: 4QBW, closed/open: 1PXH, closed/closed: 1SUG). (b) PTP1B conformational landscape by Cα pairwise distances; note that PC3 is shown on the y-axis. (c) PTP1B conformational landscape by strain analysis. (d–f) Correlation coefficient matrix comparing RCs 1–3 for (d) dihedral angles and Cα pairwise distances; (e) dihedral angles and strain; (f) Cα pairwise distances and strain.
Figure 1 Conformational landscape of PTP1B inferred using three different structural representations and colored by conformation. (a) PTP1B conformational landscape by dihedral angles, flanked by representative PTP1B structures of the four major conformations labeled by the conformational state of the WPD loop (purple) and L16 loop (yellow): (open/open: 1NWL, open/closed: 4QBW, closed/open: 1PXH, closed/closed: 1SUG). (b) PTP1B conformational landscape by Cα pairwise distances; note that PC3 is shown on the y-axis. (c) PTP1B conformational landscape by strain analysis. (d–f) Correlation coefficient matrix comparing RCs 1–3 for (d) dihedral angles and Cα pairwise distances; (e) dihedral angles and strain; (f) Cα pairwise distances and strain.CC BY-NC-ND · PubMed Central
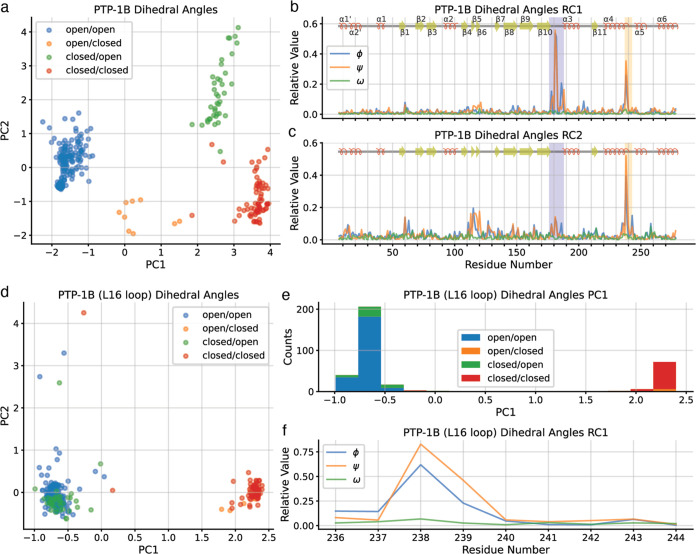
Figure 2 The dihedral angle representation distinguishes between conformations of PTP1B based on the conformations of the WPD loop and L16 loop. (a) PTP1B conformational landscape by dihedral angles by PC1 and PC2. (b) Residue contributions to principal component 1 (PC1), with WPD loop (residues 176–188) indicated by a purple box and L16 loop (residues 237–243) in a yellow box. (c) Residue contributions to PC2, with WPD loop in purple box and L16 loop in yellow box. (d) PTP1B L16 loop conformational landscape by dihedral angles colored by conformation. (e) Histogram of PTP1B structures according to PC1 of the focused PCA. (f) Residue contributions to PC1 of the focused PCA.
Figure 2 The dihedral angle representation distinguishes between conformations of PTP1B based on the conformations of the WPD loop and L16 loop. (a) PTP1B conformational landscape by dihedral angles by PC1 and PC2. (b) Residue contributions to principal component 1 (PC1), with WPD loop (residues 176–188) indicated by a purple box and L16 loop (residues 237–243) in a yellow box. (c) Residue contributions to PC2, with WPD loop in purple box and L16 loop in yellow box. (d) PTP1B L16 loop conformational landscape by dihedral angles colored by conformation. (e) Histogram of PTP1B structures according to PC1 of the focused PCA. (f) Residue contributions to PC1 of the focused PCA.CC BY-NC-ND · PubMed Central
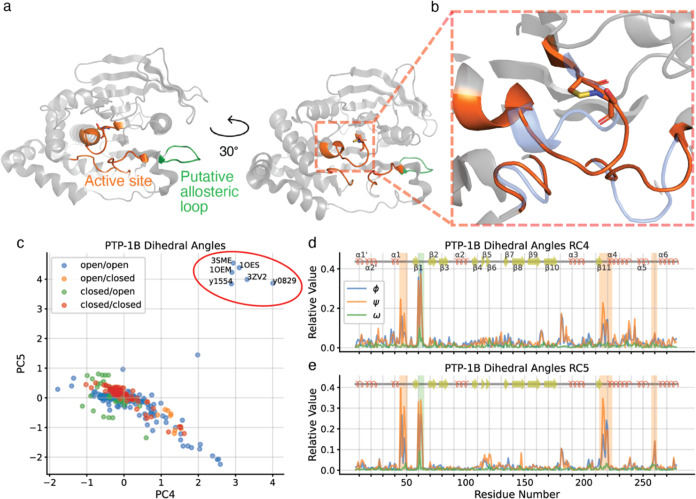
Figure 3 PTP1B conformational change due to oxidation states of Cys215. (a) Cartoon representations of oxidized PTP1B conformation (1OES), highlighting active site loops (orange) and putative allosteric loop (green). (b) Cartoon representation of the oxidized PTP1B active site conformation (1OES; orange), with sulphenyl-amide ring shown in sticks, and the reduced PTP1B active site conformation (1SUG; blue) for comparison. (c) PTP1B conformational landscape by dihedral angles by PC4 and PC5; structures showing oxidized PTP1B conformation as in panels (a) and (b) are circled in red. (d) Residue contributions to PC4, with active site loops in orange box and putative allosteric loop (residues 59–66) in green box (coloring matches panel (a)). (e) Residue contributions to PC5, with loop coloring as in panel (d).
Figure 3 PTP1B conformational change due to oxidation states of Cys215. (a) Cartoon representations of oxidized PTP1B conformation (1OES), highlighting active site loops (orange) and putative allosteric loop (green). (b) Cartoon representation of the oxidized PTP1B active site conformation (1OES; orange), with sulphenyl-amide ring shown in sticks, and the reduced PTP1B active site conformation (1SUG; blue) for comparison. (c) PTP1B conformational landscape by dihedral angles by PC4 and PC5; structures showing oxidized PTP1B conformation as in panels (a) and (b) are circled in red. (d) Residue contributions to PC4, with active site loops in orange box and putative allosteric loop (residues 59–66) in green box (coloring matches panel (a)). (e) Residue contributions to PC5, with loop coloring as in panel (d).CC BY-NC-ND · PubMed Central
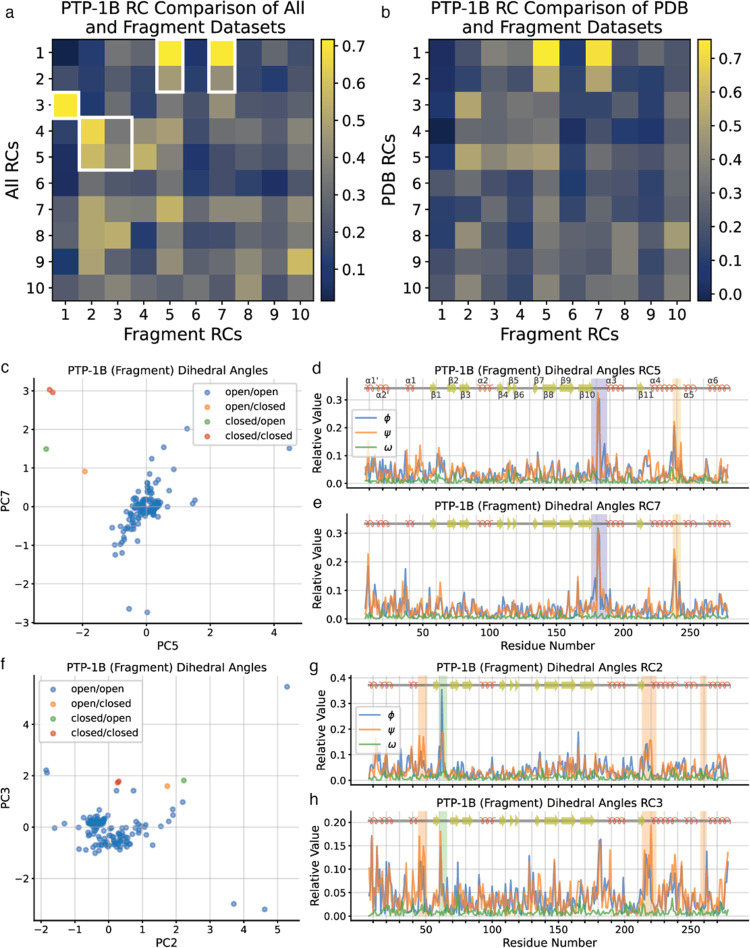
Figure 4 COLAV analysis recapitulates key dimensions of the PTP1B conformational landscape. (a, b) Correlation coefficient matrix comparing residue contributions (RCs) of (a) the complete PTP1B dataset to those of the fragment screen-only PTP1B dataset, and (b) the PDB-only PTP1B dataset to those of the fragment screen-only PTP1B dataset. Correlations discussed in the text are highlighted using white edges. (c) Fragment screen PTP1B conformational landscape by dihedral angles, emphasizing similarities of PC5 and PC7 with PC1 and PC2 of the complete PTP1B conformational landscape. (d) Residue contributions to PC5, with WPD loop in purple box and L16 loop in yellow box. (e) Residue contributions to PC7, with coloring as in panel (d). (f) Fragment screen PTP1B conformational landscape by dihedral angles, emphasizing similarities of PC2 and PC4 with PC4 and PC5 of the complete PTP1B conformational landscape. (g, h) Residue contributions to (g) PC2 and (h) PC4, with active site loops in orange box and putative allosteric loop in dark blue box.
Figure 4 COLAV analysis recapitulates key dimensions of the PTP1B conformational landscape. (a, b) Correlation coefficient matrix comparing residue contributions (RCs) of (a) the complete PTP1B dataset to those of the fragment screen-only PTP1B dataset, and (b) the PDB-only PTP1B dataset to those of the fragment screen-only PTP1B dataset. Correlations discussed in the text are highlighted using white edges. (c) Fragment screen PTP1B conformational landscape by dihedral angles, emphasizing similarities of PC5 and PC7 with PC1 and PC2 of the complete PTP1B conformational landscape. (d) Residue contributions to PC5, with WPD loop in purple box and L16 loop in yellow box. (e) Residue contributions to PC7, with coloring as in panel (d). (f) Fragment screen PTP1B conformational landscape by dihedral angles, emphasizing similarities of PC2 and PC4 with PC4 and PC5 of the complete PTP1B conformational landscape. (g, h) Residue contributions to (g) PC2 and (h) PC4, with active site loops in orange box and putative allosteric loop in dark blue box.CC BY-NC-ND · PubMed Central
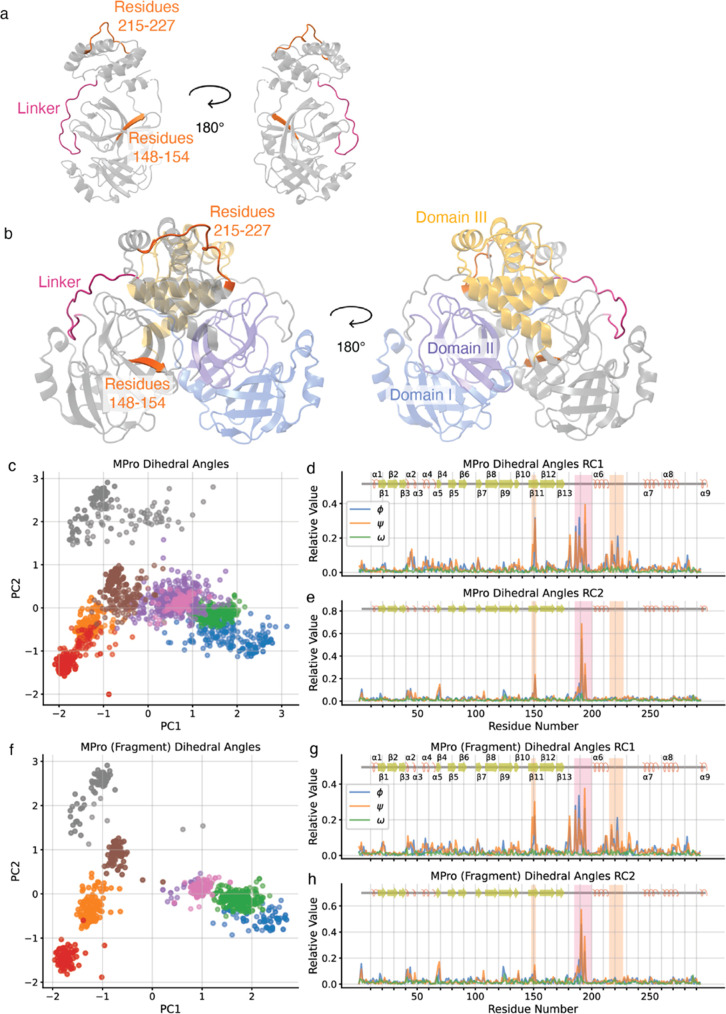
Figure 5 The MPro complete dataset and fragment-screen-only dataset generate similar conformational landscapes (a) Cartoon representations of single MPro protomer (7AR5), highlighting linker (residues 185–200) in magenta and putative allosteric regions (residues 148–152 and 215–227) in orange. (b) Cartoon representations of MPro homodimer (7AR5), highlighting subdomain I in blue, subdomain II in purple, and subdomain III in yellow on protomer 1 and linker and putative allosteric regions colored as in (a). (c) MPro conformational landscape by dihedral angles. (d) Residue contributions to PC1, with linker in magenta box and putative allosteric loops in orange box (coloring matches panels (a) and (b)). (e) Residue contributions to PC2, with loop coloring as in panel (d). (f) Fragment screen MPro conformational landscape by dihedral angles. (g, h) Residue contributions to fragment screen (g) PC1 and (h) PC2, with loop coloring as in panel (d).
Figure 5 The MPro complete dataset and fragment-screen-only dataset generate similar conformational landscapes (a) Cartoon representations of single MPro protomer (7AR5), highlighting linker (residues 185–200) in magenta and putative allosteric regions (residues 148–152 and 215–227) in orange. (b) Cartoon representations of MPro homodimer (7AR5), highlighting subdomain I in blue, subdomain II in purple, and subdomain III in yellow on protomer 1 and linker and putative allosteric regions colored as in (a). (c) MPro conformational landscape by dihedral angles. (d) Residue contributions to PC1, with linker in magenta box and putative allosteric loops in orange box (coloring matches panels (a) and (b)). (e) Residue contributions to PC2, with loop coloring as in panel (d). (f) Fragment screen MPro conformational landscape by dihedral angles. (g, h) Residue contributions to fragment screen (g) PC1 and (h) PC2, with loop coloring as in panel (d).CC BY-NC-ND · PubMed Central
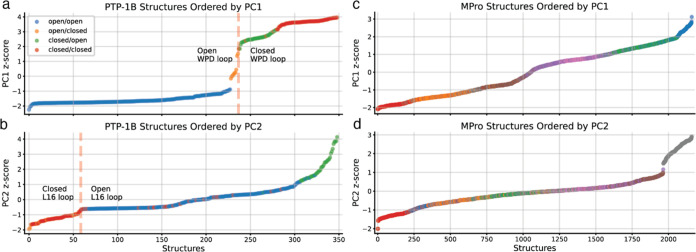
Figure 6 Ordering structures of PTP1B and MPro by PC scores marks distinct conformational transitions. (a) PTP1B structures ordered by dihedral angle score along PC1, with the transition from open WPD loop to closed WPD loop highlighted. (b) PTP1B structures ordered by dihedral angle score along PC2, with the transition from closed L16 loop to open L16 loop highlighted. (c) MPro structures ordered by dihedral angle score along PC1. (d) MPro structures ordered by dihedral angle score along PC2. Coloring of datasets for both proteins matches preceding figures.
Figure 6 Ordering structures of PTP1B and MPro by PC scores marks distinct conformational transitions. (a) PTP1B structures ordered by dihedral angle score along PC1, with the transition from open WPD loop to closed WPD loop highlighted. (b) PTP1B structures ordered by dihedral angle score along PC2, with the transition from closed L16 loop to open L16 loop highlighted. (c) MPro structures ordered by dihedral angle score along PC1. (d) MPro structures ordered by dihedral angle score along PC2. Coloring of datasets for both proteins matches preceding figures.CC BY-NC-ND · PubMed Central

Verification

Claims the paper makes

The claims and statistics of this paper haven’t been checked yet.

Run the check — free, no account needed. It reads the open-access text and checks the sources it cites.

A few free checks a day · papers already verified open instantly · results are public

Self-check

Percentages, sums and reported differences re-computed from the paper’s own numbers.

The self-check needs the paper’s full text.

Citations

Cites

Show all 87 references

Research works printed but not linked: 4

  1. Greisman, J. B.; Dalton, K. M.; Brookner, D. B.; Klureza, M. A.; Sheehan, C. J.; Kim, I.S.; Henning, R. W.; Russi, S.; Hekstra, D. R. Resolving conformational changes that mediate a two-step catalytic mechanism in a model enzyme. Proc natl Acad Sci USA , 2023, 121 (9): e231392121, 10.1073/pnas.231319212. · DOI
  2. Pedregosa F., 2011, J. Mach. Learn. Res., 12, 2825
  3. Van der Maaten L., 2008, J. Mach. Learn. Res., 9, 2579
  4. 10.1210/mend.15.10.0711 · DOI

Metadata

Authors
Saeed, A. A., Klureza, M. A., & Hekstra, D. R.
Affiliations
Harvard University (US)
Corresponding author
Hekstra, Doeke R.
Venue
Journal of Chemical Information and Modeling
Published
2024-11-12
Volume
64
Issue
23
Pages
8937-8951
ISSN
  • 1549-9596 (ISSN-L)
  • 1549-960X
OpenAlex
W4404283512
Cited by
9
References
87
Citations by year
2026: 5 · 2025: 4
FWCI
1.23
Type
journal article
Language
en
Open access
Locations
  • Journal of Chemical Information and Modeling (publishedVersion, cc-by-nc-nd)
  • bioRxiv (Cold Spring Harbor Laboratory) (acceptedVersion, cc-by-nc)
  • Europe PMC (PubMed Central) (publishedVersion, cc-by-nc-nd)
  • PubMed (publishedVersion)
  • PubMed Central (publishedVersion, cc-by-nc-nd)
  • PubMed Central (submittedVersion, cc-by-nc)
Funders
  • NIH Office of the Director (DP2-GM141000)
  • Harvard University
Topics
  • Life Sciences › Biochemistry, Genetics and Molecular Biology › Molecular Biology › Protein Structure and Dynamics
  • Life Sciences › Biochemistry, Genetics and Molecular Biology › Structural Biology › Enzyme Structure and Function
  • Life Sciences › Pharmacology, Toxicology and Pharmaceutics › Drug Discovery › Computational Drug Discovery Methods
Keywords
protein conformational landscape, protein dynamics, PTP1B, main protease, fragment binding, conformational change

About these checks

Registry, retraction, Cites and statistics results are computed, not judged, with one exception: a printed reference that no index lists is read once by a model before it counts as a citation error. Claims are extracted by a model and kept only when their quote appears verbatim in the text; each cited source is then checked, with a model’s help, for whether it says what the claim relies on. Those verdicts can be wrong — read the claim’s quote and the cited source before relying on one.

Statistics and arithmetic are recomputed, not judged.

Confidence bands are shown only for fields calibrated on our annotated test set. None is calibrated yet, so no band is shown.

What counts as a claim ›How we measure confidence ›How we check this ›

Are you an author, or do you see a problem with this page? Request a review

How to cite

Cite CoChat for the checks on this page, and the paper for its own findings.

This page
CoChat. (2026). Citation check: Mapping Protein Conformational Landscapes from Crystallographic Drug Fragment Screens. https://app.cochat.ai/papers/10.1021/acs.jcim.4c01380
The paper
Saeed, A. A., Klureza, M. A., & Hekstra, D. R. (2024). Mapping Protein Conformational Landscapes from Crystallographic Drug Fragment Screens. Journal of Chemical Information and Modeling. https://doi.org/10.1021/acs.jcim.4c01380

Data sources

Bibliographic data: Semantic Scholar, OpenAlex, Crossref.

Contains information from the Semantic Scholar Academic Graph Datasets, made available under the ODC Attribution License (ODC-BY 1.0).

Semantic Scholar’s data is described in: Kinney, R., et al. (2023). The Semantic Scholar Open Data Platform. arXiv:2301.10140.