Cited by 24

The DOI matches its Crossref record; 1 of the 1 references it cites were found in a registry or an index.

Targeted Delivery of Nanoparticle-Conveyed Neutrophils to the Glioblastoma Site for Efficient Therapy

Piao, Chunxian, Lee, Jaeho, Kim, Gi Eun, Choe, Young Ho, Lee, Haerang, Hyun, Young-Min·2024·ACS Applied Materials & Interfaces

Overview

The claims and statistics of this paper haven’t been checked yet.

Run the check — free, no account needed. It reads the open-access text and checks the sources it cites.

A few free checks a day · papers already verified open instantly · results are public

Integrity signals

Registry

Crossref · 10.1021/acsami.4c05691

Cites

1 of 1 references verified0 citation errors · 0 not checkable

Statistics

Figures

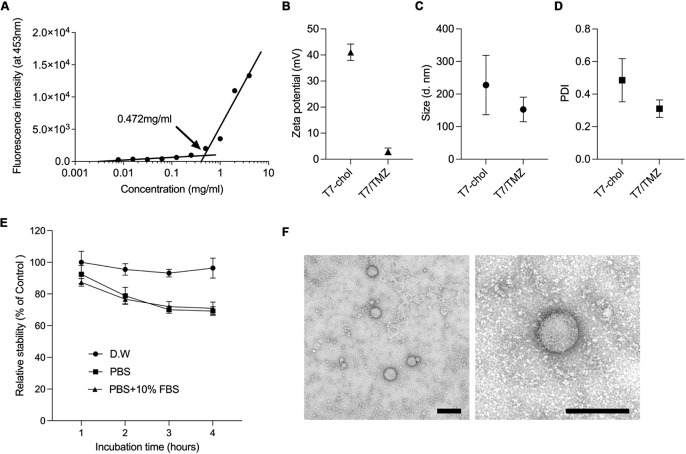
Figure 1 Physical characterization of T7-chol and T7/TMZ. (A) CMC of the T7-chol micelles was determined by DPH assay. (B) Zeta potential and (C) particle size with its (D) polydispersity index (PDI) of both T7-chol and T7/TMZ were analyzed using dynamic light scattering at a concentration of 0.5 mg/mL. Data are expressed as the mean ± standard deviation of sextuplicate experiments. (E) Stability of T7/TMZ nanoparticles in different solutions. The T7/TMZ nanoparticles were incubated with distilled water (D.W), PBS, and PBS with 10% FBS at 37 °C for 4 h. Stability was measured by absorbance at 330 nm. The data are expressed as the mean ± standard deviation from quadruplicate experiments. (F) TEM images exhibit the T7/TMZ nanoparticles were observed by different magnifications. Scale bars indicated 200 nm.
Figure 1 Physical characterization of T7-chol and T7/TMZ. (A) CMC of the T7-chol micelles was determined by DPH assay. (B) Zeta potential and (C) particle size with its (D) polydispersity index (PDI) of both T7-chol and T7/TMZ were analyzed using dynamic light scattering at a concentration of 0.5 mg/mL. Data are expressed as the mean ± standard deviation of sextuplicate experiments. (E) Stability of T7/TMZ nanoparticles in different solutions. The T7/TMZ nanoparticles were incubated with distilled water (D.W), PBS, and PBS with 10% FBS at 37 °C for 4 h. Stability was measured by absorbance at 330 nm. The data are expressed as the mean ± standard deviation from quadruplicate experiments. (F) TEM images exhibit the T7/TMZ nanoparticles were observed by different magnifications. Scale bars indicated 200 nm.CC BY-NC-ND · PubMed Central
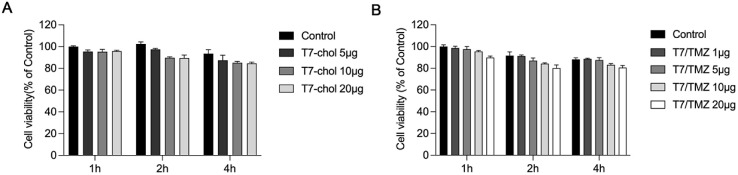
Figure 2 Cytotoxicity of T7-chol and T7/TMZ on PMNs. The cytotoxic effects of (A) T7-chol and (B) T7/TMZ on PMNs at various doses and time conditions. As a control condition, an equivalent volume of PBS was administered. Data are expressed as the mean ± standard deviation of sextuplicate experiments.
Figure 2 Cytotoxicity of T7-chol and T7/TMZ on PMNs. The cytotoxic effects of (A) T7-chol and (B) T7/TMZ on PMNs at various doses and time conditions. As a control condition, an equivalent volume of PBS was administered. Data are expressed as the mean ± standard deviation of sextuplicate experiments.CC BY-NC-ND · PubMed Central
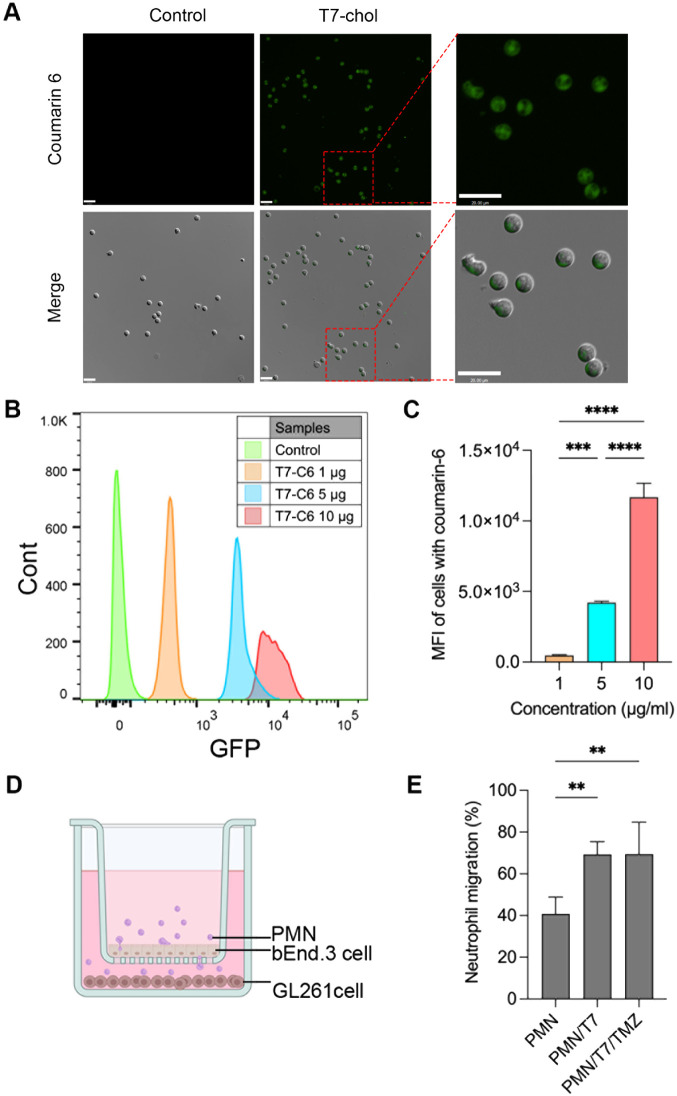
Figure 3 Cellular uptake and migration of PMNs. (A) Coumarin 6-loaded T7-chol micelles were prepared under optimal conditions and administered to PMNs. After 2 h, cellular uptake was visualized using Ti2 fluorescence microscopy and right panels show magnified views of the boxed areas. Scale bars indicated 20 μm. (B) Coumarin 6-loaded T7-chol micelles were administered to PMNs at various doses (1, 5, and 10 μg). After 2 h, the percentage of GFP-positive cells was quantified using flow cytometry. (C) Quantitative demonstration of the effect of T7-C6 on neutrophil cellular uptake was performed using flow cytometry. Data are presented as the mean ± standard deviation of triplicate experiments. The data are expressed as the mean ± standard deviation of triple experiments. ***p < 0.005, ****p < 0.0001. (D) Schematic of the in vitro BBB model transwell system was utilized to assess the migration of PMNs from PMN alone, PMN/T7, and PMN/T7/TMZ across the bEnd.3 cell (upper compartment) monolayer to GL261 cells (lower compartment). (E) Quantification of PMN migration to the basolateral was conducted using fluorescence microscopy. Data are expressed as the mean ± standard deviation of quintuplicates experiments. **p < 0.001.
Figure 3 Cellular uptake and migration of PMNs. (A) Coumarin 6-loaded T7-chol micelles were prepared under optimal conditions and administered to PMNs. After 2 h, cellular uptake was visualized using Ti2 fluorescence microscopy and right panels show magnified views of the boxed areas. Scale bars indicated 20 μm. (B) Coumarin 6-loaded T7-chol micelles were administered to PMNs at various doses (1, 5, and 10 μg). After 2 h, the percentage of GFP-positive cells was quantified using flow cytometry. (C) Quantitative demonstration of the effect of T7-C6 on neutrophil cellular uptake was performed using flow cytometry. Data are presented as the mean ± standard deviation of triplicate experiments. The data are expressed as the mean ± standard deviation of triple experiments. ***p < 0.005, ****p < 0.0001. (D) Schematic of the in vitro BBB model transwell system was utilized to assess the migration of PMNs from PMN alone, PMN/T7, and PMN/T7/TMZ across the bEnd.3 cell (upper compartment) monolayer to GL261 cells (lower compartment). (E) Quantification of PMN migration to the basolateral was conducted using fluorescence microscopy. Data are expressed as the mean ± standard deviation of quintuplicates experiments. **p < 0.001.CC BY-NC-ND · PubMed Central
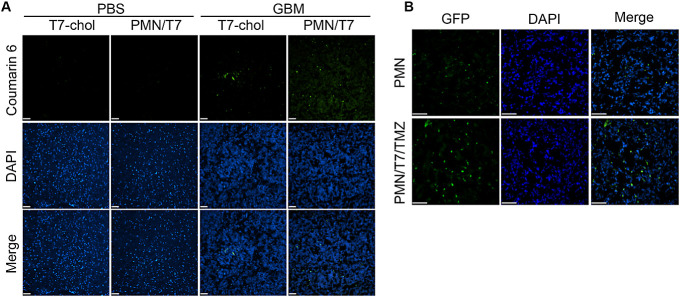
Figure 4 Brain delivery efficiency following intravenous administration. (A) Coumarin 6 was intravenously administered to mice injected with PBS into the brain and GBM mice, using T7-chol and PMN/T7. Brains were harvested 4 h postinjection and sectioned into 10-μm-thick slices. GFP signals were visualized using fluorescence microscopy, with nuclei counter stained with DAPI. (B) PMNs from LysM-GFP mice were delivered to GBM mouse models. PMN alone and PMN/T7/TMZ were administered intravenously. Brains were harvested 20 h postinjection and sectioned into 10-μm-thick slices. Fluorescence images depicted PMNs (green) and nuclei (blue). Scale bars indicate 50 μm. A representative data was shown from at least three times independent experiments.
Figure 4 Brain delivery efficiency following intravenous administration. (A) Coumarin 6 was intravenously administered to mice injected with PBS into the brain and GBM mice, using T7-chol and PMN/T7. Brains were harvested 4 h postinjection and sectioned into 10-μm-thick slices. GFP signals were visualized using fluorescence microscopy, with nuclei counter stained with DAPI. (B) PMNs from LysM-GFP mice were delivered to GBM mouse models. PMN alone and PMN/T7/TMZ were administered intravenously. Brains were harvested 20 h postinjection and sectioned into 10-μm-thick slices. Fluorescence images depicted PMNs (green) and nuclei (blue). Scale bars indicate 50 μm. A representative data was shown from at least three times independent experiments.CC BY-NC-ND · PubMed Central
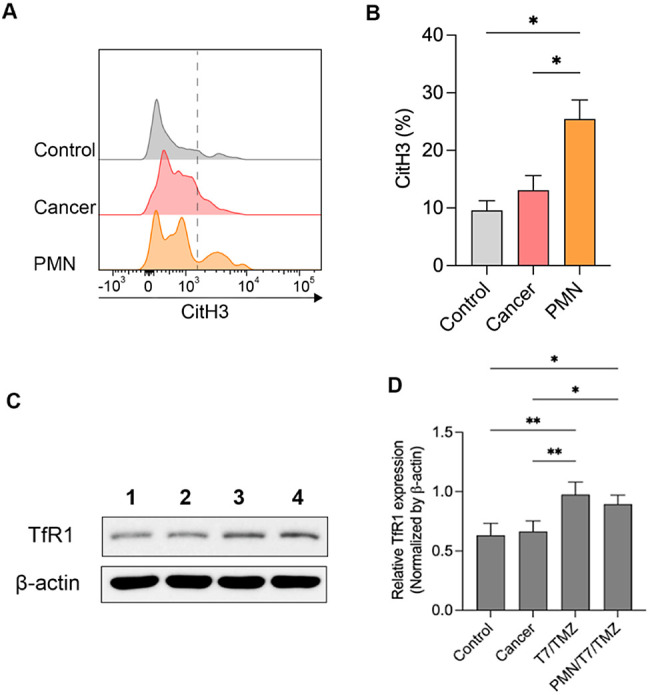
Figure 5 Brain tumor environment enhances the NET formation in intravenously administered PMNs. (A) Representative histograms and (B) relative percentages of CitH3 within the brain tumor region, gated on CD11b+ and Ly6G+ cells. Data are acquired more than triplicates reiteration and expressed as the mean ± standard deviation. *p < 0.05. T7 peptide in targeting transferrin receptors in tumor. (C) Immunoblotting for TfR1. The control group consisted of WT mice (1), while GBM models injected with PBS represented the cancer group (2). Intravenous administration of T7/TMZ (3) and PMN/T7/TMZ (4) was performed on the GBM model. After 20 h, the brains were harvested and analyzed by Western blot of TfR1 (D). For quantification, the target expressions were normalized using β-actin. Data are expressed as the mean ± standard deviation of quadruplicates experiments. *p < 0.05, **p < 0.001.
Figure 5 Brain tumor environment enhances the NET formation in intravenously administered PMNs. (A) Representative histograms and (B) relative percentages of CitH3 within the brain tumor region, gated on CD11b+ and Ly6G+ cells. Data are acquired more than triplicates reiteration and expressed as the mean ± standard deviation. *p < 0.05. T7 peptide in targeting transferrin receptors in tumor. (C) Immunoblotting for TfR1. The control group consisted of WT mice (1), while GBM models injected with PBS represented the cancer group (2). Intravenous administration of T7/TMZ (3) and PMN/T7/TMZ (4) was performed on the GBM model. After 20 h, the brains were harvested and analyzed by Western blot of TfR1 (D). For quantification, the target expressions were normalized using β-actin. Data are expressed as the mean ± standard deviation of quadruplicates experiments. *p < 0.05, **p < 0.001.CC BY-NC-ND · PubMed Central
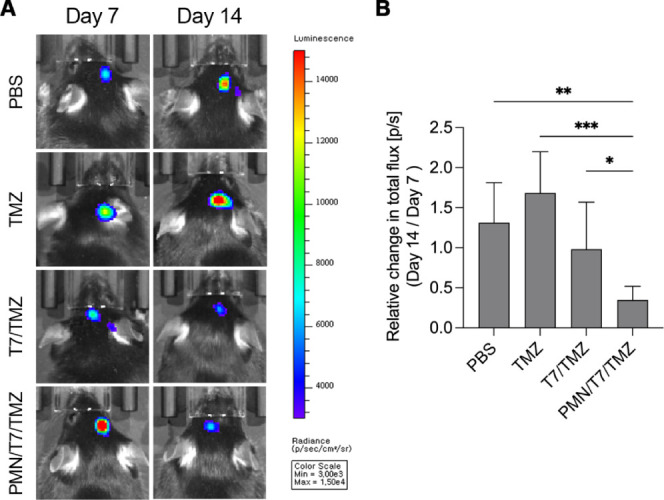
Figure 6 Therapeutic efficiency. (A) In vivo bioluminescence imaging of mice intracranially implanted with luciferase-expressing Gl261-luc cells and treated with PBS (control), TMZ, T7/TMZ, and PMN/T7/TMZ. Intravenous injections were administered for 2 days starting on day 7 post-tumor implantation, followed by IVIS imaging on days 7 and 14. (B) Quantification of the relative change in total flux (photons/second) from day 7 to day 14 for the different treatment groups. Data are presented as mean ± standard deviation of sextuplicates experiments. Statistical significance is indicated as *p < 0.05, **p < 0.01, and ***p < 0.001.
Figure 6 Therapeutic efficiency. (A) In vivo bioluminescence imaging of mice intracranially implanted with luciferase-expressing Gl261-luc cells and treated with PBS (control), TMZ, T7/TMZ, and PMN/T7/TMZ. Intravenous injections were administered for 2 days starting on day 7 post-tumor implantation, followed by IVIS imaging on days 7 and 14. (B) Quantification of the relative change in total flux (photons/second) from day 7 to day 14 for the different treatment groups. Data are presented as mean ± standard deviation of sextuplicates experiments. Statistical significance is indicated as *p < 0.05, **p < 0.01, and ***p < 0.001.CC BY-NC-ND · PubMed Central

Verification

Claims the paper makes

The claims and statistics of this paper haven’t been checked yet.

Run the check — free, no account needed. It reads the open-access text and checks the sources it cites.

A few free checks a day · papers already verified open instantly · results are public

Claims other papers make about this one

Each is checked against this paper’s own text: does it say what the citing paper says it does?

Self-check

Percentages, sums and reported differences re-computed from the paper’s own numbers.

The self-check needs the paper’s full text.

Citations

Cites

Show all 1 references

Research works printed but not linked: 37

  1. 10.1259/bjr/83796755 · DOI
  2. 10.3390/molecules29040840 · DOI
  3. 10.1001/jama.2013.280319 · DOI
  4. 10.3349/ymj.2022.0430 · DOI
  5. 10.3349/ymj.2022.0352 · DOI
  6. 10.1021/acs.molpharmaceut.3c00162 · DOI
  7. 10.1016/j.ijpharm.2023.123069 · DOI
  8. 10.1016/j.addr.2022.114394 · DOI
  9. 10.1038/nnano.2017.54 · DOI
  10. 10.1038/s41467-023-37872-4 · DOI
  11. Hannoodee S., 2024, Acute Inflammatory Response
  12. 10.4161/15384101.2014.950163 · DOI
  13. 10.1007/978-1-62703-845-4_1 · DOI
  14. 10.1002/adma.201706245 · DOI · Paper page
  15. 10.3389/fonc.2019.01146 · DOI
  16. 10.7150/thno.18069 · DOI
  17. 10.1080/10717544.2018.1494223 · DOI
  18. 10.1021/acsomega.3c07486 · DOI
  19. 10.1016/j.jare.2023.01.005 · DOI
  20. 10.1049/nbt2.12018 · DOI · Paper page
  21. 10.3390/pharmaceutics14020254 · DOI
  22. 10.1039/D2BM00756H · DOI
  23. 10.3390/biomedicines10010001 · DOI
  24. 10.1016/j.neuroscience.2022.03.030 · DOI
  25. 10.1016/j.jconrel.2022.08.024 · DOI
  26. 10.3349/ymj.2021.62.9.843 · DOI
  27. 10.3390/cells8121477 · DOI
  28. 10.1080/1061186X.2016.1212202 · DOI
  29. 10.1182/blood.V96.2.719 · DOI
  30. 10.1007/s00418-008-0530-8 · DOI
  31. 10.3389/fmed.2023.1083242 · DOI
  32. 10.1038/s41565-018-0254-4 · DOI
  33. 10.3390/ph16111564 · DOI
  34. 10.1016/j.chemphyslip.2016.05.003 · DOI · Paper page
  35. 10.1371/journal.pone.0128144 · DOI
  36. 10.1080/10717544.2022.2046892 · DOI
  37. 10.1073/pnas.0605722103 · DOI

Cited by

Sorted by citations

Metadata

Authors
Piao, C., Lee, J., Kim, G. E., Choe, Y. H., Lee, H., & Hyun, Y.-M.
Venue
ACS Applied Materials & Interfaces
Published
2024-07-26
Volume
16
Issue
32
Pages
41819-41827
ISSN
  • 1944-8244
  • 1944-8252
Cited by
24
References
1
Language
en
Funders
  • Ministry of Science and ICT, South Korea (2022R1A2B5B02002506, RS-2023-00207834)
  • Yonsei University College of Medicine (6-2023-0081)

About these checks

Registry, retraction, Cites and statistics results are computed, not judged, with one exception: a printed reference that no index lists is read once by a model before it counts as a citation error. Claims are extracted by a model and kept only when their quote appears verbatim in the text; each cited source is then checked, with a model’s help, for whether it says what the claim relies on. Those verdicts can be wrong — read the claim’s quote and the cited source before relying on one.

Statistics and arithmetic are recomputed, not judged.

Confidence bands are shown only for fields calibrated on our annotated test set. None is calibrated yet, so no band is shown.

What counts as a claim ›How we measure confidence ›How we check this ›

Are you an author, or do you see a problem with this page? Request a review