

Modeling a Dynamic Printability Window on Polysaccharide Blend Inks for Extrusion Bioprinting
Open accessThe DOI matches its Crossref record; 47 of the 47 references it cites were found in a registry or an index.
Abstract
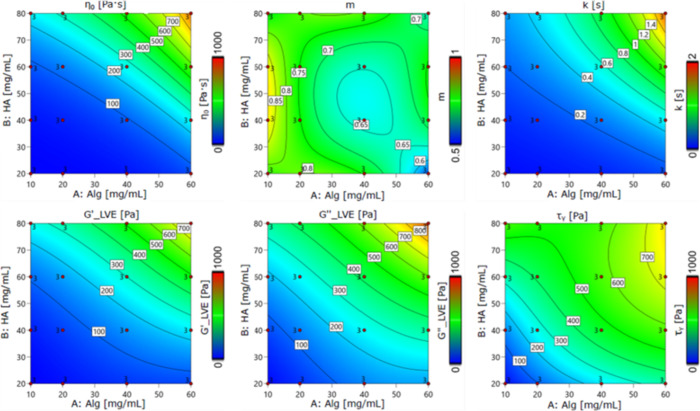
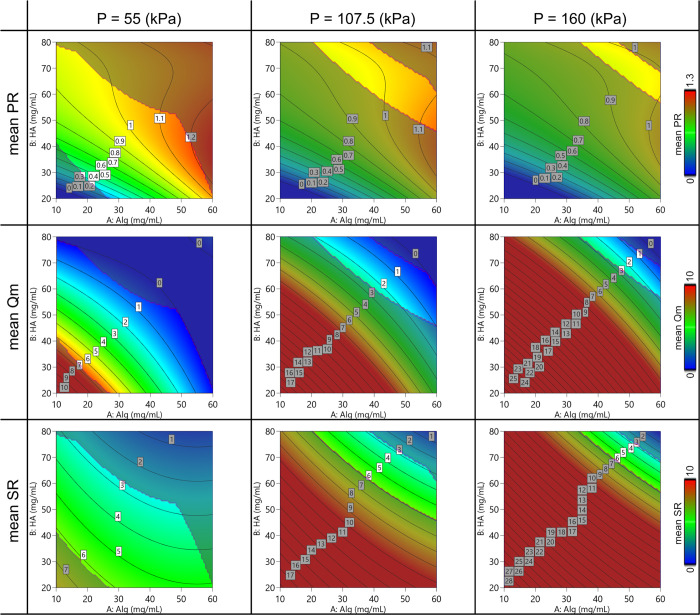
Extrusion-based bioprinting is one of the most widespread technologies due to its affordability, wide range of processable materials, and ease of use. However, the formulation of new inks for this technique is based on time-consuming trial-and-error processes to establish the optimal ink composition and printing parameters. Here, a dynamic printability window was modeled for the assessment of the printability of polysaccharide blend inks of alginate and hyaluronic acid with the intent to build a versatile predictive tool to speed up the testing procedures. The model considers both the rheological properties of the blends (viscosity, shear thinning behavior, and viscoelasticity) and their printability (in terms of extrudability and the ability of forming a well-defined filament and detailed geometries). By imposing some conditions on the model equations, it was possible to define empirical bands in which the printability is ensured. The predictive capability of the built model was successfully verified on an untested blend of alginate and hyaluronic acid chosen to simultaneously optimize the printability index and minimize the size of the deposited filament.
Overview
The claims and statistics of this paper haven’t been checked yet.
Free: it reads the open-access text and checks the first 5 claims that cite a source we can check. Create a free account to check every claim.
Integrity signals
Registry
Cites
Statistics
Figures



Verification
Claims the paper makes
The claims and statistics of this paper haven’t been checked yet.
Free: it reads the open-access text and checks the first 5 claims that cite a source we can check. Create a free account to check every claim.
Claims other papers make about this one
Each is checked against this paper’s own text: does it say what the citing paper says it does?
The cited source says what the claim attributes to it.
In the citing paper
“However, the successful fabrication of stable 3D constructs relies on hydrogels with optimized rheological behavior, structural stability, and physicochemical properties that ensure printability and shape fidelity [7,8,9].”
The check wasn’t confident either way, so it gives no verdict — never disputed.
In the citing paper
“Although the spreading ratio (Figure 6D) tended to decrease with increasing MMT concentration, no statistically significant differences were observed among the formulations (one-way ANOVA, p = 0.117) [6,7].”
From Montmorillonite-reinforced methacrylated collagen/methacrylated silk fibroin hydrogel-based inks: rheological and physicochemical characterization for bone scaffold applications (2026) · cites this paper as [7]
Experimental — accuracy not yet measured
Self-check
Percentages, sums and reported differences re-computed from the paper’s own numbers.
The self-check needs the paper’s full text.
Citations
Cites
3D bioprinting of tissues and organs
Murphy, S. V., & Atala, A. (2014) · Nature Biotechnology · doi:10.1038/nbt.2958 · Cited by 7,034
Current advances and future perspectives in extrusion-based bioprinting
Ozbolat, I. T., & Hospodiuk, M. (2016) · Biomaterials · doi:10.1016/j.biomaterials.2015.10.076 · Cited by 1,572
Printability and shape fidelity of bioinks in 3D bioprinting
Schwab, A., Levato, R., D’Este, M., Piluso, S., Eglin, D., & Malda, J. (2020) · Chemical Reviews · doi:10.1021/acs.chemrev.0c00084 · Cited by 1,359
Ouyang, L., Yao, R., Zhao, Y., & Sun, W. (2016) · Biofabrication · doi:10.1088/1758-5090/8/3/035020 · Cited by 1,045
Paxton, N., Smolan, W., Böck, T., Melchels, F., Groll, J., & Jungst, T. (2017) · Biofabrication · doi:10.1088/1758-5090/aa8dd8 · Cited by 950
Recent trends in bioinks for 3D printing
Gopinathan, J., & Noh, I. (2018) · Biomaterials Research · doi:10.1186/s40824-018-0122-1 · Cited by 846
A definition of bioinks and their distinction from biomaterial inks
Groll, J., Burdick, J. A., Cho, D.-W., Derby, B., Gelinsky, M., Heilshorn, S. C., Jüngst, T., Malda, J., Mironov, V. A., Nakayama, K., et al. (2018) · Biofabrication · doi:10.1088/1758-5090/aaec52 · Cited by 797
Research on the printability of hydrogels in 3D bioprinting
He, Y., Yang, F., Zhao, H., Gao, Q., Xia, B., & Fu, J. (2016) · Scientific Reports · doi:10.1038/srep29977 · Cited by 654
Bio-ink properties and printability for extrusion printing living cells
Chung, J. H. Y., Naficy, S., Yue, Z., Kapsa, R., Quigley, A., Moulton, S. E., & Wallace, G. G. (2013) · Biomaterials Science · doi:10.1039/c3bm00012e · Cited by 610
Shear-thinning and self-healing hydrogels as injectable therapeutics and for 3D-printing
Loebel, C., Rodell, C. B., Chen, M. H., & Burdick, J. A. (2017) · Nature Protocols · doi:10.1038/nprot.2017.053 · Cited by 565
Gao, T., Gillispie, G. J., Copus, J. S., PR, A. K., Seol, Y.-J., Atala, A., Yoo, J. J., & Lee, S. J. (2018) · Biofabrication · doi:10.1088/1758-5090/aacdc7 · Cited by 510
‘Printability' of Candidate Biomaterials for Extrusion Based 3D Printing: State‐of‐the‐Art
Kyle, S., Jessop, Z. M., Al‐Sabah, A., & Whitaker, I. S. (2017) · Advanced Healthcare Materials · doi:10.1002/adhm.201700264 · Cited by 495
Assessing bioink shape fidelity to aid material development in 3D bioprinting
Ribeiro, A., Blokzijl, M. M., Levato, R., Visser, C. W., Castilho, M., Hennink, W. E., Vermonden, T., & Malda, J. (2017) · Biofabrication · doi:10.1088/1758-5090/aa90e2 · Cited by 448
A comparison of different bioinks for 3D bioprinting of fibrocartilage and hyaline cartilage
Daly, A. C., Critchley, S. E., Rencsok, E. M., & Kelly, D. J. (2016) · Biofabrication · doi:10.1088/1758-5090/8/4/045002 · Cited by 436
On different ways of measuring “the” yield stress
Dinkgreve, M., Paredes, J., Denn, M. M., & Bonn, D. (2016) · Journal of Non-Newtonian Fluid Mechanics · doi:10.1016/j.jnnfm.2016.11.001 · Cited by 423
Freeman, F. E., & Kelly, D. J. (2017) · Scientific Reports · doi:10.1038/s41598-017-17286-1 · Cited by 362
Extrusion bioprinting: Recent progress, challenges, and future opportunities
Ramesh, S., Harrysson, O. L. A., Rao, P. K., Tamayol, A., Cormier, D. R., Zhang, Y., & Rivero, I. V. (2021) · Bioprinting · doi:10.1016/j.bprint.2020.e00116 · Cited by 243
Advancing bioinks for 3D bioprinting using reactive fillers: a review
Heid, S., & Boccaccini, A. R. (2020) · Acta Biomaterialia · doi:10.1016/j.actbio.2020.06.040 · Cited by 224
Evaluation of bioprinter technologies
Ozbolat, I. T., Moncal, K. K., & Gudapati, H. (2017) · Additive Manufacturing · doi:10.1016/j.addma.2016.10.003 · Cited by 202
Bioprinting 101: Design, Fabrication, and Evaluation of Cell-Laden 3D Bioprinted Scaffolds
Deo, K. A., Singh, K. A., Peak, C. W., Alge, D. L., & Gaharwar, A. K. (2020) · Tissue Engineering Part A · doi:10.1089/ten.tea.2019.0298 · Cited by 199
The arrival of commercial bioprinters – Towards 3D bioprinting revolution!
Choudhury, D., Anand, S., & Naing, M. W. (2024) · International Journal of Bioprinting · doi:10.18063/ijb.v4i2.139 · Cited by 189 · cited 1×
“1,3,4 The major advantages of extrusion-based bioprinting (EBB) are the wide printing window in terms of viscosity (10 1 − 10 13 Pa · s 1 ), high cell densities (>10 8 cells/mL 5 ), and remarkable achievable printing speeds.”
Wu, D., Yu, Y., Tan, J., Huang, L., Luo, B., Lu, L., & Zhou, C. (2018) · Materials & Design · doi:10.1016/j.matdes.2018.09.040 · Cited by 157
Theus, A. S., Ning, L., Hwang, B., Gil, C., Chen, S., Wombwell, A., Mehta, R., & Serpooshan, V. (2020) · Polymers · doi:10.3390/polym12102262 · Cited by 147
Recent advances in 3D printing with protein-based inks
Mu, X., Agostinacchio, F., Xiang, N., Pei, Y., Khan, Y., Guo, C., Cebe, P., Motta, A., & Kaplan, D. L. (2021) · Progress in Polymer Science · doi:10.1016/j.progpolymsci.2021.101375 · Cited by 138
Self-citationDual crosslinked alginate hydrogels by riboflavin as photoinitiator
Kim, E., Kim, M. H., Song, J. H., Kang, C., & Park, W. H. (2020) · International Journal of Biological Macromolecules · doi:10.1016/j.ijbiomac.2020.03.134 · Cited by 93
Xu, Z., & Bratlie, K. M. (2018) · ACS Biomaterials Science & Engineering · doi:10.1021/acsbiomaterials.8b00230 · Cited by 91
Modeling cross model non-Newtonian fluid flow in porous media
Hauswirth, S. C., Bowers, C. A., Fowler, C. P., Schultz, P. B., Hauswirth, A. D., Weigand, T. M., & Miller, C. T. (2020) · Journal of Contaminant Hydrology · doi:10.1016/j.jconhyd.2020.103708 · Cited by 91
Doroteo, M. C., Mandujano-Tinoco, E. A., & Krötzsch, E. (2020) · Biochimica et Biophysica Acta (BBA) - General Subjects · doi:10.1016/j.bbagen.2020.129782 · Cited by 75
A Custom Ultra-Low-Cost 3D Bioprinter Supports Cell Growth and Differentiation
Ioannidis, K., Danalatos, R.-I., Tsaniras, S. C., Kaplani, K., Lokka, G., Kanellou, A., Papachristou, D. J., Bokias, G., Lygerou, Z., & Taraviras, S. L. (2020) · Frontiers in Bioengineering and Biotechnology · doi:10.3389/fbioe.2020.580889 · Cited by 72
Bucciarelli, A., Muthukumar, T., Kim, J. S., Kim, W. K., Quaranta, A., Maniglio, D., Khang, G., & Motta, A. (2019) · ACS Biomaterials Science & Engineering · doi:10.1021/acsbiomaterials.9b00814 · Cited by 70
Self-citationCharacterizing Bioinks for Extrusion Bioprinting: Printability and Rheology
O’Connell, C., Ren, J., Pope, L., Zhang, Y., Mohandas, A., Blanchard, R., Duchi, S., & Onofrillo, C. (2020) · Methods in Molecular Biology · doi:10.1007/978-1-0716-0520-2_7 · Cited by 69
Lorson, T., Ruopp, M., Nadernezhad, A., Eiber, J., Vogel, U. F., Jüngst, T., & Lühmann, T. C. (2020) · ACS Omega · doi:10.1021/acsomega.9b04096 · Cited by 68
Polysaccharide peptide conjugates: Chemistry, properties and applications
Mohan, T., Kleinschek, K. S., & Kargl, R. (2021) · Carbohydrate Polymers · doi:10.1016/j.carbpol.2021.118875 · Cited by 61
Enzymatically cross-linked alginic–hyaluronic acid composite hydrogels as cell delivery vehicles
Ganesh, N., Hanna, C., Nair, S. V., & Nair, L. S. (2013) · International Journal of Biological Macromolecules · doi:10.1016/j.ijbiomac.2012.12.045 · Cited by 59
Computational study of extrusion bioprinting with jammed gelatin microgel-based composite ink
Song, K., Zhang, D., Yin, J., & Huang, Y. H. (2021) · Additive manufacturing · doi:10.1016/j.addma.2021.101963 · Cited by 58
Open-source CAD-CAM simulator of the extrusion-based bioprinting process
Bonatti, A. F., Chiesa, I., Vozzi, G., & Maria, C. D. (2021) · Bioprinting · doi:10.1016/j.bprint.2021.e00172 · Cited by 49
Extrusion Bioprinting of Scaffolds
Chen, D. (2018) · Springer eBooks · doi:10.1007/978-3-030-03460-3_6 · Cited by 47
Bucciarelli, A., Chiera, S., Quaranta, A., Yadavalli, V. K., Motta, A., & Maniglio, D. (2019) · Advanced Functional Materials · doi:10.1002/adfm.201901134 · Cited by 42
Self-citationCombinatory approach of methacrylated alginate and acid monomers for concrete applications
Mignon, A., Devisscher, D., Graulus, G., Stubbe, B., Martins, J. C., Dubruel, P., Belie, N. D., & Vlierberghe, S. V. (2016) · Carbohydrate Polymers · doi:10.1016/j.carbpol.2016.08.102 · Cited by 42
Dennis, S. C., Whitlow, J., Detamore, M. S., Kieweg, S. L., & Berkland, C. J. (2016) · Langmuir · doi:10.1021/acs.langmuir.6b03529 · Cited by 38
Gaiardo, A., Novel, D., Scattolo, E., Crivellari, M., Picciotto, A., Ficorella, F., Iacob, E., Bucciarelli, A., Petti, L., Lugli, P., et al. (2021) · Sensors · doi:10.3390/s21030783 · Cited by 36
Self-citationHemingway, E. J., & Fielding, S. M. (2019) · Journal of Rheology · doi:10.1122/1.5095717 · Cited by 27
Zhao, D., Tie, C., Cheng, B., Yang, S., Wang, X., Sun, Z. Z., Yin, M.-M., Zhu, H., & Yin, M. (2020) · Polymer Degradation and Stability · doi:10.1016/j.polymdegradstab.2020.109297 · Cited by 27
Alonci, G., Mocchi, R., Sommatis, S., Capillo, M. C., Liga, E., Janowska, A., Nachbaur, L., & Zerbinati, N. (2021) · Pharmaceutics · doi:10.3390/pharmaceutics13081194 · Cited by 18
Multivariable optimization of inkjet printing process of Ag nanoparticle ink on Kapton
Bucciarelli, A., Adami, A., Chandraiahgari, C. R., & Lorenzelli, L. (2020) · IEEE International Conference on Flexible and Printable Sensors and Systems (FLEPS) · doi:10.1109/fleps49123.2020.9239474 · Cited by 17
Self-citationPhoto-enzymatic dityrosine crosslinking for bioprinting
Perin, F., Mota, C., Mancini, I., Motta, A., & Maniglio, D. (2022) · Polymer · doi:10.1016/j.polymer.2022.124941 · Cited by 13
Self-citationDesign of Experiment Rational Optimization of an Inkjet Deposition of Silver on Kapton
Bucciarelli, A., Olivetti, E., Adami, A., & Lorenzelli, L. (2021) · IEEE Sensors Journal · doi:10.1109/jsen.2021.3058543 · Cited by 12
Self-citation
Cited by
The fabrication of the chitosan-based bioink for in vitro tissue repair and regeneration: A review
Zhang, X., Feng, C., Islam, M. R., & Li, H. (2023) · International Journal of Biological Macromolecules · doi:10.1016/j.ijbiomac.2023.128504 · Cited by 48
Silk fibroin-based inks for in situ 3D printing using a double crosslinking process
Agostinacchio, F., Fitzpatrick, V., Dirè, S., Kaplan, D. L., & Motta, A. (2024) · Bioactive Materials · doi:10.1016/j.bioactmat.2024.01.015 · Cited by 58
Self-citationMachine Learning in Predicting and Optimizing Polymer Printability for 3D Bioprinting
Yu, J., Yao, D., Wang, L., & Xu, M. (2025) · Polymers · doi:10.3390/polym17131873 · Cited by 39
3D-printed MOF/MoS2 aerogel for dye adsorption and photocatalytic degradation
Alves, A. L. M. M., dos Santos, F. V., & Correa, D. S. (2024) · Materials Today Chemistry · doi:10.1016/j.mtchem.2024.102248 · Cited by 20
Bucciarelli, A., Selicato, N., Coricciati, C., Rainer, A., Capodilupo, A. L., Gigli, G., Moroni, L., Polini, A., & Gervaso, F. (2024) · Journal of Materials Chemistry B · doi:10.1039/d4tb00670d · Cited by 19
Self-citation
Metadata
- Authors
- Perin, F., Spessot, E., Famà, A., Bucciarelli, A., Callone, E., Mota, C., Motta, A., & Maniglio, D.
- Affiliations
- University of Trento (IT)
- Istituto Ortopedico Rizzoli (IT)
- Maastricht University (NL)
- Corresponding author
- Motta, Antonella
- ORCID
- Venue
- ACS Biomaterials Science & Engineering
- Publisher
- American Chemical Society (ACS)
- Published
- 2023-02-27
- Volume
- 9
- Issue
- 3
- Pages
- 1320-1331
- ISSN
- 2373-9878 (ISSN-L)
- PMC
- PMC10015426
- OpenAlex
- W4322488687
- Cited by
- 33
- References
- 47
- Citations by year
- 2026: 8 · 2025: 14 · 2024: 8 · 2023: 3
- FWCI
- 2.60
- Type
- journal article
- Language
- en
- Open access
- hybrid
- doi.org
- Licence
- Locations
- ACS Biomaterials Science & Engineering (publishedVersion, cc-by)
- PubMed Central (publishedVersion, cc-by)
- PubMed (publishedVersion)
- Research Publications (Maastricht University) (publishedVersion, cc-by)
- Iris (University of Trento) (submittedVersion, cc-by)
- Research Publications (Maastricht University) (submittedVersion, other-oa)
- Funders
- H2020 Marie Sklodowska-Curie Actions (101008041, 964452)
- Fondazione VRT
- Topics
- Physical Sciences › Engineering › Biomedical Engineering › 3D Printing in Biomedical Research
- Physical Sciences › Engineering › Industrial and Manufacturing Engineering › Additive Manufacturing and 3D Printing Technologies
- Physical Sciences › Materials Science › Biomaterials › Hydrogels: synthesis, properties, applications
- Keywords
- extrusion-based bioprinting, alginate, hyaluronic acid, rheology, shear thinning, viscoelasticity, extrudability, filament diameter, predictive modeling, ink formulation
- MeSH terms
- Alginates, Hyaluronic Acid, Ink, Bioprinting, Printing, Three-Dimensional
About these checks
Registry, retraction, Cites and statistics results are computed, not judged, with one exception: a printed reference that no index lists is read once by a model before it counts as a citation error. Claims are extracted by a model and kept only when their quote appears verbatim in the text; each cited source is then checked, with a model’s help, for whether it says what the claim relies on. Those verdicts can be wrong — read the claim’s quote and the cited source before relying on one.
Statistics and arithmetic are recomputed, not judged.
Confidence bands are shown only for fields calibrated on our annotated test set. None is calibrated yet, so no band is shown.
What counts as a claim ›How we measure confidence ›How we check this ›
Are you an author, or do you see a problem with this page? Request a review
Data sources
Bibliographic data: Semantic Scholar, OpenAlex, Crossref.
Contains information from the Semantic Scholar Academic Graph Datasets, made available under the ODC Attribution License (ODC-BY 1.0).
Semantic Scholar’s data is described in: Kinney, R., et al. (2023). The Semantic Scholar Open Data Platform. arXiv:2301.10140.
