

The DOI matches its Crossref record; 72 of the 72 references it cites were found in a registry or an index.
The impact of evidence reliability on sensitivity and bias in decision confidence.
Open accessAbstract
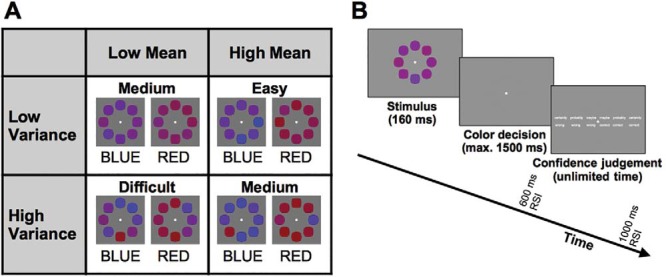
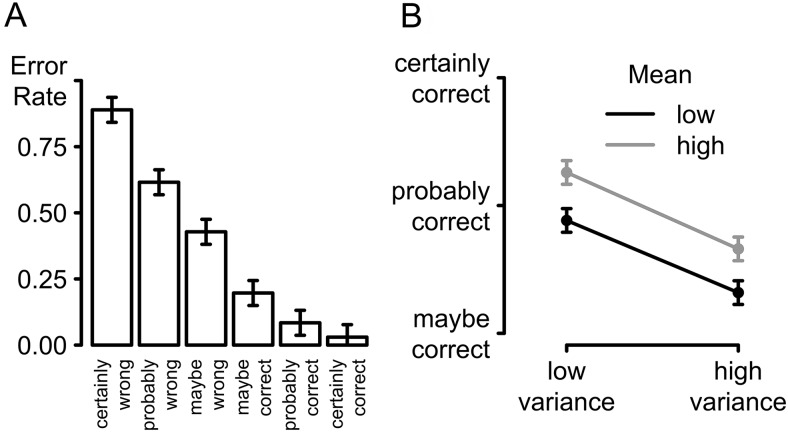
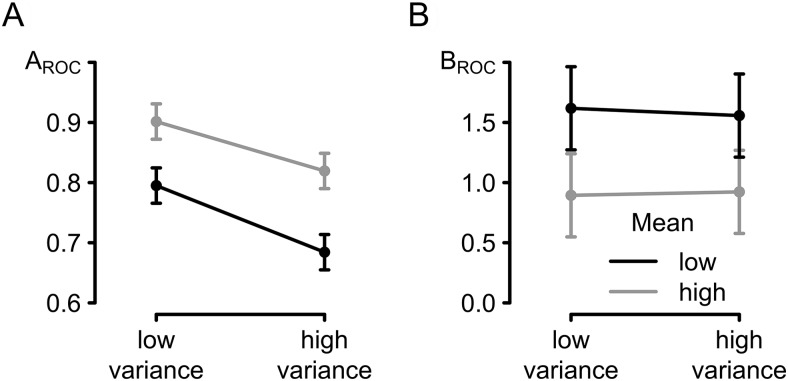
Human observers effortlessly and accurately judge their probability of being correct in their decisions, suggesting that metacognitive evaluation is an integral part of decision making. It remains a challenge for most models of confidence, however, to explain how metacognitive judgments are formed and which internal signals influence them. While the decision-making literature has suggested that confidence is based on privileged access to the evidence that gives rise to the decision itself, other lines of research on confidence have commonly taken the view of a multicue model of confidence. The present study aims at manipulating one such cue: the perceived reliability of evidence supporting an initial decision. Participants made a categorical judgment of the average color of an array of eight colored shapes, for which we critically manipulated both the distance of the mean color from the category boundary (evidence strength) and the variability of colors across the eight shapes (evidence reliability). Our results indicate that evidence reliability has a stronger impact on confidence than evidence strength. Specifically, we found that evidence reliability affects metacognitive readout, the mapping from subjectively experienced certainty to expressed confidence, allowing participants to adequately adjust their confidence ratings to match changes in objective task performance across conditions. (PsycINFO Database Record
Overview
The claims and statistics of this paper haven’t been checked yet.
Run the check — free, no account needed. It reads the open-access text and checks the sources it cites.
Integrity signals
Registry
Cites
Statistics
Figures
Verification
Claims the paper makes
The claims and statistics of this paper haven’t been checked yet.
Run the check — free, no account needed. It reads the open-access text and checks the sources it cites.
Claims other papers make about this one
Each is checked against this paper’s own text: does it say what the citing paper says it does?
The source backs part of the claim, not all of it — or backs it for a different population, condition or comparison.
In the citing paper
“A number of studies have presented evidence that confidence judgments are sensitive to the variability in perceptual evidence, although sometimes to a greater or lesser degree than predicted by an ideal observer model (Boldt et al. 2017, Spence et al. 2016, Zylberberg et al. 2014).”
From Metacognition and Confidence: A Review and Synthesis (2024) · cites this paper as Boldt et al. 2017
Experimental — accuracy not yet measured
Self-check
Percentages, sums and reported differences re-computed from the paper’s own numbers.
The self-check needs the paper’s full text.
Citations
Cites
Kass, R. E., & Raftery, A. E. (1995) · Journal of the American Statistical Association · doi:10.1080/01621459.1995.10476572 · Cited by 12,558
Kruger, J., & Dunning, D. (1999) · Journal of Personality and Social Psychology · doi:10.1037/0022-3514.77.6.1121 · Cited by 7,731
Bayesian t tests for accepting and rejecting the null hypothesis
Rouder, J. N., Speckman, P. L., Sun, D., Morey, R. D., & Iverson, G. (2009) · Psychonomic Bulletin & Review · doi:10.3758/pbr.16.2.225 · Cited by 3,688
Using confidence intervals in within-subject designs
Loftus, G. R., & Masson, M. E. J. (1994) · Psychonomic Bulletin & Review · doi:10.3758/bf03210951 · Cited by 2,433
Computing Bayes Factors by Combining Simulation and Asymptotic Approximations
DiCiccio, T., Kass, R., Raftery, A., & Wasserman, L. (1997) · Journal of the American Statistical Association · doi:10.1080/01621459.1997.10474045 · Cited by 2,029
The weighing of evidence and the determinants of confidence
Griffin, D., & Tversky, A. (1992) · Cognitive Psychology · doi:10.1016/0010-0285(92)90013-r · Cited by 1,866
Probabilistic mental models: a Brunswikian theory of confidence
Gigerenzer, G., Hoffrage, U., & Kleinbölting, H. (1991) · Psychological Review · doi:10.1037/0033-295x.98.4.506 · Cited by 1,506
Bayesian inference with probabilistic population codes
Ma, W. J., Beck, J. M., Latham, P. E., & Pouget, A. (2006) · Nature Neuroscience · doi:10.1038/nn1790 · Cited by 1,457
Bayesian model selection for group studies
Stephan, K. E., Penny, W. D., Daunizeau, J., Moran, R. J., & Friston, K. J. (2009) · NeuroImage · doi:10.1016/j.neuroimage.2009.03.025 · Cited by 1,423
Fleming, S. M., & Lau, H. C. (2014) · Frontiers in Human Neuroscience · doi:10.3389/fnhum.2014.00443 · Cited by 1,408 · cited 2×
“Caution is advised when comparing conditions that are not matched for accuracy, though (Fleming & Lau, 2014).”
Background
Cited by
Sorted by citations
Items 101–109 of 109
Observability constrains expertise-dependent kinematic readout in action prediction
Zhao, Q., & Zhou, C. (2026) · Cognitive Research Principles and Implications · doi:10.1186/s41235-026-00735-9
Bercovich, E., & Ackerman, R. (2026) · Radiology · doi:10.1148/radiol.252834
Distinct forms of uncertainty guide information seeking and subjective confidencePreprint
Edwards-Lowe, G., Chiusa, E. L., Olawole‐Scott, H., & Yon, D. (2026) · PsyArXiv (OSF Preprints) · doi:10.31234/osf.io/cf4a7_v2
Metacognition and consciousness
Peters, M. A. K. (2026) · Elsevier eBooks · doi:10.1016/b978-0-443-29258-3.00052-5
Comay, N. A., Solovey, G., & Barttfeld, P. (2026) · eLife · doi:10.7554/elife.111820
Comay, N. A., Solovey, G., & Barttfeld, P. (2026) · eLife · doi:10.7554/elife.111820.1
Pan, X., Liu, J., Ding, S., & Li, C. (2026) · IEEE Transactions on Intelligent Transportation Systems · doi:10.1109/tits.2026.3725655
Distinct neural routes for evaluative and informational social influence
Manivasagam, S., Schultze, T., Schacht, A., & Fischer, A. (2026) · Cerebral Cortex · doi:10.1093/cercor/bhag107
Metadata
- Authors
- Boldt, A., de Gardelle, V., & Yeung, N.
- Affiliations
- University of Oxford (GB)
- Centre d'Économie de la Sorbonne (FR)
- Corresponding author
- Boldt, Annika
- Venue
- Journal of Experimental Psychology: Human Perception and Performance
- Published
- 2017-08
- Volume
- 43
- Issue
- 8
- Pages
- 1520-1531
- ISSN
- 0096-1523 (ISSN-L)
- 1939-1277
- PMC
- PMC5524444
- OpenAlex
- W2605154204
- Cited by
- 110
- References
- 71
- Citations by year
- 2026: 15 · 2025: 10 · 2024: 13 · 2023: 11 · 2022: 13 · 2021: 13 · 2020: 9 · 2019: 13 · 2018: 9 · 2017: 4
- FWCI
- 5.49
- Type
- journal article
- Language
- en
- Open access
- hybrid
- doi.org
- Licence
- Locations
- Journal of Experimental Psychology Human Perception & Performance (publishedVersion, cc-by)
- Europe PMC (PubMed Central) (publishedVersion, cc-by)
- PubMed Central (publishedVersion, cc-by)
- PubMed (publishedVersion)
- RePEc: Research Papers in Economics (submittedVersion)
- HAL (submittedVersion, other-oa)
- UCL Discovery (University College London) (submittedVersion)
- Funders
- Economic and Social Research Council
- Topics
- Life Sciences › Neuroscience › Cognitive Neuroscience › Visual perception and processing mechanisms
- Life Sciences › Neuroscience › Cognitive Neuroscience › Memory Processes and Influences
- Social Sciences › Decision Sciences › General Decision Sciences › Decision-Making and Behavioral Economics
- Keywords
- metacognition, decision confidence, reliability of evidence, quality of evidence, confidence bias, categorical judgment, variability, confidence calibration
- MeSH terms
- Metacognition, Adolescent, Adult, Color Perception, Decision Making, Female, Humans, Judgment, Male, Young Adult
About these checks
Registry, retraction, Cites and statistics results are computed, not judged, with one exception: a printed reference that no index lists is read once by a model before it counts as a citation error. Claims are extracted by a model and kept only when their quote appears verbatim in the text; each cited source is then checked, with a model’s help, for whether it says what the claim relies on. Those verdicts can be wrong — read the claim’s quote and the cited source before relying on one.
Statistics and arithmetic are recomputed, not judged.
Confidence bands are shown only for fields calibrated on our annotated test set. None is calibrated yet, so no band is shown.
What counts as a claim ›How we measure confidence ›How we check this ›
Are you an author, or do you see a problem with this page? Request a review
