

The DOI matches its Crossref record; 33 of the 33 references it cites were found in a registry or an index.
Biological activity of tumor-treating fields in preclinical glioma models
Open accessAbstract
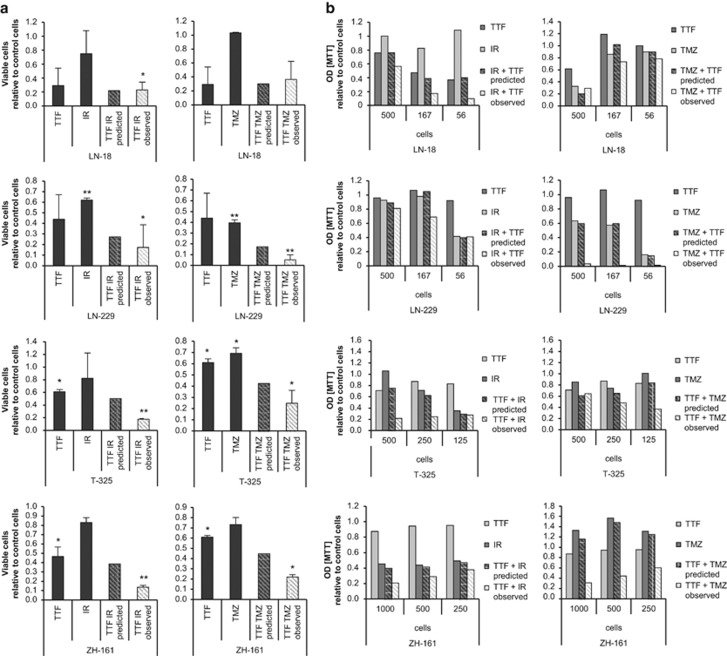
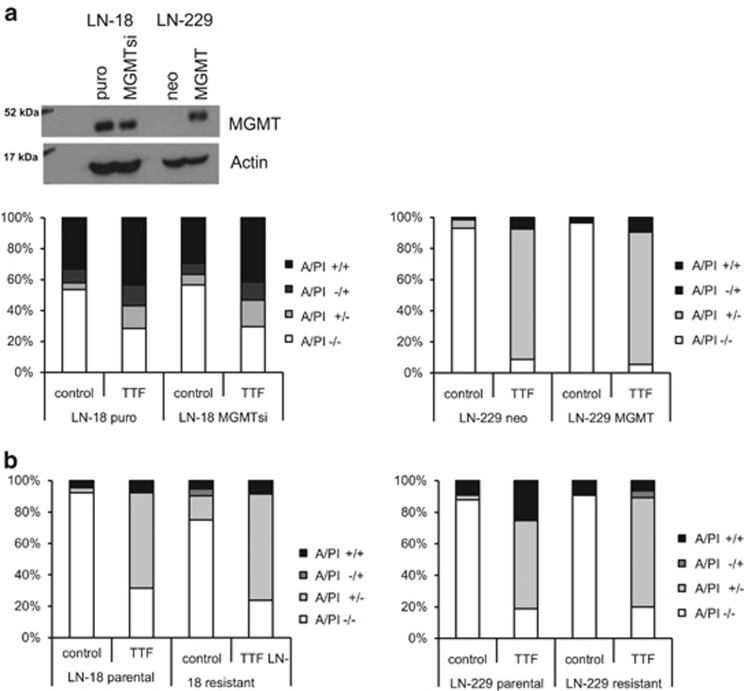
Glioblastoma is the most common and aggressive form of intrinsic brain tumor with a very poor prognosis. Thus, novel therapeutic approaches are urgently needed. Tumor-treating fields (TTFields) may represent such a novel treatment option. The aim of this study was to investigate the effects of TTFields on glioma cells, as well as the functional characterization of the underlying mechanisms. Here, we assessed the anti-glioma activity of TTFields in several preclinical models. Applying TTFields resulted in the induction of cell death in a frequency- and intensity-dependent manner in long-term glioma cell lines, as well as glioma-initiating cells. Cell death occurred in the absence of caspase activation, but involved autophagy and necroptosis. Severe alterations in cell cycle progression and aberrant mitotic features, such as poly- and micronucleation, preceded the induction of cell death. Furthermore, exposure to TTFields led to reduced migration and invasion, which are both biological hallmarks of glioma cells. The combination of TTFields with irradiation or the alkylating agent, temozolomide (TMZ), resulted in additive or synergistic effects, and the O 6-methyl-guanine DNA methyltransferase status did not influence the efficacy of TTFields. Importantly, TMZ-resistant glioma cells were responsive to TTFields application, highlighting the clinical potential of this therapeutic approach. In summary, our results indicate that TTFields induce autophagy, as well as necroptosis and hamper the migration and invasiveness of glioma cells. These findings may allow for a more detailed clinical evaluation of TTFields beyond the clinical data available so far.
Overview
The claims and statistics of this paper haven’t been checked yet.
Run the check — free, no account needed. It reads the open-access text and checks the sources it cites.
Integrity signals
Registry
Cites
Statistics
Figures
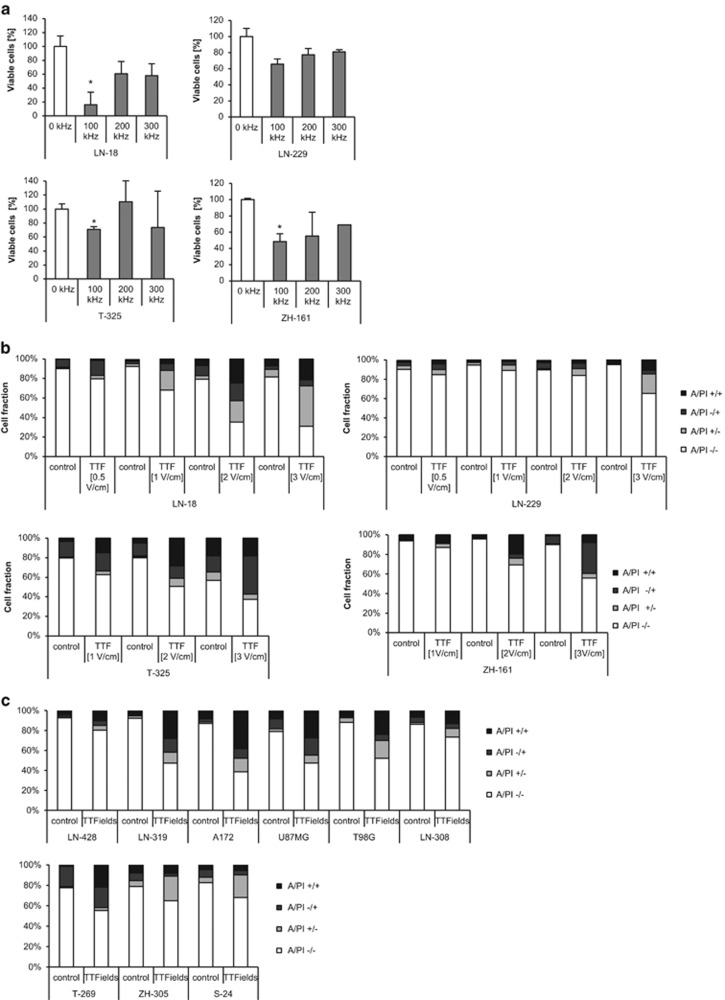
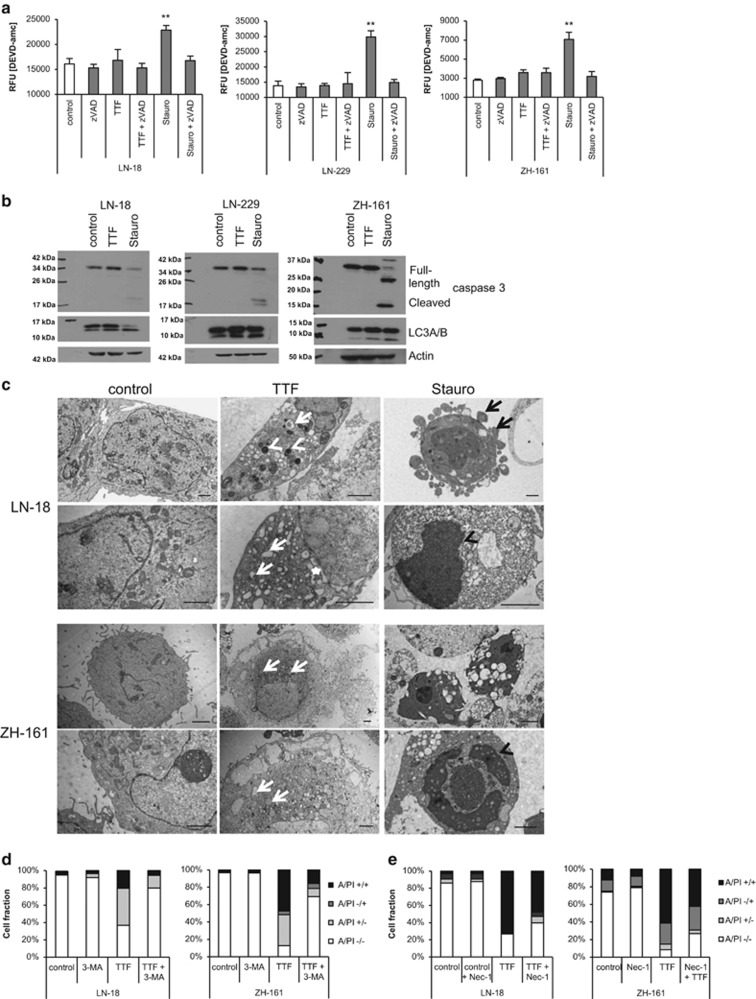
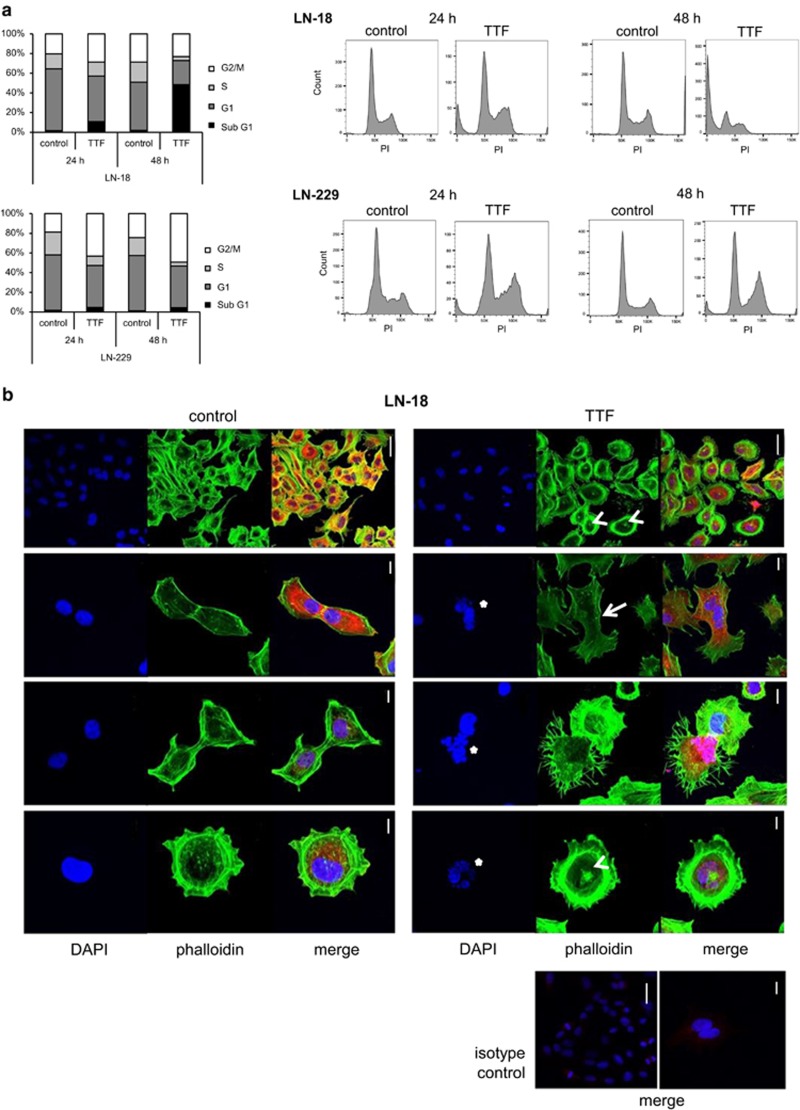
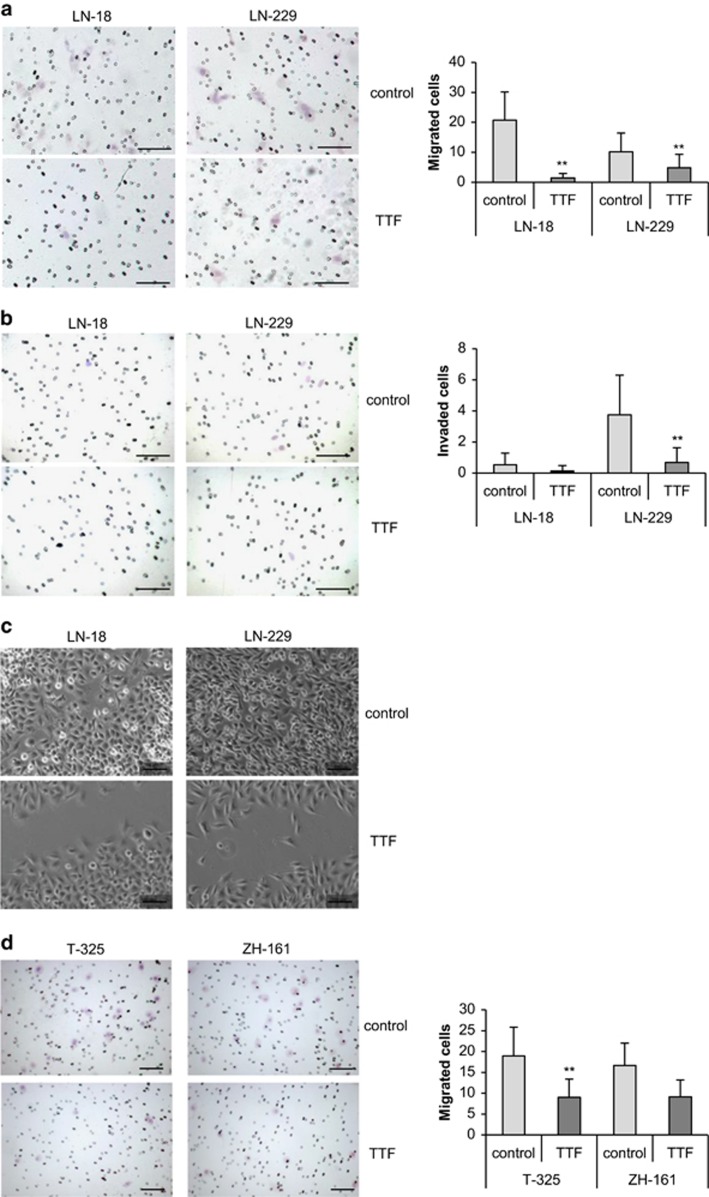
Verification
Claims the paper makes
The claims and statistics of this paper haven’t been checked yet.
Run the check — free, no account needed. It reads the open-access text and checks the sources it cites.
Claims other papers make about this one
Each is checked against this paper’s own text: does it say what the citing paper says it does?
In the citing paper
“A recent study supports this hypothesis by providing evidence that TTFields induce autophagy in glioma cell lines17.”
From AMPK-dependent autophagy upregulation serves as a survival mechanism in response to Tumor Treating Fields (TTFields) (2018) · cites this paper as [17]
In the citing paper
“Interestingly, a recent study by Silginer et al.17 demonstrated that the concomitant use of 3-Methyladenine (3-MA; early-stage inhibitor of autophagy) during TTFields application result in higher cell viability.”
From AMPK-dependent autophagy upregulation serves as a survival mechanism in response to Tumor Treating Fields (TTFields) (2018) · cites this paper as [17]
Self-check
Percentages, sums and reported differences re-computed from the paper’s own numbers.
The self-check needs the paper’s full text.
Citations
Cites
Radiotherapy Plus Concomitant and Adjuvant Temozolomide for Glioblastoma
Stupp, R., Mason, W. P., van den Bent, M. J., Weller, M., Fisher, B., Taphoorn, M. J. B., Belanger, K., Brandes, A. A., Marosi, C., Bogdahn, U., et al. (2005) · New England Journal of Medicine · doi:10.1056/nejmoa043330 · Cited by 21,807
Self-citationMGMT Gene Silencing and Benefit from Temozolomide in Glioblastoma
Hegi, M. E., Diserens, A.-C., Gorlia, T., Hamou, M.-F., de Tribolet, N., Weller, M., Kros, J. M., Hainfellner, J. A., Mason, W., Mariani, L., et al. (2005) · New England Journal of Medicine · doi:10.1056/nejmoa043331 · Cited by 7,405
Self-citationGlioma stem cells promote radioresistance by preferential activation of the DNA damage response
Bao, S., Wu, Q., McLendon, R. E., Hao, Y., Shi, Q., Hjelmeland, A. B., Dewhirst, M. W., Bigner, D. D., & Rich, J. N. (2006) · Nature · doi:10.1038/nature05236 · Cited by 6,517
Single-cell RNA-seq highlights intratumoral heterogeneity in primary glioblastoma
Patel, A. P., Tirosh, I., Trombetta, J. J., Shalek, A. K., Gillespie, S. M., Wakimoto, H., Cahill, D. P., Nahed, B. V., Curry, W. T., Martuza, R. L., et al. (2014) · Science · doi:10.1126/science.1254257 · Cited by 5,063
The Somatic Genomic Landscape of Glioblastoma
Brennan, C. W., Verhaak, R. G. W., McKenna, A., Campos, B., Noushmehr, H., Salama, S. R., Zheng, S., Chakravarty, D., Sanborn, J. Z., Berman, S. H., et al. (2013) · Cell · doi:10.1016/j.cell.2013.09.034 · Cited by 5,016
Biomechanics and biophysics of cancer cells☆
SURESH, S. (2007) · Acta Biomaterialia · doi:10.1016/j.actbio.2007.04.002 · Cited by 1,284
Stupp, R., Taillibert, S., Kanner, A. A., Kesari, S., Steinberg, D. M., Toms, S. A., Taylor, L. P., Lieberman, F., Silvani, A., Fink, K. L., et al. (2015) · JAMA · doi:10.1001/jama.2015.16669 · Cited by 1,259
Self-citationWeller, M., Wick, W., Aldape, K. D., Brada, M., Berger, M. S., Pfister, S. M., Nishikawa, R., Rosenthal, M. A., Wen, P. Y., Stupp, R., et al. (2015) · Nature Reviews Disease Primers · doi:10.1038/nrdp.2015.17 · Cited by 1,175
Self-citationAlternating electric fields arrest cell proliferation in animal tumor models and human brain tumors
Kirson, E. D., Dbalý, V., Tovaryš, F., Vymazal, J., Soustiel, J. F., Itzhaki, A., Mordechovich, D., Steinberg-Shapira, S., Gurvich, Z., Schneiderman, R., et al. (2007) · Proceedings of the National Academy of Sciences · doi:10.1073/pnas.0702916104 · Cited by 894
Stupp, R., Wong, E. T., Kanner, A. A., Steinberg, D., Engelhard, H., Heidecke, V., Kirson, E. D., Taillibert, S., Liebermann, F., Dbalý, V., et al. (2012) · European Journal of Cancer · doi:10.1016/j.ejca.2012.04.011 · Cited by 862
Self-citationDisruption of cancer cell replication by alternating electric fields
Kirson, E. D., Gurvich, Z., Schneiderman, R., Dekel, E., Itzhaki, A., Wasserman, Y., Schatzberger, R., & Palti, Y. (2004) · Cancer research · doi:10.1158/0008-5472.can-04-0083 · Cited by 827
EANO guideline for the diagnosis and treatment of anaplastic gliomas and glioblastoma
Weller, M., van den Bent, M. J., Hopkins, K., Tonn, J. C., Stupp, R., Falini, A., Moyal, E. C., Frappaz, D., Henriksson, R., Balañá, C., et al. (2014) · The Lancet Oncology · doi:10.1016/s1470-2045(14)70011-7 · Cited by 796
Self-citationHeterogeneity Maintenance in Glioblastoma: A Social Network
Bonavia, R., Inda, M.-D.-M., Cavenee, W. K., & Furnari, F. B. (2011) · Cancer Research · doi:10.1158/0008-5472.can-11-0153 · Cited by 441
Giladi, M., Schneiderman, R. S., Voloshin, T., Porat, Y., Munster, M., Blat, R., Sherbo, S., Bomzon, Z., Urman, N., Itzhaki, A., et al. (2015) · Scientific Reports · doi:10.1038/srep18046 · Cited by 327
Hermisson, M., Klumpp, A., Wick, W., Wischhusen, J., Nagel, G., Roos, W. P., Kaina, B., & Weller, M. (2006) · Journal of Neurochemistry · doi:10.1111/j.1471-4159.2005.03583.x · Cited by 318
Self-citationKirson, E. D., Schneiderman, R. S., Dbalý, V., Tovaryš, F., Vymazal, J., Itzhaki, A., Mordechovich, D., Gurvich, Z., Shmueli, E., Goldsher, D., et al. (2009) · BMC Medical Physics · doi:10.1186/1756-6649-9-1 · Cited by 224
Tumor Treating Fields Perturb the Localization of Septins and Cause Aberrant Mitotic Exit
Gera, N., Yang, A., Holtzman, T. S., Lee, S. X., Wong, E. T., & Swanson, K. D. (2015) · PLOS ONE · doi:10.1371/journal.pone.0125269 · Cited by 217
Potential therapeutic implications of cancer stem cells in glioblastoma
Cheng, L., Bao, S., & Rich, J. N. (2010) · Biochemical Pharmacology · doi:10.1016/j.bcp.2010.04.035 · Cited by 200
Tumor treating fields: A new frontier in cancer therapy
Davies, A. M., Weinberg, U., & Palti, Y. (2013) · Annals of the New York Academy of Sciences · doi:10.1111/nyas.12112 · Cited by 193
Parker, N., Hudson, A. L., Khong, P., Parkinson, J., Dwight, T., Ikin, R. J., Zhu, Y., Cheng, Z. J., Vafaee, F., Chen, J., et al. (2016) · Scientific Reports · doi:10.1038/srep22477 · Cited by 183
Alternating electric fields (TTFields) inhibit metastatic spread of solid tumors to the lungs
Kirson, E. D., Giladi, M., Gurvich, Z., Itzhaki, A., Mordechovich, D., Schneiderman, R. S., Wasserman, Y., Ryffel, B., Goldsher, D., & Palti, Y. (2009) · Clinical & Experimental Metastasis · doi:10.1007/s10585-009-9262-y · Cited by 171
Tumor treating fields inhibit glioblastoma cell migration, invasion and angiogenesis
Kim, E. H., Song, H. S., Yoo, S., & Yoon, M. (2016) · Oncotarget · doi:10.18632/oncotarget.11372 · Cited by 145
Distinct molecular mechanisms of acquired resistance to temozolomide in glioblastoma cells
Hertler, C., Roth, P., Wick, W., Schmidt, N., Florea, A., Silginer, M., Reifenberger, G., & Weller, M. (2012) · Journal of Neurochemistry · doi:10.1111/j.1471-4159.2012.07781.x · Cited by 144
Self-citationFlorian, B.-A., Lamure, M. P., Ducray, F., Aulagner, G., Honnorat, J., & Armoiry, X. (2016) · Neuro-Oncology · doi:10.1093/neuonc/now102 · Cited by 120
Giladi, M., Schneiderman, R. S., Porat, Y., Munster, M., Itzhaki, A., Mordechovich, D., Cahal, S., Kirson, E. D., Weinberg, U., & Palti, Y. (2014) · Pancreatology · doi:10.1016/j.pan.2013.11.009 · Cited by 98
MicroRNA-mediated down-regulation of NKG2D ligands contributes to glioma immune escape
Codó, P., Weller, M., Meister, G., Szabó, E., Steinle, A., Wolter, M., Reifenberger, G., & Roth, P. (2014) · Oncotarget · doi:10.18632/oncotarget.2287 · Cited by 95
Self-citationNuclear actin and myosins at a glance
de Lanerolle, P. (2012) · Journal of Cell Science · doi:10.1242/jcs.099754 · Cited by 88
Tumor treating fields: concept, evidence and future
Pless, M., & Weinberg, U. (2011) · Expert Opinion on Investigational Drugs · doi:10.1517/13543784.2011.583236 · Cited by 78
TTFields: where does all the skepticism come from?
Wick, W. (2016) · Neuro-Oncology · doi:10.1093/neuonc/now012 · Cited by 68
Schneiderman, R. S., Shmueli, E., Kirson, E. D., & Palti, Y. (2010) · BMC Cancer · doi:10.1186/1471-2407-10-229 · Cited by 65
Hertler, C., Roth, P., Silginer, M., Florea, A., Lamszus, K., Frei, K., Deenen, R., Reifenberger, G., & Weller, M. (2014) · Molecular Cancer Therapeutics · doi:10.1158/1535-7163.mct-13-0772 · Cited by 49
Self-citationControl of glioma cell migration and invasiveness by GDF-15
Codó, P., Weller, M., Kaulich, K., Schraivogel, D., Silginer, M., Reifenberger, G., Meister, G., & Roth, P. (2016) · Oncotarget · doi:10.18632/oncotarget.6816 · Cited by 49
Self-citationTransient cavitation in tissues during ultrasonically induced hyperthermia
Sommer, F. G., & Pounds, D. W. (1982) · Medical Physics · doi:10.1118/1.595065 · Cited by 36
Cited by
Sorted by citations
Tumour treating fields therapy for glioblastoma: current advances and future directions
Rominiyi, O., Vanderlinden, A., Clenton, S. J., Bridgewater, C. H., Al-Tamimi, Y., & Collis, S. J. (2020) · British Journal of Cancer · doi:10.1038/s41416-020-01136-5 · Cited by 342
Pseudolaric acid B triggers ferroptosis in glioma cells via activation of Nox4 and inhibition of xCT
Wang, Z., Ding, Y., Wang, X., Lu, S., Wang, C., He, C. H., Wang, L., Piao, M., Chi, G., Luo, Y., et al. (2018) · Cancer Letters · doi:10.1016/j.canlet.2018.04.021 · Cited by 211
Toms, S. A., Kim, C., Nicholas, G. A., & Ram, Z. (2018) · Journal of Neuro-Oncology · doi:10.1007/s11060-018-03057-z · Cited by 188
Voloshin, T., Kaynan, N., Davidi, S., Porat, Y., Shteingauz, A., Schneiderman, R. S., Zeevi, E., Munster, M., Blat, R., Tempel-Brami, C., et al. (2020) · Cancer Immunology Immunotherapy · doi:10.1007/s00262-020-02534-7 · Cited by 189
Tumor treating fields increases membrane permeability in glioblastoma cells
Chang, E., Patel, C. B., Pohling, C., Young, C., Song, J., Flores, T. A., Zeng, Y., Joubert, L.-M., Arami, H., Natarajan, A., et al. (2018) · Cell Death Discovery · doi:10.1038/s41420-018-0130-x · Cited by 137
Metadata
- Authors
- Silginer, M., Weller, M., Stupp, R., & Roth, P.
- Affiliations
- University of Zurich (CH)
- Corresponding author
- Roth, Patrick
- Venue
- Cell Death & Disease
- Published
- 2017-04-20
- Volume
- 8
- Issue
- 4
- Pages
- e2753-e2753
- ISSN
- 2041-4889 (ISSN-L)
- PMC
- PMC5477589
- OpenAlex
- W2606398715
- Cited by
- 111
- References
- 33
- Citations by year
- 2026: 9 · 2025: 6 · 2024: 11 · 2023: 14 · 2022: 16 · 2021: 15 · 2020: 16 · 2019: 10 · 2018: 14
- FWCI
- 6.29
- Type
- journal article
- Language
- en
- Open access
- gold
- doi.org
- Locations
- Cell Death and Disease (publishedVersion, cc-by)
- Europe PMC (PubMed Central) (publishedVersion, cc-by)
- PubMed Central (publishedVersion, cc-by)
- PubMed (publishedVersion)
- Zurich Open Repository and Archive (University of Zurich) (acceptedVersion, cc-by)
- Zurich Open Repository and Archive (University of Zurich) (submittedVersion, cc-by)
- Zurich Open Repository and Archive (University of Zurich)
- Funders
- Novocure
- Topics
- Health Sciences › Medicine › Oncology › Glioma Diagnosis and Treatment
- Life Sciences › Biochemistry, Genetics and Molecular Biology › Biophysics › Electromagnetic Fields and Biological Effects
- Physical Sciences › Engineering › Biomedical Engineering › Ultrasound and Hyperthermia Applications
- Keywords
- tumor treating fields, glioblastoma, glioma, glioma stem cells, autophagy, necroptosis, caspase-independent cell death, cell cycle arrest, micronucleation, cell migration, tumor invasion, temozolomide resistance, radiosensitization, O6-methylguanine-DNA methyltransferase, combination therapy
- MeSH terms
- Temozolomide, Brain Neoplasms, Cell Cycle, Cell Movement, Cell Survival, Dacarbazine, Glioma, Humans, Neoplasm Invasiveness, DNA Modification Methylases, Apoptosis, Caspases, Tumor Suppressor Proteins, DNA Repair Enzymes, Cell Line, Tumor
About these checks
Registry, retraction, Cites and statistics results are computed, not judged, with one exception: a printed reference that no index lists is read once by a model before it counts as a citation error. Claims are extracted by a model and kept only when their quote appears verbatim in the text; each cited source is then checked, with a model’s help, for whether it says what the claim relies on. Those verdicts can be wrong — read the claim’s quote and the cited source before relying on one.
Statistics and arithmetic are recomputed, not judged.
Confidence bands are shown only for fields calibrated on our annotated test set. None is calibrated yet, so no band is shown.
What counts as a claim ›How we measure confidence ›How we check this ›
Are you an author, or do you see a problem with this page? Request a review
