Student or educator? Sign up with your school email and get 6 months of Pro free.
Cited by 504

The DOI matches its Crossref record; 59 of the 59 references it cites were found in a registry or an index.

The Roles of Cerebral Blood Flow, Capillary Transit Time Heterogeneity, and Oxygen Tension in Brain Oxygenation and Metabolism

Jespersen, Sune N, Østergaard, Leif·2012·Journal of Cerebral Blood Flow & Metabolism

Abstract

Normal brain function depends critically on moment-to-moment regulation of oxygen supply by the bloodstream to meet changing metabolic needs. Neurovascular coupling, a range of mechanisms that converge on arterioles to adjust local cerebral blood flow ( CBF), represents our current framework for understanding this regulation. We modeled the combined effects of CBF and capillary transit time heterogeneity (CTTH) on the maximum oxygen extraction fraction ( OEF max ) and metabolic rate of oxygen that can biophysically be supported, for a given tissue oxygen tension. Red blood cell velocity recordings in rat brain support close hemodynamic—metabolic coupling by means of CBF and CTTH across a range of physiological conditions. The CTTH reduction improves tissue oxygenation by counteracting inherent reductions in OEF max as CBF increases, and seemingly secures sufficient oxygenation during episodes of hyperemia resulting from cortical activation or hypoxemia. In hypoperfusion and states of blocked CBF, both lower oxygen tension and CTTH may secure tissue oxygenation. Our model predicts that disturbed capillary flows may cause a condition of malignant CTTH, in which states of higher CBF display lower oxygen availability. We propose that conditions with altered capillary morphology, such as amyloid, diabetic or hypertensive microangiopathy, and ischemia—reperfusion, may disturb CTTH and thereby flow-metabolism coupling and cerebral oxygen metabolism.

Overview

The claims and statistics of this paper haven’t been checked yet.

Run the check — free, no account needed. It reads the open-access text and checks the sources it cites.

A few free checks a day · papers already verified open instantly · results are public

Integrity signals

Registry

Crossref · 10.1038/jcbfm.2011.153

Cites

59 of 59 references verified0 citation errors · 0 not checkable

Statistics

Figures

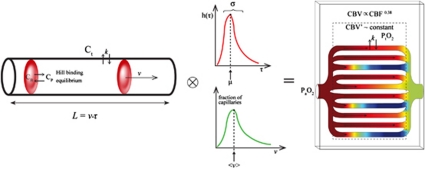
Figure 1 Model overview. On the left, the single capillary model is sketched. It consists of three compartments, oxygen bound to hemoglobin, oxygen in plasma, and oxygen in tissue. Oxygen in plasma is assumed to be in equilibrium with oxygen bound to hemoglobin, their concentrations related by the Hill equation. Transfer of oxygen across the capillary membrane is modeled as a first-order exchange process with the rate constant k. The capillary has a length L, and blood moves with a velocity v resulting in transit time τ=L/v. The capillary bed on the right is then obtained as a collection of capillaries modeled as described, but with different transit times τ taken from the transit time distribution h(τ), as shown in the middle. Total capillary volume CBV′ was assumed to either remain constant, or to vary with CBF in the same way as total blood volume, modeled here by Grubb's relation. CBF, cerebral blood flow; CBV, cerebral blood volume; CBV′, capillary blood volume.
Figure 1 Model overview. On the left, the single capillary model is sketched. It consists of three compartments, oxygen bound to hemoglobin, oxygen in plasma, and oxygen in tissue. Oxygen in plasma is assumed to be in equilibrium with oxygen bound to hemoglobin, their concentrations related by the Hill equation. Transfer of oxygen across the capillary membrane is modeled as a first-order exchange process with the rate constant k. The capillary has a length L, and blood moves with a velocity v resulting in transit time τ=L/v. The capillary bed on the right is then obtained as a collection of capillaries modeled as described, but with different transit times τ taken from the transit time distribution h(τ), as shown in the middle. Total capillary volume CBV′ was assumed to either remain constant, or to vary with CBF in the same way as total blood volume, modeled here by Grubb's relation. CBF, cerebral blood flow; CBV, cerebral blood volume; CBV′, capillary blood volume.CC BY-NC-ND · PubMed Central
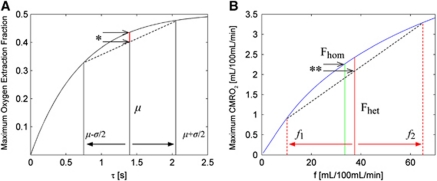
Figure 2 Oxygen extraction as a function of capillary transit time. (A) The maximum attainable oxygen extraction fraction versus transit time is shown. Note that oxygen extraction becomes inefficient toward short mean transit times, μ=CBV′/CBF. The same principle applies to individual transit times along separate paths in the capillary tree. However, the effect is nonlinear, and because of the concave nature of the curve, a broad capillary transit time distribution (illustrated here by two populations with transit times μ−σ/2 and μ+σ/2) yields considerably lower OEFmax (indicated by the asterisk) for this distribution than the corresponding homogenous distribution, where all capillary transits have identical transit time μ. The same phenomenon may result in a decreased net oxygen extraction despite an increased net flow: in (B), maximum CMRO2 is plotted versus flow using our model, and here the green line indicates the flow and associated CMRO2max from a homogeneous population of capillaries with a net flow Fhom. A slightly larger flow Fhet>Fhom, indicated by the red line is now accommodated by the same capillary bed, but divided into two populations, where one population has flow f1 and the other f2, f1+f2=Fhet. However, the net oxygen extraction in this case (intersection of the dashed diagonal line with the red vertical line) is in fact smaller than that obtained for the homogenous, lower flow case, as indicated by the double asterisk. CBF, cerebral blood flow; CBV′, capillary blood volume; OEFmax, maximum oxygen extraction fraction; CMRO2, cerebral metabolic rate of oxygen; CMRO2max, maximum CMRO2.
Figure 2 Oxygen extraction as a function of capillary transit time. (A) The maximum attainable oxygen extraction fraction versus transit time is shown. Note that oxygen extraction becomes inefficient toward short mean transit times, μ=CBV′/CBF. The same principle applies to individual transit times along separate paths in the capillary tree. However, the effect is nonlinear, and because of the concave nature of the curve, a broad capillary transit time distribution (illustrated here by two populations with transit times μ−σ/2 and μ+σ/2) yields considerably lower OEFmax (indicated by the asterisk) for this distribution than the corresponding homogenous distribution, where all capillary transits have identical transit time μ. The same phenomenon may result in a decreased net oxygen extraction despite an increased net flow: in (B), maximum CMRO2 is plotted versus flow using our model, and here the green line indicates the flow and associated CMRO2max from a homogeneous population of capillaries with a net flow Fhom. A slightly larger flow Fhet>Fhom, indicated by the red line is now accommodated by the same capillary bed, but divided into two populations, where one population has flow f1 and the other f2, f1+f2=Fhet. However, the net oxygen extraction in this case (intersection of the dashed diagonal line with the red vertical line) is in fact smaller than that obtained for the homogenous, lower flow case, as indicated by the double asterisk. CBF, cerebral blood flow; CBV′, capillary blood volume; OEFmax, maximum oxygen extraction fraction; CMRO2, cerebral metabolic rate of oxygen; CMRO2max, maximum CMRO2.CC BY-NC-ND · PubMed Central
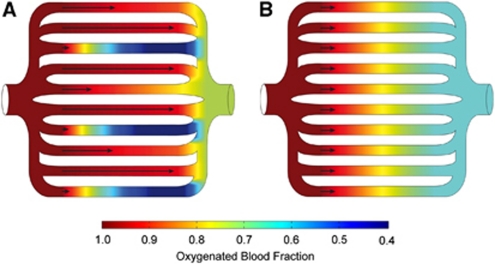
Figure 3 Effects of capillary transit time heterogeneity (CTTH) on oxygen extraction. (A, B) Compare the extraction of oxygen from individual capillaries according to commonly accepted Crone-Renkin kinetics when the same flow is distributed across the same number of parallel capillary paths with homogenous (B) capillary flow velocities (arrows), and heterogeneous flow velocities (A), respectively. Transit times in the resting, heterogeneous case were obtained by sampling a gamma distribution with parameters corresponding to recordings of mean and standard deviation of transit times in a rat (Stefanovic et al, 2008). Notice that venous outflow oxygen concentration is affected by the heterogeneity of capillary flows, in spite of identical total blood flows and number of open capillaries.
Figure 3 Effects of capillary transit time heterogeneity (CTTH) on oxygen extraction. (A, B) Compare the extraction of oxygen from individual capillaries according to commonly accepted Crone-Renkin kinetics when the same flow is distributed across the same number of parallel capillary paths with homogenous (B) capillary flow velocities (arrows), and heterogeneous flow velocities (A), respectively. Transit times in the resting, heterogeneous case were obtained by sampling a gamma distribution with parameters corresponding to recordings of mean and standard deviation of transit times in a rat (Stefanovic et al, 2008). Notice that venous outflow oxygen concentration is affected by the heterogeneity of capillary flows, in spite of identical total blood flows and number of open capillaries.CC BY-NC-ND · PubMed Central
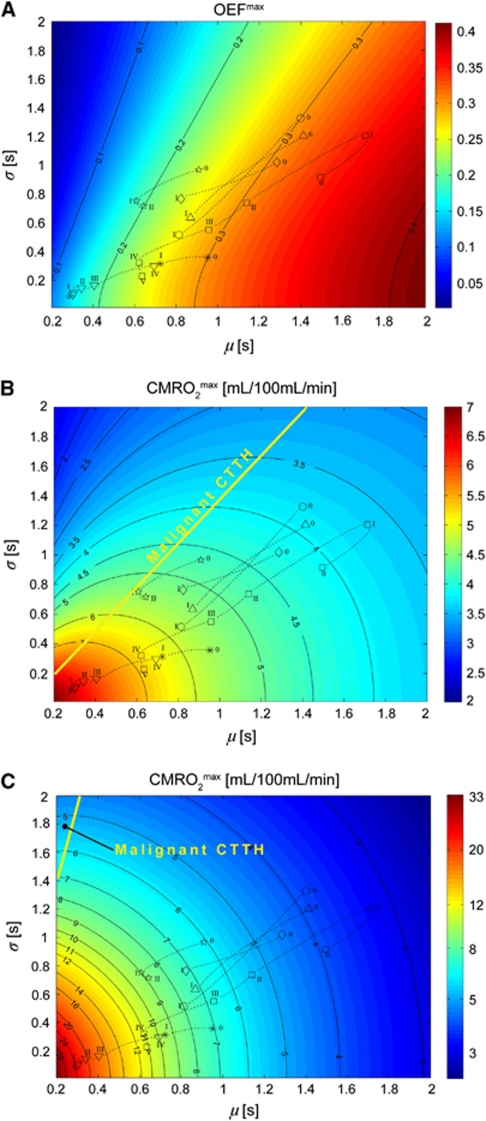
Figure 4 General model of the effects of transit time and capillary transit time heterogeneity (CTTH) on maximum oxygen extraction. Contour plot of maximum oxygen extraction fraction (OEFmax) (A) for a given mean transit time (μ) and capillary flow heterogeneity (σ). The corresponding maximum oxygen delivery is shown in (B) assuming fixed cerebral blood volume (CBV′)=1.6%, and Grubb's relation (Grubb et al, 1974) in (C). Resting state values were assumed to be cerebral blood flow (CBF)=60 mL/100 mL per minute and CaO2=19 mL/100 mL. Note that maximum oxygen delivery increases with decreasing flow heterogeneity. The yellow line in (B) separates states in which shorter transit times lead to decreased oxygen availability (dubbed malignant CTTH) from states where decreasing transit times lead to increased oxygen availability. Also shown are (μ,σ) values obtained in a range of physiological conditions—the symbols below refer to conditions listed in Table 1. The roman numeral accompanying each symbol allows identification of the corresponding physiological data in Table1. Symbols: ○=functional activation (Stefanovic et al, 2008); □=cortical electrical stimulation (Schulte et al, 2003); ▿=hypotension (Hudetz et al, 1995); ⋆=mild hypoxia (Hudetz et al, 1997); Δ=severe hypoxia (Krolo and Hudetz, 2000); ◊=mild hypocapnia (Villringer et al, 1994); *=severe hypercapnia (Hudetz et al, 1997).
Figure 4 General model of the effects of transit time and capillary transit time heterogeneity (CTTH) on maximum oxygen extraction. Contour plot of maximum oxygen extraction fraction (OEFmax) (A) for a given mean transit time (μ) and capillary flow heterogeneity (σ). The corresponding maximum oxygen delivery is shown in (B) assuming fixed cerebral blood volume (CBV′)=1.6%, and Grubb's relation (Grubb et al, 1974) in (C). Resting state values were assumed to be cerebral blood flow (CBF)=60 mL/100 mL per minute and CaO2=19 mL/100 mL. Note that maximum oxygen delivery increases with decreasing flow heterogeneity. The yellow line in (B) separates states in which shorter transit times lead to decreased oxygen availability (dubbed malignant CTTH) from states where decreasing transit times lead to increased oxygen availability. Also shown are (μ,σ) values obtained in a range of physiological conditions—the symbols below refer to conditions listed in Table 1. The roman numeral accompanying each symbol allows identification of the corresponding physiological data in Table1. Symbols: ○=functional activation (Stefanovic et al, 2008); □=cortical electrical stimulation (Schulte et al, 2003); ▿=hypotension (Hudetz et al, 1995); ⋆=mild hypoxia (Hudetz et al, 1997); Δ=severe hypoxia (Krolo and Hudetz, 2000); ◊=mild hypocapnia (Villringer et al, 1994); *=severe hypercapnia (Hudetz et al, 1997).CC BY-NC-ND · PubMed Central
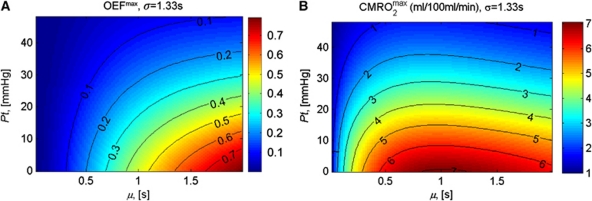
Figure 5 Maximum oxygen extraction fraction and maximum oxygen utilization for fixed CTTH. This figure illustrates the biophysical effects of reduced oxygen tension (as a result of tissue oxygen utilization) in the case of fixed CTTH (σ=1.33 seconds). A reduction in tissue oxygen tension can seemingly maintain high OEFmax (A) and thus CMRO2max, except toward short mean transit times (high CBF). Values as in Figure 4. CTTH, capillary transit time heterogeneity; OEFmax, maximum oxygen extraction fraction; CBF, cerebral blood flow; CMRO2max, maximum cerebral metabolic rate of oxygen.
Figure 5 Maximum oxygen extraction fraction and maximum oxygen utilization for fixed CTTH. This figure illustrates the biophysical effects of reduced oxygen tension (as a result of tissue oxygen utilization) in the case of fixed CTTH (σ=1.33 seconds). A reduction in tissue oxygen tension can seemingly maintain high OEFmax (A) and thus CMRO2max, except toward short mean transit times (high CBF). Values as in Figure 4. CTTH, capillary transit time heterogeneity; OEFmax, maximum oxygen extraction fraction; CBF, cerebral blood flow; CMRO2max, maximum cerebral metabolic rate of oxygen.CC BY-NC-ND · PubMed Central
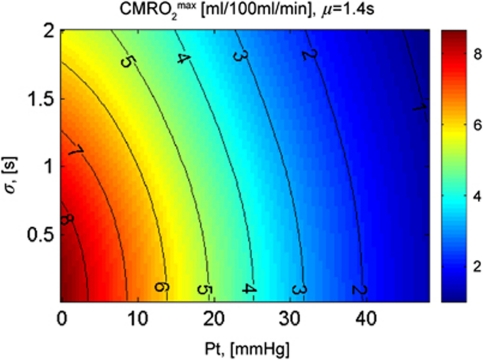
Figure 6 Net oxygen availability as a function of tissue oxygen tension and CTTH for fixed CBF. In this figure, CBF and CBV′ were kept constant (CBF=60 mL/100 mL per minute; CBV′=1.6% mean transit time μ=1.4 seconds) to illustrate how tissue oxygen tension and CTTH contribute to the metabolic needs of tissue during rest and as metabolic needs are increased with blocked CBF. Note that observed oxygen tension increases of 5% typically support CMRO2 increases of 25%. CTTH, capillary transit time heterogeneity; OEFmax, maximum oxygen extraction fraction; CBF, cerebral blood flow; CBV, cerebral blood volume; CMRO2, cerebral metabolic rate of oxygen.
Figure 6 Net oxygen availability as a function of tissue oxygen tension and CTTH for fixed CBF. In this figure, CBF and CBV′ were kept constant (CBF=60 mL/100 mL per minute; CBV′=1.6% mean transit time μ=1.4 seconds) to illustrate how tissue oxygen tension and CTTH contribute to the metabolic needs of tissue during rest and as metabolic needs are increased with blocked CBF. Note that observed oxygen tension increases of 5% typically support CMRO2 increases of 25%. CTTH, capillary transit time heterogeneity; OEFmax, maximum oxygen extraction fraction; CBF, cerebral blood flow; CBV, cerebral blood volume; CMRO2, cerebral metabolic rate of oxygen.CC BY-NC-ND · PubMed Central

Verification

Claims the paper makes

The claims and statistics of this paper haven’t been checked yet.

Run the check — free, no account needed. It reads the open-access text and checks the sources it cites.

A few free checks a day · papers already verified open instantly · results are public

Claims other papers make about this one

Each is checked against this paper’s own text: does it say what the citing paper says it does?

Self-check

Percentages, sums and reported differences re-computed from the paper’s own numbers.

The self-check needs the paper’s full text.

Citations

Cites

Show all 59 references

Research works printed but not linked: 7

  1. Buxton RB, 2010, Front Neuroenergetics, 2, 8
  2. Hudetz AG, 1995, Am J Physiol, 268, H2202
  3. Kuschinsky W, 1992, Cerebrovasc Brain Metab Rev, 4, 261
  4. Mouridsen K, Østergaard L, Christensen S, Jespersen SN (2011) Reliable estimation of capillary transit time distributions at voxel-level using DSC-MRI. In: Proceedings of the International Society for Magnetic Resonance in Medicines 19th Annual Meeting and Exhibition: 3915.
  5. Pries AR, 1995, Am J Physiol, 269, H1713
  6. Pries AR, 1996, Am J Physiol, 270, H545
  7. Vogel J, 1996, Am J Physiol, 270, H1441

Cited by

See all 504

Metadata

Authors
Jespersen, S. N., & Østergaard, L.
Affiliations
Center of Functionally Integrative Neuroscience and MINDLab, NeuroCampus Aarhus, Aarhus University, Aarhus C, Denmark
Venue
Journal of Cerebral Blood Flow & Metabolism
Published
2011-11-02
Volume
32
Issue
2
Pages
264-277
ISSN
  • 0271-678X
  • 1559-7016
Cited by
504
References
59
Language
en
Licence
journals.sagepub.com/page/policies/text-and-data-mining-license (tdm)

About these checks

Registry, retraction, Cites and statistics results are computed, not judged, with one exception: a printed reference that no index lists is read once by a model before it counts as a citation error. Claims are extracted by a model and kept only when their quote appears verbatim in the text; each cited source is then checked, with a model’s help, for whether it says what the claim relies on. Those verdicts can be wrong — read the claim’s quote and the cited source before relying on one.

Statistics and arithmetic are recomputed, not judged.

Confidence bands are shown only for fields calibrated on our annotated test set. None is calibrated yet, so no band is shown.

What counts as a claim ›How we measure confidence ›How we check this ›

Are you an author, or do you see a problem with this page? Request a review

How to cite

Cite CoChat for the checks on this page, and the paper for its own findings.

This page
CoChat. (2026). Citation check: The Roles of Cerebral Blood Flow, Capillary Transit Time Heterogeneity, and Oxygen Tension in Brain Oxygenation and Metabolism. https://app.cochat.ai/papers/10.1038/jcbfm.2011.153
The paper
Jespersen, S. N., & Østergaard, L. (2012). The Roles of Cerebral Blood Flow, Capillary Transit Time Heterogeneity, and Oxygen Tension in Brain Oxygenation and Metabolism. Journal of Cerebral Blood Flow & Metabolism. https://doi.org/10.1038/jcbfm.2011.153

Data sources

Bibliographic data: Semantic Scholar, OpenAlex, Crossref.

Contains information from the Semantic Scholar Academic Graph Datasets, made available under the ODC Attribution License (ODC-BY 1.0).

Semantic Scholar’s data is described in: Kinney, R., et al. (2023). The Semantic Scholar Open Data Platform. arXiv:2301.10140.