Cited by 194

The DOI matches its Crossref record; 10 of the 10 references it cites were found in a registry or an index.

Cancer-associated ASXL1 mutations may act as gain-of-function mutations of the ASXL1–BAP1 complex

Balasubramani, Anand, Larjo, Antti, Bassein, Jed A., Chang, Xing, Hastie, Ryan B., Togher, Susan M., Lähdesmäki, Harri, Rao, Anjana·2015·Nature Communications

Abstract

ASXL1 is the obligate regulatory subunit of a deubiquitinase complex whose catalytic subunit is BAP1. Heterozygous mutations of ASXL1 that result in premature truncations are frequent in myeloid leukemias and Bohring–Opitz syndrome. Here we demonstrate that ASXL1 truncations confer enhanced activity on the ASXL1–BAP1 complex. Stable expression of truncated, hyperactive ASXL1–BAP1 complexes in a haematopoietic precursor cell line results in global erasure of H2AK119Ub, striking depletion of H3K27me3, selective upregulation of a subset of genes whose promoters are marked by both H2AK119Ub and H3K4me3, and spontaneous differentiation to the mast cell lineage. These outcomes require the catalytic activity of BAP1, indicating that they are downstream consequences of H2AK119Ub erasure. In bone marrow precursors, expression of truncated ASXL1–BAP1 complex cooperates with TET2 loss-of-function to increase differentiation to the myeloid lineage in vivo . Our data raise the possibility that ASXL1 truncation mutations confer gain-of-function on the ASXL–BAP1 complex.

Overview

The claims and statistics of this paper haven’t been checked yet.

Run the check — free, no account needed. It reads the open-access text and checks the sources it cites.

A few free checks a day · papers already verified open instantly · results are public

Integrity signals

Registry

Crossref · 10.1038/ncomms8307

Cites

10 of 10 references verified0 citation errors · 0 not checkable

Statistics

Figures

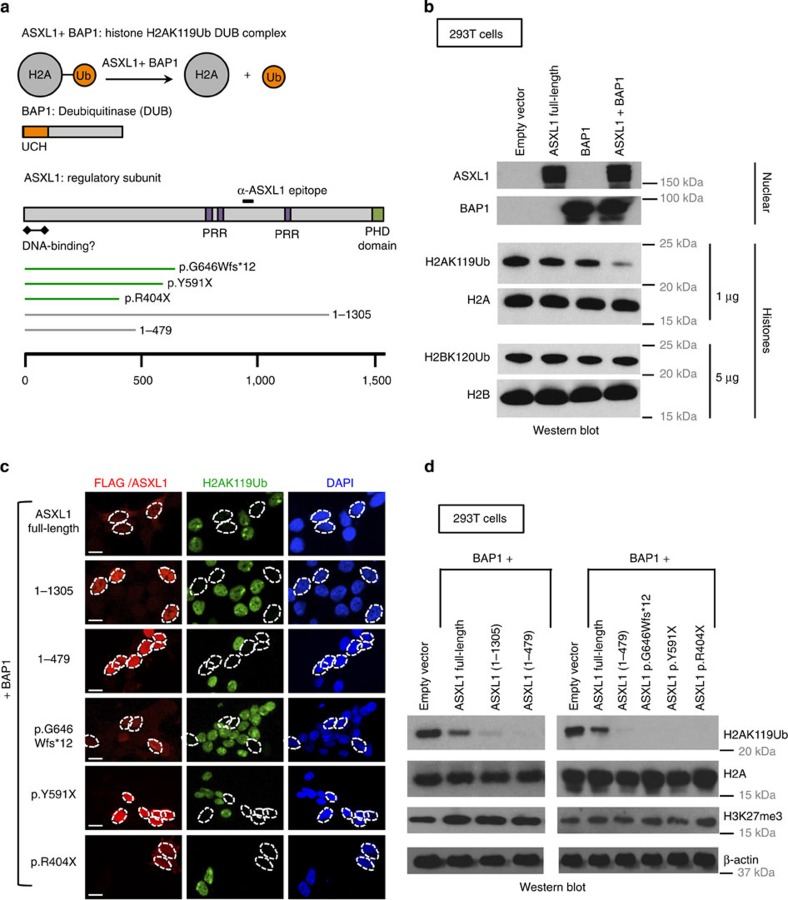
Figure 1 Leukemia-associated ASXL1 truncation mutations cooperate with BAP1 to promote deubiquitination of H2AK119Ub. (a) ASXL1 interacts with BAP1 to form a deubiquitinase complex that acts on H2AK119Ub. ASXL1 is the regulatory subunit of this complex and BAP1 is the deubiquitinase. The ubiquitin-carboxyl hydrolase (UCH) domain of BAP1 is at its N terminus. ASXL1 has a C-terminal atypical PHD Zinc-finger, a putative N-terminal DNA-binding domain and three PRRs that are thought to facilitate protein–protein interactions. Shown below are three cancer-associated ASXL1 mutations and two ASXL1 truncations, ASXL1(1–1305), and ASXL1(1–479), which we have employed in our studies. (b) 293T cells were mock transfected or transfected with mammalian expression vectors encoding BAP1, full-length ASXL1, or both. Expression of ASXL1 and BAP1 was confirmed by western blotting carried out on nuclear lysates. Acid-extracted histones were probed with antibodies against the indicated proteins and histone modifications. As shown, co-transfection of ASXL1+BAP1 results in marked reduction in levels of H2AK119Ub but not H2BK120Ub. (c,d) HEK293T cells were co-transfected with mammalian expression vectors encoding BAP1 with full-length ASXL1 or ASXL1 truncations/mutations as indicated. Western blottings to examine expression of ASXL1 and ASXL1 mutations are shown in Supplementary Fig. 1c. (c) Cells were fixed 48 h post transfection, permeabilized and stained with anti-ASXL1 (red) or anti-FLAG (red) and anti-H2AK119Ub (green) antibodies. Scale bar, 10 μm. (d) Nuclear lysates and acid-extracted histones prepared from transfected cells were subjected to western blotting.
Figure 1 Leukemia-associated ASXL1 truncation mutations cooperate with BAP1 to promote deubiquitination of H2AK119Ub. (a) ASXL1 interacts with BAP1 to form a deubiquitinase complex that acts on H2AK119Ub. ASXL1 is the regulatory subunit of this complex and BAP1 is the deubiquitinase. The ubiquitin-carboxyl hydrolase (UCH) domain of BAP1 is at its N terminus. ASXL1 has a C-terminal atypical PHD Zinc-finger, a putative N-terminal DNA-binding domain and three PRRs that are thought to facilitate protein–protein interactions. Shown below are three cancer-associated ASXL1 mutations and two ASXL1 truncations, ASXL1(1–1305), and ASXL1(1–479), which we have employed in our studies. (b) 293T cells were mock transfected or transfected with mammalian expression vectors encoding BAP1, full-length ASXL1, or both. Expression of ASXL1 and BAP1 was confirmed by western blotting carried out on nuclear lysates. Acid-extracted histones were probed with antibodies against the indicated proteins and histone modifications. As shown, co-transfection of ASXL1+BAP1 results in marked reduction in levels of H2AK119Ub but not H2BK120Ub. (c,d) HEK293T cells were co-transfected with mammalian expression vectors encoding BAP1 with full-length ASXL1 or ASXL1 truncations/mutations as indicated. Western blottings to examine expression of ASXL1 and ASXL1 mutations are shown in Supplementary Fig. 1c. (c) Cells were fixed 48 h post transfection, permeabilized and stained with anti-ASXL1 (red) or anti-FLAG (red) and anti-H2AK119Ub (green) antibodies. Scale bar, 10 μm. (d) Nuclear lysates and acid-extracted histones prepared from transfected cells were subjected to western blotting.CC BY · PubMed Central
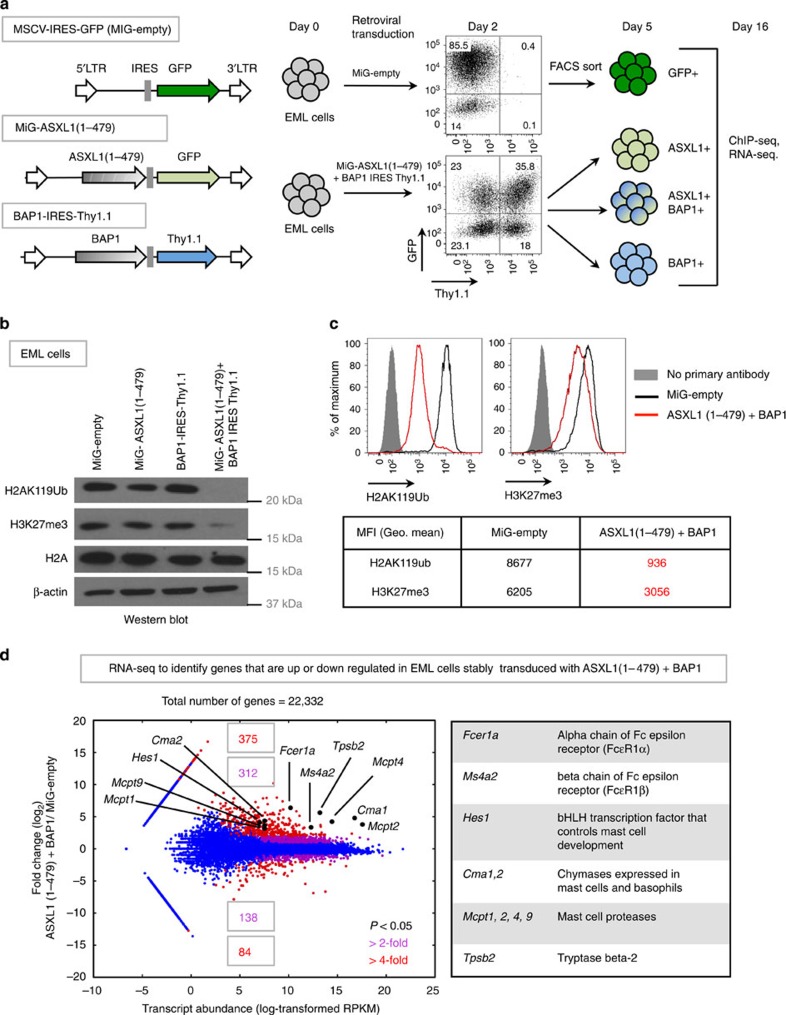
Figure 2 Ectopic expression of ASXL1 truncations+BAP1 results in stable depletion of H2AK119Ub in the EML haematopoietic cell line. (a) Using retroviral constructs, we generated EML cell lines that stably express ASXL1(1–479), BAP1, or both. A schematic representation of the retroviral constructs is shown to the left. Based on expression of retroviral reporters, green fluorescent protein (GFP) and Thy1.1, EML cells that express either ASXL1(1–479), BAP1, or both were purified by fluorescence-activated cell sorting (FACS). (b,c) EML cells were transduced with the indicated viral constructs, FACS sorted and expanded for 16 days in liquid culture in media supplemented with 100 ng ml−1 SCF. (b) On day 16, nuclear lysates and acid-extracted histones prepared from these cells were subjected to western blotting with indicated antibodies. (c) On day 16, cells were subjected to intracellular staining with anti-H2AK119Ub and anti-H3K27me3 antibodies, and levels of H2AK119Ub and H3K27me3 were determined by flow cytometry. Geometric mean fluorescence intensities (gMFI) of H2AK119Ub and H3K27me3 stains were determined by subtracting gMFIs of no primary antibody controls from the absolute gMFIs. (d) EML cells transduced with either MiG-empty or ASXL1(1–479)+BAP1 were purified by FACS and expanded for 16 days in liquid culture. On day 16, total RNA was isolated, ribosome-depleted and subjected to RNA-seq. Differential expression and statistical significance were determined using DESeq. Highlighted in the plot and the table are genes that are normally expressed in the mast cell lineage that are upregulated in ASXL1(1–479)+BAP1-transduced EML cells.
Figure 2 Ectopic expression of ASXL1 truncations+BAP1 results in stable depletion of H2AK119Ub in the EML haematopoietic cell line. (a) Using retroviral constructs, we generated EML cell lines that stably express ASXL1(1–479), BAP1, or both. A schematic representation of the retroviral constructs is shown to the left. Based on expression of retroviral reporters, green fluorescent protein (GFP) and Thy1.1, EML cells that express either ASXL1(1–479), BAP1, or both were purified by fluorescence-activated cell sorting (FACS). (b,c) EML cells were transduced with the indicated viral constructs, FACS sorted and expanded for 16 days in liquid culture in media supplemented with 100 ng ml−1 SCF. (b) On day 16, nuclear lysates and acid-extracted histones prepared from these cells were subjected to western blotting with indicated antibodies. (c) On day 16, cells were subjected to intracellular staining with anti-H2AK119Ub and anti-H3K27me3 antibodies, and levels of H2AK119Ub and H3K27me3 were determined by flow cytometry. Geometric mean fluorescence intensities (gMFI) of H2AK119Ub and H3K27me3 stains were determined by subtracting gMFIs of no primary antibody controls from the absolute gMFIs. (d) EML cells transduced with either MiG-empty or ASXL1(1–479)+BAP1 were purified by FACS and expanded for 16 days in liquid culture. On day 16, total RNA was isolated, ribosome-depleted and subjected to RNA-seq. Differential expression and statistical significance were determined using DESeq. Highlighted in the plot and the table are genes that are normally expressed in the mast cell lineage that are upregulated in ASXL1(1–479)+BAP1-transduced EML cells.CC BY · PubMed Central
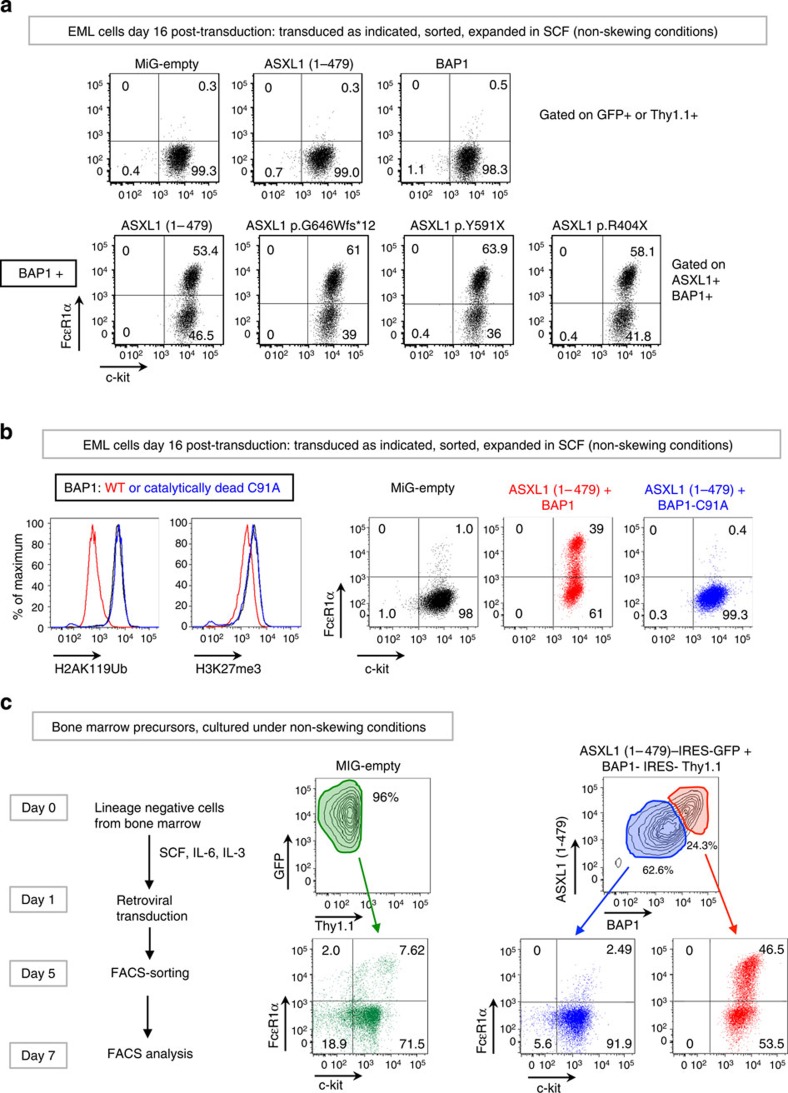
Figure 3 Co-expression of ASXL1 truncation mutations+BAP1 skews EML and haematopoietic precursor cells to the mast cell lineage. (a) EML cells were transduced with retroviral constructs as indicated. Cells were sorted based on expression of green fluorescent protein (GFP) and/or Thy1.1, and expanded in media supplemented with 100 ng ml−1 SCF for 16 days post transduction. Commitment to the mast cell lineage was assessed by staining with fluorochrome-conjugated antibodies against c-kit and FcɛR1α. (b) EML cells were transduced with retroviral constructs and sorted and expanded as in a. In the panels to the left, levels of H2AK119Ub and H3K27me3 were assessed by flow cytometry. Additional controls are shown in Supplementary Fig. 3b. In the panels to the right, commitment to the mast cell lineage was assessed as in a. (c) Lineage-negative, c-Kit+ (LK) cells isolated from mouse bone marrow (see Supplementary Fig.3c) were transduced and sorted as indicated and expanded in media containing 50 ng ml−1 SCF, 10 ng ml−1 IL-6 and 10 ng ml−1 IL-3 (non-skewing conditions). Commitment to the mast cell lineage was assessed on day 7 by staining with fluorochrome-conjugated antibodies against c-Kit and FcɛR1α.
Figure 3 Co-expression of ASXL1 truncation mutations+BAP1 skews EML and haematopoietic precursor cells to the mast cell lineage. (a) EML cells were transduced with retroviral constructs as indicated. Cells were sorted based on expression of green fluorescent protein (GFP) and/or Thy1.1, and expanded in media supplemented with 100 ng ml−1 SCF for 16 days post transduction. Commitment to the mast cell lineage was assessed by staining with fluorochrome-conjugated antibodies against c-kit and FcɛR1α. (b) EML cells were transduced with retroviral constructs and sorted and expanded as in a. In the panels to the left, levels of H2AK119Ub and H3K27me3 were assessed by flow cytometry. Additional controls are shown in Supplementary Fig. 3b. In the panels to the right, commitment to the mast cell lineage was assessed as in a. (c) Lineage-negative, c-Kit+ (LK) cells isolated from mouse bone marrow (see Supplementary Fig.3c) were transduced and sorted as indicated and expanded in media containing 50 ng ml−1 SCF, 10 ng ml−1 IL-6 and 10 ng ml−1 IL-3 (non-skewing conditions). Commitment to the mast cell lineage was assessed on day 7 by staining with fluorochrome-conjugated antibodies against c-Kit and FcɛR1α.CC BY · PubMed Central
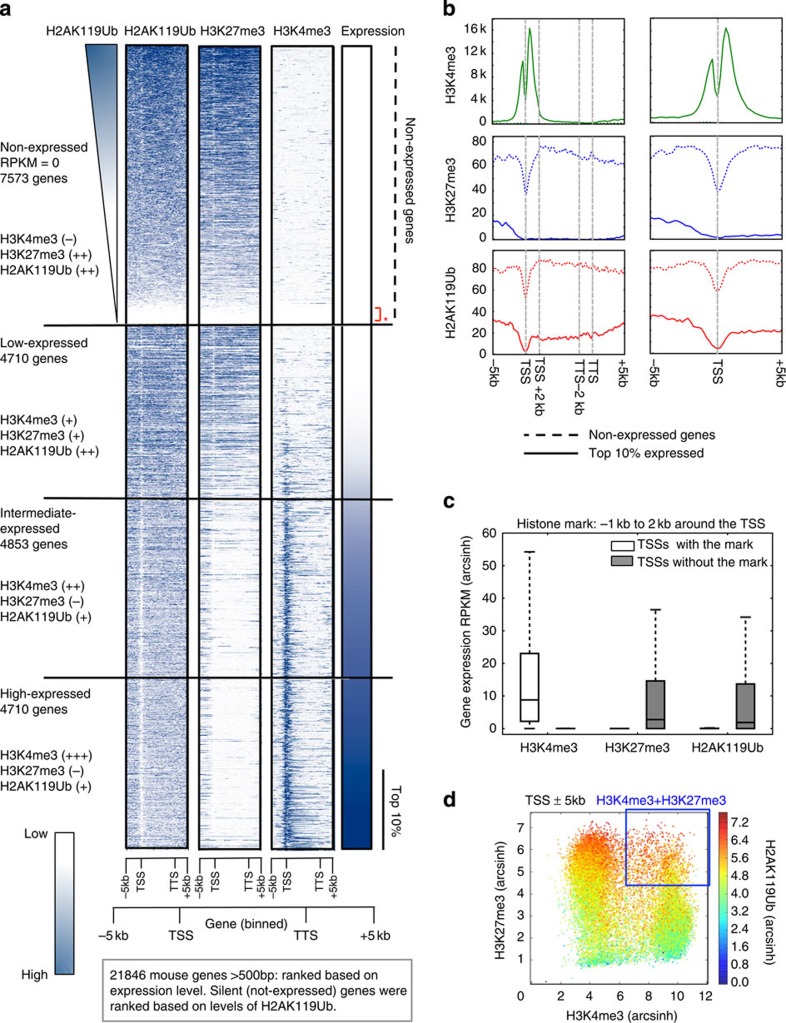
Figure 4 H2AK119Ub marks are present at the expressed and non-expressed genes in EML cells. Mononucleosomes prepared from EML cells transduced with MiG-empty retrovirus were immunoprecipitated with H2AK119Ub, H3K27me3 and H3K4me3 antibodies, and subjected to ChIP-seq. (a) Genes were ranked based on levels of expression. Shown alongside is the genome-wide distribution of H2AK119Ub, H3K27me3 and H3K4me3 marks across the gene body and ±5 kb around the gene body of all genes >500 bp in length. Based on expression levels in EML cells, we categorized genes into four categories: non-expressed, low, intermediate and high expressed. Non-expressed genes were ranked based on levels of H2AK119Ub. Areas around TSS (−5 kbp, 0 bp) and around TTS (0 bp, +5k bp) were both divided into twenty-five 200-bp bins. Gene bodies were divided into 50 bins of equal width. Genes <500 bp were excluded due to visualization artefacts caused by gene binning. (b) Average input-corrected levels of H2AK119Ub, H3K4me3 and H3K27me3 marks across non-expressed genes and top 10% of genes sorted by expression are represented in two formats, across gene body and ±5 kb around the gene (left) and ±5 kb around TSSs (right). (c) Presence of H2AK119Ub, H3K27me3 and H3K4me3 marks was defined based on ≥10% overlap between SICER peak calls and the area −1 kb to +2 kb around the TSSs. RPKM (reads per kilobase per million) values of genes marked by or lacking the said mark are represented as a box showing the 25th, 50th and 75th percentiles, and whiskers extending to 1.5 times interquartile range. (d) To determine the overlaps between TSSs marked by the H2AK119Ub, H3K4me3 and H3K27me3, enrichments of H3K4me3, H2AK119Ub and H3K27me3 were calculated with respect to input signal in 200 bp bins ±5 kb around each TSS. Total enrichment for each TSS was determined by summing the enrichment values of the ±5 kb area; H2AK119Ub enrichement was colour coded as indicated on the right.
Figure 4 H2AK119Ub marks are present at the expressed and non-expressed genes in EML cells. Mononucleosomes prepared from EML cells transduced with MiG-empty retrovirus were immunoprecipitated with H2AK119Ub, H3K27me3 and H3K4me3 antibodies, and subjected to ChIP-seq. (a) Genes were ranked based on levels of expression. Shown alongside is the genome-wide distribution of H2AK119Ub, H3K27me3 and H3K4me3 marks across the gene body and ±5 kb around the gene body of all genes >500 bp in length. Based on expression levels in EML cells, we categorized genes into four categories: non-expressed, low, intermediate and high expressed. Non-expressed genes were ranked based on levels of H2AK119Ub. Areas around TSS (−5 kbp, 0 bp) and around TTS (0 bp, +5k bp) were both divided into twenty-five 200-bp bins. Gene bodies were divided into 50 bins of equal width. Genes <500 bp were excluded due to visualization artefacts caused by gene binning. (b) Average input-corrected levels of H2AK119Ub, H3K4me3 and H3K27me3 marks across non-expressed genes and top 10% of genes sorted by expression are represented in two formats, across gene body and ±5 kb around the gene (left) and ±5 kb around TSSs (right). (c) Presence of H2AK119Ub, H3K27me3 and H3K4me3 marks was defined based on ≥10% overlap between SICER peak calls and the area −1 kb to +2 kb around the TSSs. RPKM (reads per kilobase per million) values of genes marked by or lacking the said mark are represented as a box showing the 25th, 50th and 75th percentiles, and whiskers extending to 1.5 times interquartile range. (d) To determine the overlaps between TSSs marked by the H2AK119Ub, H3K4me3 and H3K27me3, enrichments of H3K4me3, H2AK119Ub and H3K27me3 were calculated with respect to input signal in 200 bp bins ±5 kb around each TSS. Total enrichment for each TSS was determined by summing the enrichment values of the ±5 kb area; H2AK119Ub enrichement was colour coded as indicated on the right.CC BY · PubMed Central
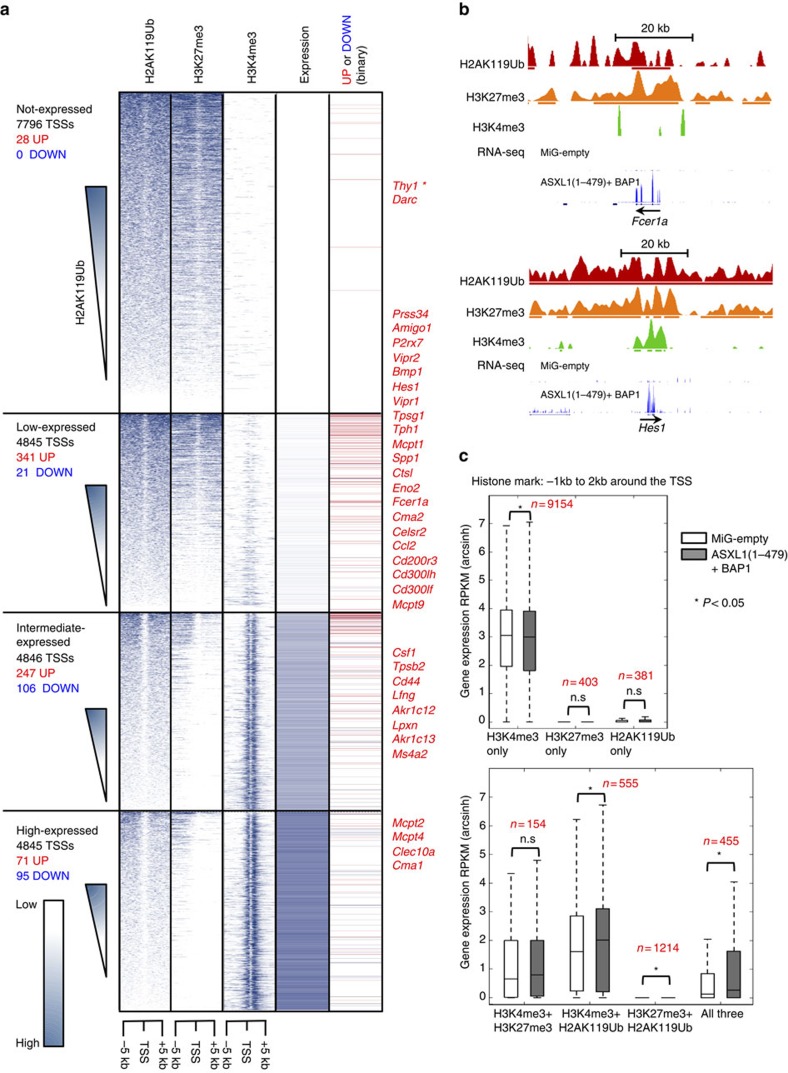
Figure 5 Expression of ASXL1(1–479)+BAP1 leads to upregulation of low-expressed and intermediate-expressed genes. (a) Input-corrected distribution of H2AK119Ub, H3K4me3 and H3K27me3 marks ±5 kb around mouse TSSs divided into fifty 200-bp bins is shown alongside gene expression levels in EML cells transduced with MiG-empty. Genes within each sub-class were arranged in descending order of H2AK119Ub levels. In the column to the far right is a binary representation of change in expression at these gene loci on transduction with ASXL1(1–479)+BAP1; genes upregulated or downregulated >2-fold, (P<0.05, as determined by DESeq) are represented with red and blue lines, respectively. *Thy1 is marked with an asterisk to highlight the fact that BAP1-expressing retrovirus carried Thy1.1 (a variant of Thy1) as the reporter. Names of some upregulated genes (including mast cell-associated genes) are indicated to the right. (b) UCSC browser tracks of H2AK119Ub, H3K27me3 and H3K4me3 marks from MiG-empty-transduced EML cells and RNA-seq tracks from both MiG-empty- and ASXL1(1–479)+BAP1-transduced cells of two mast cell genes Fcer1a and Hes1. The bold lines below the profiles of histone marks represent SICER peak calls. Scale bar, 20 kb. (c) The presence of H2AK119Ub, H3K27me3 and H3K4me3 marks in MiG-empty-transduced EML cells −1 to +2 kb around each TSS was determined based on 10% or greater overlap between SICER peak calls. Mean and range of RPKM (arcsinh-transformed) values of genes marked by combinations of histone marks are represented as box and whisker plots as in c. Statistical significance was determined by two-tailed Mann–Whitney U-test (*P<0.05).
Figure 5 Expression of ASXL1(1–479)+BAP1 leads to upregulation of low-expressed and intermediate-expressed genes. (a) Input-corrected distribution of H2AK119Ub, H3K4me3 and H3K27me3 marks ±5 kb around mouse TSSs divided into fifty 200-bp bins is shown alongside gene expression levels in EML cells transduced with MiG-empty. Genes within each sub-class were arranged in descending order of H2AK119Ub levels. In the column to the far right is a binary representation of change in expression at these gene loci on transduction with ASXL1(1–479)+BAP1; genes upregulated or downregulated >2-fold, (P<0.05, as determined by DESeq) are represented with red and blue lines, respectively. *Thy1 is marked with an asterisk to highlight the fact that BAP1-expressing retrovirus carried Thy1.1 (a variant of Thy1) as the reporter. Names of some upregulated genes (including mast cell-associated genes) are indicated to the right. (b) UCSC browser tracks of H2AK119Ub, H3K27me3 and H3K4me3 marks from MiG-empty-transduced EML cells and RNA-seq tracks from both MiG-empty- and ASXL1(1–479)+BAP1-transduced cells of two mast cell genes Fcer1a and Hes1. The bold lines below the profiles of histone marks represent SICER peak calls. Scale bar, 20 kb. (c) The presence of H2AK119Ub, H3K27me3 and H3K4me3 marks in MiG-empty-transduced EML cells −1 to +2 kb around each TSS was determined based on 10% or greater overlap between SICER peak calls. Mean and range of RPKM (arcsinh-transformed) values of genes marked by combinations of histone marks are represented as box and whisker plots as in c. Statistical significance was determined by two-tailed Mann–Whitney U-test (*P<0.05).CC BY · PubMed Central
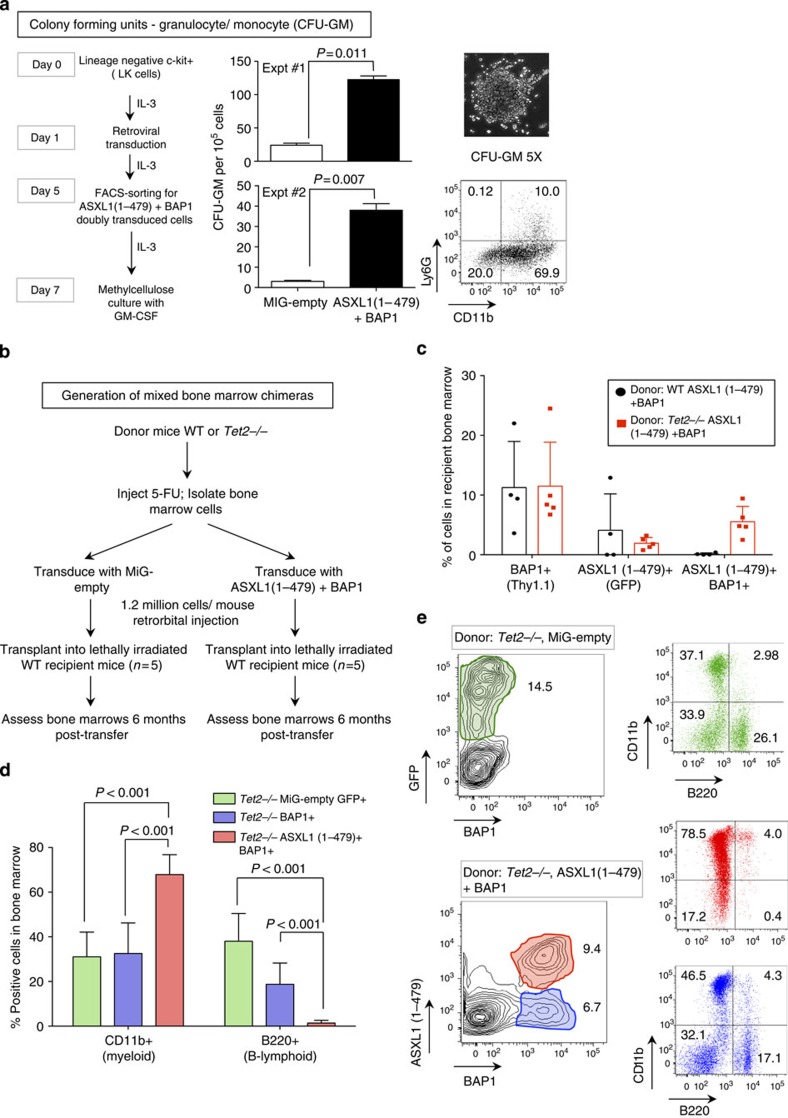
Figure 6 ASXL1 truncations synergize with BAP1 and TET2 loss-of-function to skew commitment to the myeloid lineage in vivo. (a) Lineage-negative, c-Kit+ (LK) cells isolated from mouse bone marrow and transduced with either MiG-empty or ASXL1(1–479)+BAP1. Transduced cells were expanded in media supplemented with 10 ng ml−1 IL-3, fluorescence-activated cell sorted (FACS) for Thy1.1 and green fluorescent protein (GFP) expression on day 5, and expanded in liquid medium supplemented with 10 ng ml−1 IL-3 till day 7. On day 7, the cells were washed extensively to remove traces of IL-3. Cells (105) were plated in triplicate in 35-mm dishes in methylcellulose medium supplemented with 10 ng ml−1 GM-CSF. Numbers of CFU-GM were counted on day 14. Statistical significance was determined by two-tailed t-test. Representative image and FACS profile of a CFU-GM are shown to the right. (b) 5-FU-treated bone marrow cells were harvested from WT and TET2-deficient donor mice as described in Methods. The donor cells were transduced as indicated 24 h post transduction; 1.2 × 10⁶ cells were transplanted into irradiated recipient mice by intravenous injection. (c) The bone marrow was harvested from recipient mice 6 months post transfer. Transduced cells were identified based on expression of GFP and Thy1.1 reporters. Shown are percentages of BAP1, ASXL1(1–479) and doubly transduced cells in the bone marrows of recipient mice 6 months post transfer. Each dot represents one mouse. (d) Percentages of CD11b (myeloid)- and B220 (B-lymphoid)-positive cells that were transduced with MiG-empty, BAP1 alone or ASXL1(1–479)+BAP1 retroviruses were determined by flow cytometry. Data shown are from recipients that received cells from TET2-deficient donors; percentages represent mean±s.d. from five recipients. Statistical significance was determined by two-tailed t-test; n=5. (e) Representative FACS plots of CD11b- and B220-positive cells in the bone marrow of recipient mice that were transplanted with Tet2−/− bone marrow cells 6 months post transfer.
Figure 6 ASXL1 truncations synergize with BAP1 and TET2 loss-of-function to skew commitment to the myeloid lineage in vivo. (a) Lineage-negative, c-Kit+ (LK) cells isolated from mouse bone marrow and transduced with either MiG-empty or ASXL1(1–479)+BAP1. Transduced cells were expanded in media supplemented with 10 ng ml−1 IL-3, fluorescence-activated cell sorted (FACS) for Thy1.1 and green fluorescent protein (GFP) expression on day 5, and expanded in liquid medium supplemented with 10 ng ml−1 IL-3 till day 7. On day 7, the cells were washed extensively to remove traces of IL-3. Cells (105) were plated in triplicate in 35-mm dishes in methylcellulose medium supplemented with 10 ng ml−1 GM-CSF. Numbers of CFU-GM were counted on day 14. Statistical significance was determined by two-tailed t-test. Representative image and FACS profile of a CFU-GM are shown to the right. (b) 5-FU-treated bone marrow cells were harvested from WT and TET2-deficient donor mice as described in Methods. The donor cells were transduced as indicated 24 h post transduction; 1.2 × 10⁶ cells were transplanted into irradiated recipient mice by intravenous injection. (c) The bone marrow was harvested from recipient mice 6 months post transfer. Transduced cells were identified based on expression of GFP and Thy1.1 reporters. Shown are percentages of BAP1, ASXL1(1–479) and doubly transduced cells in the bone marrows of recipient mice 6 months post transfer. Each dot represents one mouse. (d) Percentages of CD11b (myeloid)- and B220 (B-lymphoid)-positive cells that were transduced with MiG-empty, BAP1 alone or ASXL1(1–479)+BAP1 retroviruses were determined by flow cytometry. Data shown are from recipients that received cells from TET2-deficient donors; percentages represent mean±s.d. from five recipients. Statistical significance was determined by two-tailed t-test; n=5. (e) Representative FACS plots of CD11b- and B220-positive cells in the bone marrow of recipient mice that were transplanted with Tet2−/− bone marrow cells 6 months post transfer.CC BY · PubMed Central

Verification

Claims the paper makes

The claims and statistics of this paper haven’t been checked yet.

Run the check — free, no account needed. It reads the open-access text and checks the sources it cites.

A few free checks a day · papers already verified open instantly · results are public

Claims other papers make about this one

Each is checked against this paper’s own text: does it say what the citing paper says it does?

Self-check

Percentages, sums and reported differences re-computed from the paper’s own numbers.

The self-check needs the paper’s full text.

Citations

Cites

Show all 10 references

Research works printed but not linked: 54

  1. Jurgens, G. A group of genes controlling expression of the bithorax complex. Nature 316, 1985 (1985). · DOI
  2. Wang, H. et al. Role of histone H2A ubiquitination in Polycomb silencing. Nature 431, 873–878 (2004). · DOI · Paper page
  3. Kuzmichev, A., Nishioka, K., Erdjument-Bromage, H., Tempst, P. & Reinberg, D. Histone methyltransferase activity associated with a human multiprotein complex containing the Enhancer of Zeste protein. Genes Dev. 16, 2893–2905 (2002). · DOI · Paper page
  4. Muller, J. et al. Histone methyltransferase activity of a Drosophila Polycomb group repressor complex. Cell 111, 197–208 (2002). · DOI
  5. Czermin, B. et al. Drosophila enhancer of Zeste/ESC complexes have a histone H3 methyltransferase activity that marks chromosomal Polycomb sites. Cell 111, 185–196 (2002). · DOI
  6. Bracken, A. P. & Helin, K. Polycomb group proteins: navigators of lineage pathways led astray in cancer. Nat. Rev. Cancer 9, 773–784 (2009). · DOI · Paper page
  7. Levine, S. S. et al. The core of the polycomb repressive complex is compositionally and functionally conserved in flies and humans. Mol. Cell. Biol. 22, 6070–6078 (2002). · DOI
  8. Schoeftner, S. et al. Recruitment of PRC1 function at the initiation of X inactivation independent of PRC2 and silencing. EMBO J. 25, 3110–3122 (2006). · DOI
  9. Tavares, L. et al. RYBP-PRC1 complexes mediate H2A ubiquitylation at polycomb target sites independently of PRC2 and H3K27me3. Cell 148, 664–678 (2012). · DOI
  10. Gao, Z. et al. PCGF homologs, CBX proteins, and RYBP define functionally distinct PRC1 family complexes. Mol. Cell 45, 344–356 (2012). · DOI
  11. Blackledge, N. P. et al. Variant PRC1 complex-dependent H2A ubiquitylation drives PRC2 recruitment and Polycomb domain formation. Cell 157, 1445–1459 (2014). · DOI
  12. Kalb, R. et al. Histone H2A monoubiquitination promotes histone H3 methylation in Polycomb repression. Nat. Struct. Mol. Biol. 21, 569–571 (2014). · DOI
  13. Scheuermann, J. C. et al. Histone H2A deubiquitinase activity of the Polycomb repressive complex PR-DUB. Nature 465, 243–247 (2010). · DOI · Paper page
  14. Katoh, M. Functional and cancer genomics of ASXL family members. Br. J. Cancer 109, 299–306 (2013). · DOI
  15. Aumann, S. & Abdel-Wahab, O. Somatic alterations and dysregulation of epigenetic modifiers in cancers. Biochem. Biophys. Res. Commun. 455, 24–34 (2014). · DOI
  16. Huang, Y. & Rao, A. Connections between TET proteins and aberrant DNA modification in cancer. Trends Genet. 30, 464–474 (2014). · DOI
  17. Dey, A. et al. Loss of the tumor suppressor BAP1 causes myeloid transformation. Science 337, 1541–1546 (2012). · DOI
  18. Huether, R. et al. The landscape of somatic mutations in epigenetic regulators across 1,000 paediatric cancer genomes. Nat. Commun. 5, 3630 (2014). · DOI
  19. Hoischen, A. et al. De novo nonsense mutations in ASXL1 cause Bohring-Opitz syndrome. Nat. Genet. 43, 729–731 (2011). · DOI
  20. Magini, P. et al. Two novel patients with Bohring-Opitz syndrome caused by de novo ASXL1 mutations. Am. J. Med. Genet. A 158A, 917–921 (2012). · DOI
  21. Bainbridge, M. N. et al. De novo truncating mutations in ASXL3 are associated with a novel clinical phenotype with similarities to Bohring-Opitz syndrome. Genome Med. 5, 11 (2013). · DOI
  22. Cimmino, L., Abdel-Wahab, O., Levine, R. L. & Aifantis, I. TET family proteins and their role in stem cell differentiation and transformation. Cell Stem Cell 9, 193–204 (2011). · DOI
  23. Ko, M. & Rao, A. TET2: epigenetic safeguard for HSC. Blood 118, 4501–4503 (2011). · DOI
  24. Abdel-Wahab, O. et al. ASXL1 mutations promote myeloid transformation through loss of PRC2-mediated gene repression. Cancer Cell 22, 180–193 (2012). · DOI
  25. Inoue, D. et al. Myelodysplastic syndromes are induced by histone methylation-altering ASXL1 mutations. J. Clin. Invest. 123, 4627–4640 (2013). · DOI
  26. Aravind, L. & Iyer, L. M. The HARE-HTH and associated domains: novel modules in the coordination of epigenetic DNA and protein modifications. Cell Cycle 11, 119–131 (2012). · DOI
  27. Sanchez-Pulido, L., Kong, L. & Ponting, C. P. A common ancestry for BAP1 and Uch37 regulators. Bioinformatics 28, 1953–1956 (2012). · DOI
  28. Harbour, J. W. et al. Frequent mutation of BAP1 in metastasizing uveal melanomas. Science 330, 1410–1413 (2010). · DOI
  29. Testa, J. R. et al. Germline BAP1 mutations predispose to malignant mesothelioma. Nat. Genet. 43, 1022–1025 (2011). · DOI · Paper page
  30. Forbes, S. A. et al. COSMIC: mining complete cancer genomes in the catalogue of somatic mutations in cancer. Nucleic Acids Res. 39, D945–D950 (2011). · DOI · Paper page
  31. Farcas, A. M. et al. KDM2B links the Polycomb repressive complex 1 (PRC1) to recognition of CpG islands. eLife 1, e00205 (2012). · DOI
  32. Tsai, S., Bartelmez, S., Sitnicka, E. & Collins, S. Lymphohematopoietic progenitors immortalized by a retroviral vector harboring a dominant-negative retinoic acid receptor can recapitulate lymphoid, myeloid, and erythroid development. Genes Dev. 8, 2831–2841 (1994). · DOI
  33. Sakata-Yanagimoto, M. et al. Coordinated regulation of transcription factors through Notch2 is an important mediator of mast cell fate. Proc. Natl Acad. Sci. USA 105, 7839–7844 (2008). · DOI
  34. Kallin, E. M. et al. Genome-wide uH2A localization analysis highlights Bmi1-dependent deposition of the mark at repressed genes. PLoS Genet. 5, e1000506 (2009). · DOI
  35. Endoh, M. et al. Histone H2A mono-ubiquitination is a crucial step to mediate PRC1-dependent repression of developmental genes to maintain ES cell identity. PLoS Genet. 8, e1002774 (2012). · DOI
  36. Scheuermann, J. C., Gutierrez, L. & Muller, J. Histone H2A monoubiquitination and Polycomb repression: the missing pieces of the puzzle. Fly (Austin, TX). 6, 162–168 (2012). · DOI
  37. Young, M. D. et al. ChIP-seq analysis reveals distinct H3K27me3 profiles that correlate with transcriptional activity. Nucleic Acids Res. 39, 7415–7427 (2011). · DOI
  38. Traina, F. et al. Single nucleotide polymorphism array lesions, TET2, DNMT3A, ASXL1 and CBL mutations are present in systemic mastocytosis. PLoS One 7, e43090 (2012). · DOI
  39. Bejar, R. et al. Validation of a prognostic model and the impact of mutations in patients with lower-risk myelodysplastic syndromes. J. Clin. Oncol. 30, 3376–3382 (2012). · DOI
  40. Ko, M. et al. Ten-Eleven-Translocation 2 (TET2) negatively regulates homeostasis and differentiation of hematopoietic stem cells in mice. Proc. Natl Acad. Sci. USA 108, 14566–14571 (2011). · DOI · Paper page
  41. Quivoron, C. et al. TET2 inactivation results in pleiotropic hematopoietic abnormalities in mouse and is a recurrent event during human lymphomagenesis. Cancer Cell 20, 25–38 (2011). · DOI · Paper page
  42. Schwartz, Y. B. & Pirrotta, V. A new world of Polycombs: unexpected partnerships and emerging functions. Nat. Rev. Genet. 14, 853–864 (2013). · DOI
  43. Eskeland, R. et al. Ring1B compacts chromatin structure and represses gene expression independent of histone ubiquitination. Mol. Cell 38, 452–464 (2010). · DOI
  44. Yu, H. et al. The ubiquitin carboxyl hydrolase BAP1 forms a ternary complex with YY1 and HCF-1 and is a critical regulator of gene expression. Mol. Cell. Biol. 30, 5071–5085 (2010). · DOI
  45. Wang, J. et al. Loss of Asxl1 leads to myelodysplastic syndrome-like disease in mice. Blood 123, 541–553 (2014). · DOI
  46. Cooper, S. et al. Targeting polycomb to pericentric heterochromatin in embryonic stem cells reveals a role for H2AK119u1 in PRC2 recruitment. Cell Rep. 7, 1456–1470 (2014). · DOI
  47. Abdel-Wahab, O. et al. Deletion of Asxl1 results in myelodysplasia and severe developmental defects in vivo. J. Exp. Med. 210, 2641–2659 (2013). · DOI
  48. Gaytan de Ayala Alonso, A. et al. A genetic screen identifies novel polycomb group genes in Drosophila. Genetics 176, 2099–2108 (2007). · DOI
  49. Gutierrez, L. et al. The role of the histone H2A ubiquitinase Sce in Polycomb repression. Development 139, 117–127 (2012). · DOI
  50. Morita, S., Kojima, T. & Kitamura, T. Plat-E: an efficient and stable system for transient packaging of retroviruses. Gene Ther. 7, 1063–1066 (2000). · DOI
  51. Langmead, B., Trapnell, C., Pop, M. & Salzberg, S. L. Ultrafast and memory-efficient alignment of short DNA sequences to the human genome. Genome Biol. 10, R25 (2009). · DOI · Paper page
  52. Zang, C. et al. A clustering approach for identification of enriched domains from histone modification ChIP-Seq data. Bioinformatics 25, 1952–1958 (2009). · DOI
  53. Kim, D. et al. TopHat2: accurate alignment of transcriptomes in the presence of insertions, deletions and gene fusions. Genome Biol. 14, R36 (2013). · DOI · Paper page
  54. Anders, S. & Huber, W. Differential expression analysis for sequence count data. Genome Biol. 11, R106 (2010). · DOI · Paper page

Cited by

Metadata

Authors
Balasubramani, A., Larjo, A., Bassein, J. A., Chang, X., Hastie, R. B., Togher, S. M., Lähdesmäki, H., & Rao, A.
Venue
Nature Communications
Published
2015-06-22
Volume
6
Issue
1
ISSN
2041-1723
Cited by
194
References
10
Language
en

About these checks

Registry, retraction, Cites and statistics results are computed, not judged, with one exception: a printed reference that no index lists is read once by a model before it counts as a citation error. Claims are extracted by a model and kept only when their quote appears verbatim in the text; each cited source is then checked, with a model’s help, for whether it says what the claim relies on. Those verdicts can be wrong — read the claim’s quote and the cited source before relying on one.

Statistics and arithmetic are recomputed, not judged.

Confidence bands are shown only for fields calibrated on our annotated test set. None is calibrated yet, so no band is shown.

What counts as a claim ›How we measure confidence ›How we check this ›

Are you an author, or do you see a problem with this page? Request a review