

Returners and explorers dichotomy in human mobility
Open accessThe DOI matches its Crossref record; 45 of the 45 references it cites were found in a registry or an index.
Abstract
The availability of massive digital traces of human whereabouts has offered a series of novel insights on the quantitative patterns characterizing human mobility. In particular, numerous recent studies have lead to an unexpected consensus: the considerable variability in the characteristic travelled distance of individuals coexists with a high degree of predictability of their future locations. Here we shed light on this surprising coexistence by systematically investigating the impact of recurrent mobility on the characteristic distance travelled by individuals. Using both mobile phone and GPS data, we discover the existence of two distinct classes of individuals: returners and explorers. As existing models of human mobility cannot explain the existence of these two classes, we develop more realistic models able to capture the empirical findings. Finally, we show that returners and explorers play a distinct quantifiable role in spreading phenomena and that a correlation exists between their mobility patterns and social interactions.
Overview
The claims and statistics of this paper haven’t been checked yet.
Free: it reads the open-access text and checks the first 5 claims that cite a source we can check. Create a free account to check every claim.
Integrity signals
Registry
Cites
Statistics
Figures




Verification
Claims the paper makes
The claims and statistics of this paper haven’t been checked yet.
Free: it reads the open-access text and checks the first 5 claims that cite a source we can check. Create a free account to check every claim.
Claims other papers make about this one
Each is checked against this paper’s own text: does it say what the citing paper says it does?
The cited source says what the claim attributes to it.
In the citing paper
“Following Pappalardo et al. (2015), we use r g and r (k) g , which have been demonstrated to categorize individual mobility into two distinct classes: returners and explorers.”
From Visitation patterns across mobility groups: wandering, commuting, and exploring (2026) · cites this paper as Pappalardo et al. (2015)
Self-check
Percentages, sums and reported differences re-computed from the paper’s own numbers.
The self-check needs the paper’s full text.
Citations
Cites
(2008) · Data Mining and Market Intelligence for Optimal Marketing Returns · doi:10.4324/9780080878096-12 · Cited by 6,954
Understanding individual human mobility patterns
González, M. C., Hidalgo, C. A., & Barabási, A.-L. (2008) · Nature · doi:10.1038/nature06958 · Cited by 6,059
Self-citationLimits of Predictability in Human Mobility
Song, C., Qu, Z., Blumm, N., & Barabási, A.-L. (2010) · Science · doi:10.1126/science.1177170 · Cited by 3,234 · cited 1×
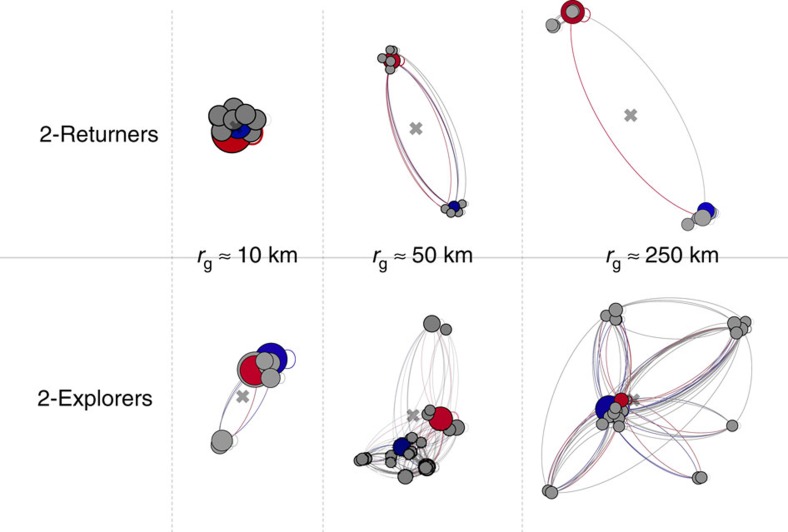
“Figure 5 shows some representative examples of individual mobility networks 3,31 of two-returners and two-explorers with different total r g .”
BackgroundSelf-citationBatty, M., Axhausen, K. W., Giannotti, F., Pozdnoukhov, A., Bazzani, A., Wachowicz, M., Ouzounis, G., & Portugali, Y. (2012) · The European Physical Journal Special Topics · doi:10.1140/epjst/e2012-01703-3 · Cited by 2,424 · cited 1×
“…microscope has attracted scientists from diverse disciplines, from physics and network science 1–4 to data mining 5–8 , and has fuelled advances from public health 9–14 to transportation engineering 15–17 , urban planning 18–21 , official statistics 22,23 and the design of smart cities 24–27 .”
BackgroundSelf-citationThe scaling laws of human travel
Brockmann, D., Hufnagel, L., & Geisel, T. (2006) · Nature · doi:10.1038/nature04292 · Cited by 2,205 · cited 1×
“This broad social microscope has attracted scientists from diverse disciplines, from physics and network science 1–4 to data mining 5–8 , and has fuelled advances from public health 9–14 to transportation engineering 15–17 , urban planning 18–21 , official statistics 22,23 and the design of smart…”
BackgroundBatty, M. (2013) · doi:10.7551/mitpress/9399.001.0001 · Cited by 1,700
A universal model for mobility and migration patterns
Simini, F., González, M. C., Maritan, A., & Barabási, A.-L. (2012) · Nature · doi:10.1038/nature10856 · Cited by 1,502
Self-citationThe Origins of Scaling in Cities
Bettencourt, L. M. A. (2013) · Science · doi:10.1126/science.1235823 · Cited by 1,480
Multiscale mobility networks and the spatial spreading of infectious diseases
Balcan, D., Colizza, V., Gonçalves, B., Hu, H., Ramasco, J. J., & Vespignani, A. (2009) · Proceedings of the National Academy of Sciences · doi:10.1073/pnas.0906910106 · Cited by 1,380 · cited 1×
“This modification is justified by the accuracy of the gravity model to estimate origin-destination matrices at the country level 34–37 .”
MethodModelling the scaling properties of human mobility
Song, C., Koren, T., Wang, P., & Barabási, A.-L. (2010) · Nature Physics · doi:10.1038/nphys1760 · Cited by 1,284 · cited 4×
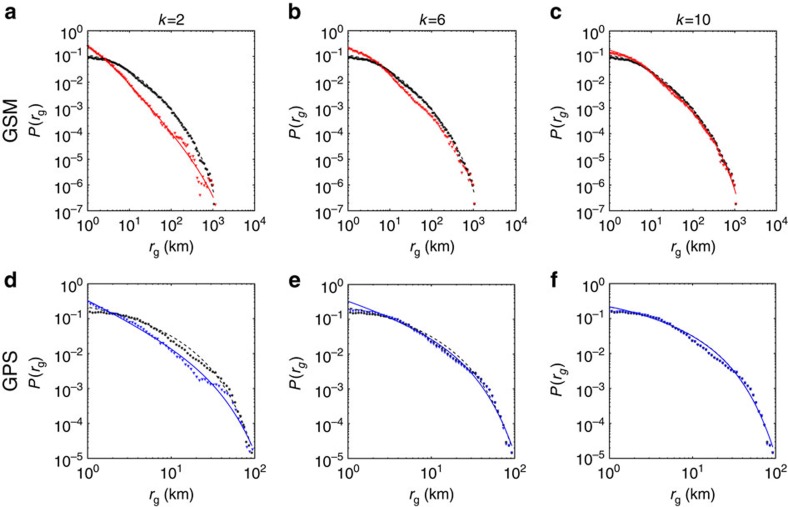
“Theparametersofthefittedtruncatedpowerlawsfor r from the population (see Supplementary Note 4, Supplementary Fig.”
BackgroundInfluentialSelf-citation
Research works printed but not linked: 4
- Giannotti, F., Nanni, M., Pinelli, F. & Pedreschi, D. in Proceedings of the 13th ACM SIGKDD International Conference on Knowledge Discovery and Data Mining (KDD) 330–339ACM (2007).
- Jiang, S. et al. in Proceedings of the 2nd ACM SIGKDD (International Workshop on Urban Computing (UrbComp'13)) 21–29ACM (2013).
- Rinzivillo, S. et al. in Proceedings of the 1st International Conference on Data Science and Advanced Analytics (DSAA'2014) IEEE Computer Society, Shanghai, China (2014).
- Wang, D., Pedreschi, D., Chaoming, S., Giannotti, F. & Barabási, A. L. in Proceedings of the 17th ACM SIGKDD International Conference on Knowledge Discovery and Data Mining (KDD) 1100–1108ACM New York, San Diego, CA, USA (2011).
Cited by
Human mobility: Models and applications
Barbosa, H., Barthelemy, M., Ghoshal, G., James, C. R., Lenormand, M., Louail, T., Menezes, R., Ramasco, J. J., Simini, F., & Tomasini, M. (2018) · Physics Reports · doi:10.1016/j.physrep.2018.01.001 · Cited by 1,027
“nurture)? The same can be said about regularities whereby human behavior is divided between those that are explorers or returners in their mobility pattern [89].”
BackgroundSelf-citationActivity-Based Human Mobility Patterns Inferred from Mobile Phone Data: A Case Study of Singapore
Jiang, S., Ferreira, J., & Gonzalez, M. C. (2017) · IEEE Transactions on Big Data · doi:10.1109/tbdata.2016.2631141 · Cited by 471
“Human mobility revealed from CDR data illustrates a pattern of preferential returns to previously visited locations and explorations of new places as a general and universal feature in human mobility [15]–[17].”
BackgroundThe universal visitation law of human mobility
Schläpfer, M., Dong, L., O’Keeffe, K., Santi, P., Szell, M., Salat, H., Anklesaria, S., Vazifeh, M., Ratti, C., & West, G. B. (2021) · Nature · doi:10.1038/s41586-021-03480-9 · Cited by 425
Measuring objective and subjective well-being: dimensions and data sources
Voukelatou, V., Gabrielli, L., Miliou, I., Cresci, S., Sharma, R., Tesconi, M., & Pappalardo, L. (2021) · International Journal of Data Science and Analytics · doi:10.1007/s41060-020-00224-2 · Cited by 365
Self-citationAlessandretti, L., Aslak, U., & Lehmann, S. (2020) · Nature · doi:10.1038/s41586-020-2909-1 · Cited by 361
Metadata
- Authors
- Pappalardo, L., Simini, F., Rinzivillo, S., Pedreschi, D., Giannotti, F., & Barabási, A.-L.
- Affiliations
- University of Pisa (IT)
- Northeastern University (US)
- Istituto di Scienza e Tecnologie dell'Informazione "Alessandro Faedo" (IT)
- Corresponding author
- Pappalardo, Luca
- Simini, Filippo
- Venue
- Nature Communications
- Published
- 2015-09-08
- Volume
- 6
- Issue
- 1
- Pages
- 8166-8166
- ISSN
- 2041-1723 (ISSN-L)
- PMC
- PMC4569739
- OpenAlex
- W2134946452
- Cited by
- 494
- References
- 45
- Citations by year
- 2026: 43 · 2025: 42 · 2024: 47 · 2023: 52 · 2022: 49 · 2021: 72 · 2020: 55 · 2019: 42 · 2018: 33 · 2017: 35 · 2016: 22 · 2015: 1
- FWCI
- 57.10
- Type
- journal article
- Language
- en
- Open access
- gold
- doi.org
- Licence
- cc-by
- creativecommons.org/licenses/by/4.0 (tdm)
- creativecommons.org/licenses/by/4.0 (vor)
- Locations
- Nature Communications (publishedVersion, cc-by)
- Europe PMC (PubMed Central) (publishedVersion, cc-by)
- PubMed Central (publishedVersion, cc-by)
- PubMed (publishedVersion)
- Bristol Research (University of Bristol) (publishedVersion, other-oa)
- Digital Access to Scholarship at Harvard (DASH) (Harvard University) (submittedVersion, cc-by)
- RePEc: Research Papers in Economics (submittedVersion)
- CINECA IRIS Institutial research information system (University of Pisa) (submittedVersion, cc-by)
- ISTI Open Portal (submittedVersion, other-oa)
- Open Research (Auckland University of Technology) (submittedVersion, cc-by)
- Explore Bristol Research (submittedVersion, other-oa)
- Funders
- European Commission (H2020 Program, FP7 ICT, 270833, H2020, 317532, 641191)
- Defense Threat Reduction Agency (HDTRA1)
- Horizon 2020 Framework Programme (641191)
- FP7 Information and Communication Technologies
- Topics
- Social Sciences › Transportation › Human Mobility and Location-Based Analysis
- Physical Sciences › Physics and Astronomy › Statistical and Nonlinear Physics › Complex Network Analysis Techniques
- Physical Sciences › Computer Science › Computer Networks and Communications › Opportunistic and Delay-Tolerant Networks
- Keywords
- human mobility, mobile phone data, GPS data, mobility models, epidemic spread, social interaction
- MeSH terms
- Exploratory Behavior, Humans, Interpersonal Relations, Models, Theoretical, Social Behavior, Travel, Geographic Information Systems, Cell Phone
About these checks
Registry, retraction, Cites and statistics results are computed, not judged, with one exception: a printed reference that no index lists is read once by a model before it counts as a citation error. Claims are extracted by a model and kept only when their quote appears verbatim in the text; each cited source is then checked, with a model’s help, for whether it says what the claim relies on. Those verdicts can be wrong — read the claim’s quote and the cited source before relying on one.
Statistics and arithmetic are recomputed, not judged.
Confidence bands are shown only for fields calibrated on our annotated test set. None is calibrated yet, so no band is shown.
What counts as a claim ›How we measure confidence ›How we check this ›
Are you an author, or do you see a problem with this page? Request a review
How to cite
Cite CoChat for the checks on this page, and the paper for its own findings.
- This page
- CoChat. (2026). Citation check: Returners and explorers dichotomy in human mobility. https://app.cochat.ai/papers/10.1038/ncomms9166
- The paper
- Pappalardo, L., Simini, F., Rinzivillo, S., Pedreschi, D., Giannotti, F., & Barabási, A.-L. (2015). Returners and explorers dichotomy in human mobility. Nature Communications. https://doi.org/10.1038/ncomms9166
Data sources
Bibliographic data: Semantic Scholar, OpenAlex, Crossref.
Contains information from the Semantic Scholar Academic Graph Datasets, made available under the ODC Attribution License (ODC-BY 1.0).
Semantic Scholar’s data is described in: Kinney, R., et al. (2023). The Semantic Scholar Open Data Platform. arXiv:2301.10140.
