Cited by 185Circular RNAs in diseasesTreatment of Major DepressionTryptophan and brain disorders

The DOI matches its Crossref record; 62 of the 63 references it cites were found in a registry or an index.

CircDYM ameliorates depressive-like behavior by targeting miR-9 to regulate microglial activation via HSP90 ubiquitination

Open access

Abstract

Circular RNAs (circRNAs), highly expressed in the central nervous system, are involved in various regulatory processes and implicated in some pathophysiology. However, the potential role of circRNAs in psychiatric diseases, particularly major depressive disorder (MDD), remains largely unknown. Here, we demonstrated that circular RNA DYM (circDYM) levels were significantly decreased both in the peripheral blood of patients with MDD and in the two depressive-like mouse models: the chronic unpredictable stress (CUS) and lipopolysaccharide (LPS) models. Restoration of circDYM expression significantly attenuated depressive-like behavior and inhibited microglial activation induced by CUS or LPS treatment. Further examination indicated that circDYM functions as an endogenous microRNA-9 (miR-9) sponge to inhibit miR-9 activity, which results in a downstream increase of target-HECT domain E3 ubiquitin protein ligase 1 (HECTD1) expression, an increase of HSP90 ubiquitination, and a consequent decrease of microglial activation. Taken together, the results of our study demonstrate the involvement of circDYM and its coupling mechanism in depression, providing translational evidence that circDYM may be a novel therapeutic target for depression.

Overview

The claims and statistics of this paper haven’t been checked yet.

Run the check — free, no account needed. It reads the open-access text and checks the sources it cites.

A few free checks a day · papers already verified open instantly · results are public

Integrity signals

Registry

Crossref · 10.1038/s41380-018-0285-0

Cites

62 of 62 references verified0 citation errors · 0 not checkable

Statistics

Figures

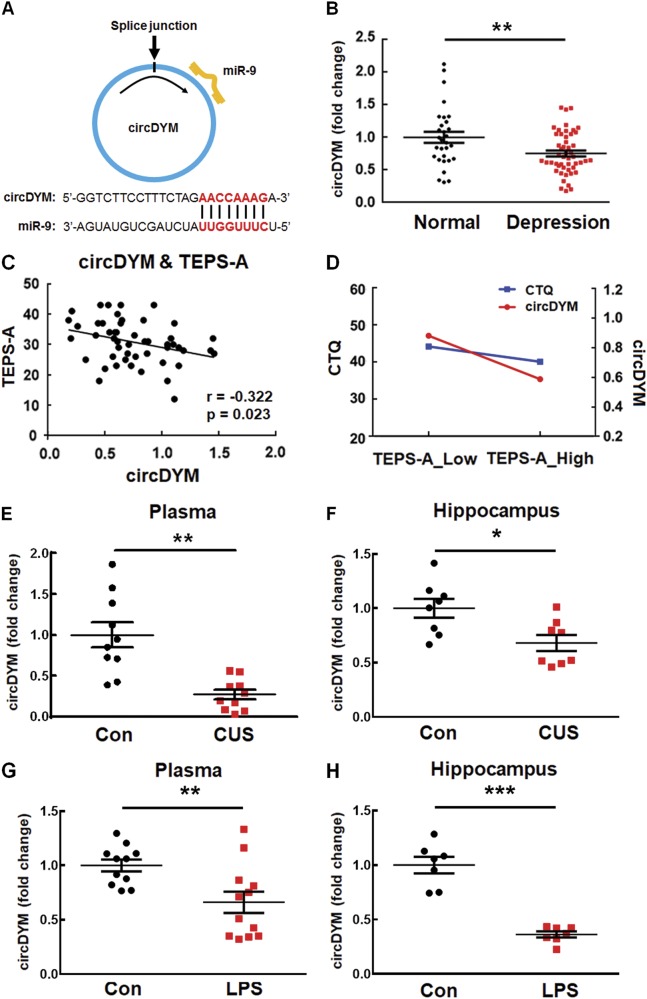
Fig. 1 CircDYM was downregulated in the MDD patients and the depressive-like animal models. a circDYM contains one site that is complementary to miR-9 according to the bioinformatics program RNAhybrid. b Levels of circDYM were decreased in the peripheral blood of MDD patients (n = 50) compared with those of normal controls (n = 30). All the data were presented as mean ± SEM. **p < 0.01 versus normal control group using Student’s t test. c Correlation between circDYM expression and TEPS-A scores using the Pearson’s correlation coefficient. d Interactive effects of circDYM and CTQ scores on TEPS-A scores in MDD patients using Multivariate Linear Regression. MDD patients with lower circDYM and CTQ scores showed more severe depressive symptoms. e Expression of circDYM in the plasma of CUS mice. After exposure to CUS for 5 weeks, mice were sacrificed. Plasma was collected, and RNA was isolated for examination of circDYM by real-time PCR. All data were presented as mean ± SEM. n = 10 mice/group, **p < 0.01 versus Control using Student’s t test. f Expression of circDYM in the hippocampus of CUS mice. After exposure to CUS for 5 weeks, mice were sacrificed. The hippocampus was collected, and RNA was isolated for examination of circDYM by real-time PCR. All data were presented as mean ± SEM. n = 8 mice/group, *p < 0.05 versus Control using Student’s t test. g Expression of circDYM in the plasma of mice treated with LPS. Mice were intraperitoneally injected with LPS (1 mg/kg) or saline for 5 successive days and then sacrificed. Plasma was collected, and RNA was isolated for examination of circDYM by real-time PCR. All data were presented as mean ± SEM. n = 11-12 mice/group, **p < 0.01 vs. Control using Student’s t test. h Expression of circDYM in the hippocampus of mice treated with LPS. Mice were intraperitoneally injected with LPS (1 mg/kg) or saline for 5 successive days and then sacrificed. The hippocampus was collected, and RNA was isolated for examination of circDYM by real-time PCR. All the data were presented as mean ± SEM. n = 7 mice/group, ***p < 0.001 vs. Control using Student’s t test
Fig. 1 CircDYM was downregulated in the MDD patients and the depressive-like animal models. a circDYM contains one site that is complementary to miR-9 according to the bioinformatics program RNAhybrid. b Levels of circDYM were decreased in the peripheral blood of MDD patients (n = 50) compared with those of normal controls (n = 30). All the data were presented as mean ± SEM. **p < 0.01 versus normal control group using Student’s t test. c Correlation between circDYM expression and TEPS-A scores using the Pearson’s correlation coefficient. d Interactive effects of circDYM and CTQ scores on TEPS-A scores in MDD patients using Multivariate Linear Regression. MDD patients with lower circDYM and CTQ scores showed more severe depressive symptoms. e Expression of circDYM in the plasma of CUS mice. After exposure to CUS for 5 weeks, mice were sacrificed. Plasma was collected, and RNA was isolated for examination of circDYM by real-time PCR. All data were presented as mean ± SEM. n = 10 mice/group, **p < 0.01 versus Control using Student’s t test. f Expression of circDYM in the hippocampus of CUS mice. After exposure to CUS for 5 weeks, mice were sacrificed. The hippocampus was collected, and RNA was isolated for examination of circDYM by real-time PCR. All data were presented as mean ± SEM. n = 8 mice/group, *p < 0.05 versus Control using Student’s t test. g Expression of circDYM in the plasma of mice treated with LPS. Mice were intraperitoneally injected with LPS (1 mg/kg) or saline for 5 successive days and then sacrificed. Plasma was collected, and RNA was isolated for examination of circDYM by real-time PCR. All data were presented as mean ± SEM. n = 11-12 mice/group, **p < 0.01 vs. Control using Student’s t test. h Expression of circDYM in the hippocampus of mice treated with LPS. Mice were intraperitoneally injected with LPS (1 mg/kg) or saline for 5 successive days and then sacrificed. The hippocampus was collected, and RNA was isolated for examination of circDYM by real-time PCR. All the data were presented as mean ± SEM. n = 7 mice/group, ***p < 0.001 vs. Control using Student’s t testCC BY · PubMed Central
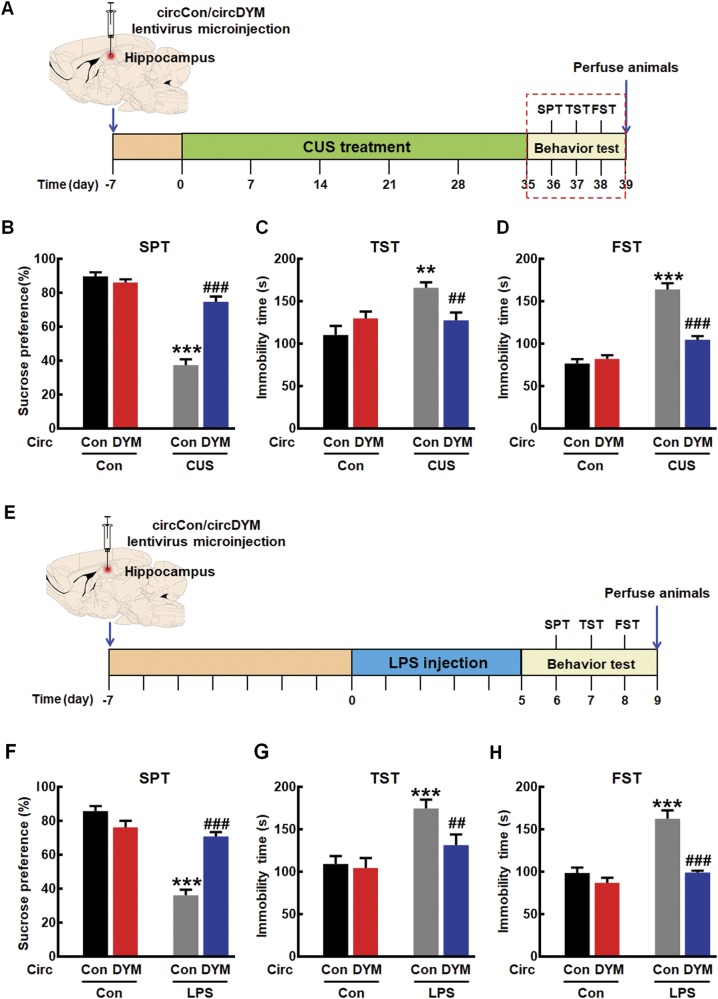
Fig. 2 Overexpression of circDYM ameliorated depressive-like behavior. a Timeline of experimental procedure in the CUS-induced mouse depressive model. b–d Effects of circDYM-GFP lentivirus microinjection on the depressive-like behavior in CUS mice. One week after circControl/circDYM-GFP lentivirus microinjection, mice were exposed to a CUS or control protocol (n = 11 mice/group). SPT (b), TST (c), and FST (d) were measured after 5 weeks of CUS exposure. All data were presented as mean ± SEM. (SPT, circDYM: F(1,40) = 33.454, P < 0.001; CUS: F(1,40) = 119.263, P < 0.001; interaction: F(1,40) = 49.660, P < 0.001. TST, circDYM: F(1,40) = 4.217, P < 0.05; CUS: F(1,40) = 7.676, P < 0.01; interaction: F(1,40) = 4.795, P < 0.05. FST, circDYM: F(1,40) = 22.168, P < 0.001; CUS: F(1,40) = 91.678, P < 0.001; interaction: F(1,40) = 31.976, P < 0.001). e Timeline of experimental procedure in the LPS-induced mouse depressive model. f–h Effects of circDYM-GFP lentivirus microinjection on the depressive-like behavior in LPS mice. One week after circControl/circDYM-GFP lentivirus microinjection, mice were intraperitoneally injected with LPS (1 mg/kg, n = 11 mice/group) or saline (n = 11 mice/group) for 5 successive days. SPT (f), TST (g), and FST (h) were then measured. All data were presented as mean ± SEM. (SPT, circDYM: F(1,40) = 14.492, P < 0.001; LPS: F(1,40) = 69.880, P < 0.001; interaction: F(1,40) = 45.436, P < 0.001. TST, circDYM: F(1,40) = 6.148, P < 0.05; LPS: F(1,40) = 16.830, P < 0.001; interaction: F(1,40) = 4.140, P < 0.05. FST, circDYM: F(1,40) = 32.290, P < 0.001; LPS: F(1,40) = 32.757, P < 0.001; interaction: F(1,40) = 15.301, P < 0.001). **P < 0.01 and ***p < 0.001 vs. circControl Control group; ##p < 0.01 and ###p < 0.001 vs. circControl treated with CUS/LPS group. SPT sucrose preference test, TST tail suspension test, FST forced swim test
Fig. 2 Overexpression of circDYM ameliorated depressive-like behavior. a Timeline of experimental procedure in the CUS-induced mouse depressive model. b–d Effects of circDYM-GFP lentivirus microinjection on the depressive-like behavior in CUS mice. One week after circControl/circDYM-GFP lentivirus microinjection, mice were exposed to a CUS or control protocol (n = 11 mice/group). SPT (b), TST (c), and FST (d) were measured after 5 weeks of CUS exposure. All data were presented as mean ± SEM. (SPT, circDYM: F(1,40) = 33.454, P < 0.001; CUS: F(1,40) = 119.263, P < 0.001; interaction: F(1,40) = 49.660, P < 0.001. TST, circDYM: F(1,40) = 4.217, P < 0.05; CUS: F(1,40) = 7.676, P < 0.01; interaction: F(1,40) = 4.795, P < 0.05. FST, circDYM: F(1,40) = 22.168, P < 0.001; CUS: F(1,40) = 91.678, P < 0.001; interaction: F(1,40) = 31.976, P < 0.001). e Timeline of experimental procedure in the LPS-induced mouse depressive model. f–h Effects of circDYM-GFP lentivirus microinjection on the depressive-like behavior in LPS mice. One week after circControl/circDYM-GFP lentivirus microinjection, mice were intraperitoneally injected with LPS (1 mg/kg, n = 11 mice/group) or saline (n = 11 mice/group) for 5 successive days. SPT (f), TST (g), and FST (h) were then measured. All data were presented as mean ± SEM. (SPT, circDYM: F(1,40) = 14.492, P < 0.001; LPS: F(1,40) = 69.880, P < 0.001; interaction: F(1,40) = 45.436, P < 0.001. TST, circDYM: F(1,40) = 6.148, P < 0.05; LPS: F(1,40) = 16.830, P < 0.001; interaction: F(1,40) = 4.140, P < 0.05. FST, circDYM: F(1,40) = 32.290, P < 0.001; LPS: F(1,40) = 32.757, P < 0.001; interaction: F(1,40) = 15.301, P < 0.001). **P < 0.01 and ***p < 0.001 vs. circControl Control group; ##p < 0.01 and ###p < 0.001 vs. circControl treated with CUS/LPS group. SPT sucrose preference test, TST tail suspension test, FST forced swim testCC BY · PubMed Central
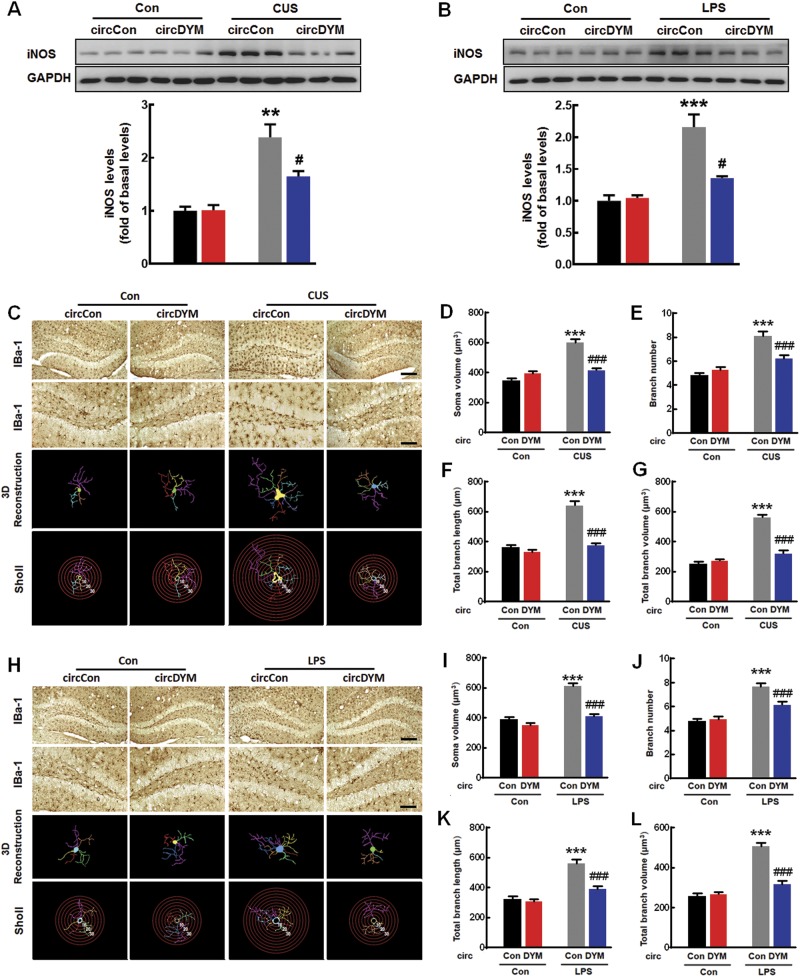
Fig. 3 Overexpression of circDYM inhibited microglial activation in vivo. a, b Effect of circDYM overexpression on iNOS levels in CUS (a) and LPS (b) models. Mice were microinjected with the circControl/circDYM-GFP lentivirus in the hippocampus. One week after microinjection, mice were exposed to a CUS protocol for 5 weeks, or they were intraperitoneally injected with LPS (1 mg/kg) for 5 successive days. Three representative immunoblots were presented from 6 mice/group. All data were presented as mean ± SEM. (CUS model, circDYM: F(1,20) = 10.261, P < 0.01; CUS: F(1,20) = 55.047, P < 0.001; interaction: F(1,20) = 10.918, P < 0.01. LPS model, circDYM: F(1,20) = 11.488, P < 0.01; CUS: F(1,20) = 43.685, P < 0.001; interaction: F(1,20) = 14.374, P < 0.01). c–g Effect of circDYM on microglial activation induced by CUS. Representative images of microglial immunostaining for Iba-1 in mice hippocampus, followed by 3D reconstruction and Sholl analysis (c). Scale bars: 200 μm (upper panel) and 100 μm (lower panel). Average soma size (d), branch number (e), total branch length (f), and total branch volume (g). All data were presented as mean ± SEM. n = 5 mice/group, 50 cells/group. (Average soma size, circDYM: F(1,196) = 15.035, P < 0.001; CUS: F(1,196) = 60.454, P < 0.001; interaction: F(1,196) = 42.132, P < 0.001. Branch number, circDYM: F(1,196) = 6.649, P < 0.05; CUS: F(1,196) = 57.645, P < 0.001; interaction: F(1,196) = 17.259, P < 0.001. Total branch length, circDYM: F(1,196) = 60.587, P < 0.001; CUS: F(1,196) = 73.005, P < 0.001; interaction: F(1,196) = 38.486, P < 0.001. Total branch volume, circDYM: F(1,196) = 47.866, P < 0.001; CUS: F(1,196) = 127.414, P < 0.001; interaction: F(1,196) = 67.190, P < 0.001). h–l Effect of circDYM on microglial activation induced by LPS. Representative images of microglial immunostaining for Iba-1 in mice hippocampus, followed by 3D reconstruction and Sholl analysis (h). Scale bars: 200μm (upper panel) and 100 μm (lower panel). Average soma size (i), branch number (j), total branch length (k), and total branch volume (l). All the data were presented as mean ± SEM. n = 5 mice/group, 50 cells/group. (Average soma size, circDYM: F(1,196) = 50.359, P < 0.001; LPS: F(1,196) = 69.865, P < 0.001; interaction: F(1,196) = 23.044, P < 0.001. Branch number, circDYM: F(1,196) = 7.061, P < 0.01; LPS: F(1,196) = 63.546, P < 0.001; interaction: F(1,196) = 10.267, P < 0.01. Total branch length, circDYM: F(1,196) = 22.037, P < 0.001; LPS: F(1,196) = 66.660, P < 0.001; interaction: F(1,196) = 15.319, P < 0.001. Total branch volume, circDYM: F(1,196) = 36.990, P < 0.001; LPS: F(1,196) = 97.182, P < 0.001; interaction: F(1,196) = 45.217, P < 0.001). **p < 0.01 and ***p < 0.001 versus circControl Control group; #p < 0.05 and ###p < 0.001 versus circControl treated with CUS/LPS group
Fig. 3 Overexpression of circDYM inhibited microglial activation in vivo. a, b Effect of circDYM overexpression on iNOS levels in CUS (a) and LPS (b) models. Mice were microinjected with the circControl/circDYM-GFP lentivirus in the hippocampus. One week after microinjection, mice were exposed to a CUS protocol for 5 weeks, or they were intraperitoneally injected with LPS (1 mg/kg) for 5 successive days. Three representative immunoblots were presented from 6 mice/group. All data were presented as mean ± SEM. (CUS model, circDYM: F(1,20) = 10.261, P < 0.01; CUS: F(1,20) = 55.047, P < 0.001; interaction: F(1,20) = 10.918, P < 0.01. LPS model, circDYM: F(1,20) = 11.488, P < 0.01; CUS: F(1,20) = 43.685, P < 0.001; interaction: F(1,20) = 14.374, P < 0.01). c–g Effect of circDYM on microglial activation induced by CUS. Representative images of microglial immunostaining for Iba-1 in mice hippocampus, followed by 3D reconstruction and Sholl analysis (c). Scale bars: 200 μm (upper panel) and 100 μm (lower panel). Average soma size (d), branch number (e), total branch length (f), and total branch volume (g). All data were presented as mean ± SEM. n = 5 mice/group, 50 cells/group. (Average soma size, circDYM: F(1,196) = 15.035, P < 0.001; CUS: F(1,196) = 60.454, P < 0.001; interaction: F(1,196) = 42.132, P < 0.001. Branch number, circDYM: F(1,196) = 6.649, P < 0.05; CUS: F(1,196) = 57.645, P < 0.001; interaction: F(1,196) = 17.259, P < 0.001. Total branch length, circDYM: F(1,196) = 60.587, P < 0.001; CUS: F(1,196) = 73.005, P < 0.001; interaction: F(1,196) = 38.486, P < 0.001. Total branch volume, circDYM: F(1,196) = 47.866, P < 0.001; CUS: F(1,196) = 127.414, P < 0.001; interaction: F(1,196) = 67.190, P < 0.001). h–l Effect of circDYM on microglial activation induced by LPS. Representative images of microglial immunostaining for Iba-1 in mice hippocampus, followed by 3D reconstruction and Sholl analysis (h). Scale bars: 200μm (upper panel) and 100 μm (lower panel). Average soma size (i), branch number (j), total branch length (k), and total branch volume (l). All the data were presented as mean ± SEM. n = 5 mice/group, 50 cells/group. (Average soma size, circDYM: F(1,196) = 50.359, P < 0.001; LPS: F(1,196) = 69.865, P < 0.001; interaction: F(1,196) = 23.044, P < 0.001. Branch number, circDYM: F(1,196) = 7.061, P < 0.01; LPS: F(1,196) = 63.546, P < 0.001; interaction: F(1,196) = 10.267, P < 0.01. Total branch length, circDYM: F(1,196) = 22.037, P < 0.001; LPS: F(1,196) = 66.660, P < 0.001; interaction: F(1,196) = 15.319, P < 0.001. Total branch volume, circDYM: F(1,196) = 36.990, P < 0.001; LPS: F(1,196) = 97.182, P < 0.001; interaction: F(1,196) = 45.217, P < 0.001). **p < 0.01 and ***p < 0.001 versus circControl Control group; #p < 0.05 and ###p < 0.001 versus circControl treated with CUS/LPS groupCC BY · PubMed Central
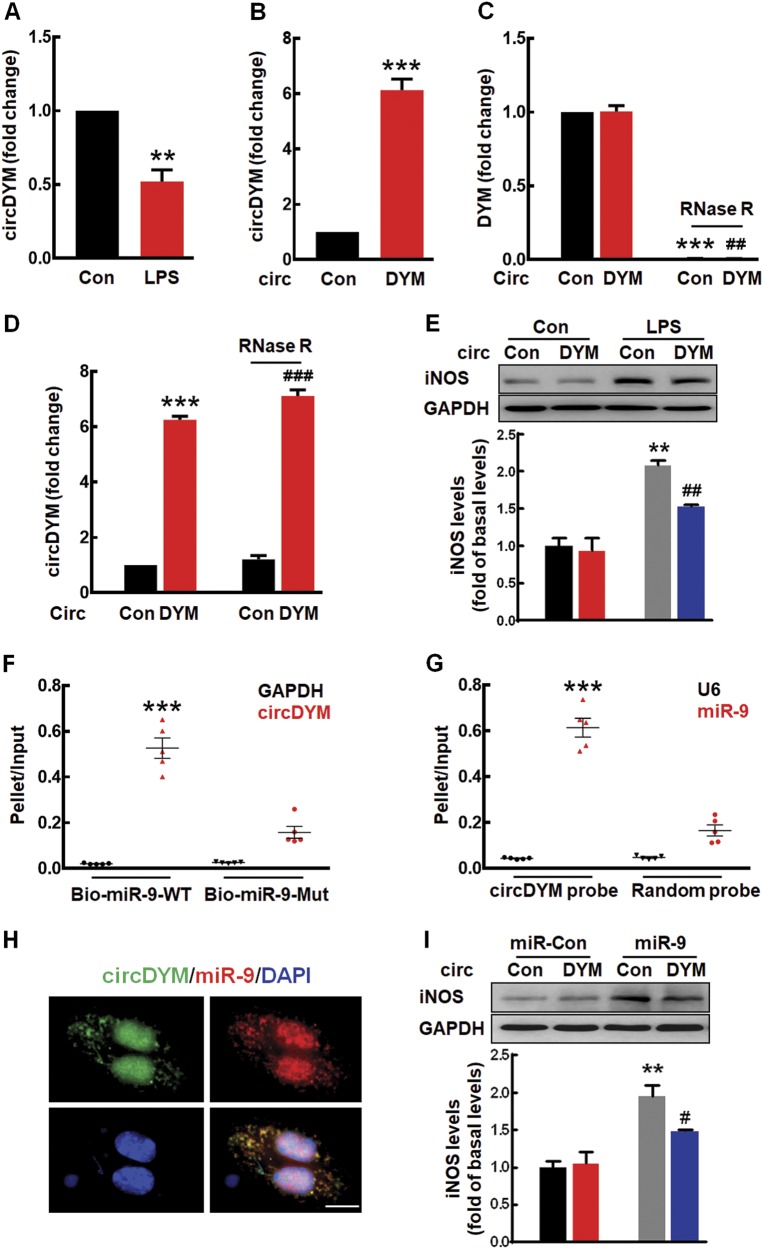
Fig. 4 CircDYM overexpression inhibited microglial activation by targeting miR-9 in vitro. a Effect of LPS on the expression of circDYM in primary mouse microglia. b Expression of circDYM in primary mouse microglia transduced with the circControl/circDYM-GFP lentivirus. All the data were presented as mean ± SEM of 3 independent experiments. **p < 0.01 and ***p < 0.001 vs. Control using Student’s t test. c, d The levels of DYM mRNA (c) and circDYM (d) in BV-2 cells. Cells were transduced with the circControl/circDYM-GFP lentivirus and incubated with or without RNase R. Total RNA extracted from BV-2 cells and the level of DYM mRNA or circDYM were detected by real-time PCR. All data were presented as mean ± SEM of 3 independent experiments. (DYM, ***p < 0.001 vs. circControl without RNase R; ##p < 0.01 vs. circDYM without RNase R using Student’s t test. circDYM, ***p < 0.001 vs. circControl without RNase R; ###p < 0.001 versus circControl with RNase R using Student’s t test). e Transduction with the circDYM-GFP lentivirus attenuated the iNOS expression induced by LPS in primary mouse microglia. Cells were transduced with circControl/circDYM-GFP lentivirus for 24 h and then treated with LPS (100 ng/ml) for another 24 h. All the data were presented as mean ± SEM of 3 independent experiments. (circDYM: F(1,8) = 8.624, P < 0.05; LPS: F(1,8) = 62.648, P < 0.001; interaction: F(1,8) = 5.396, P < 0.05. **p < 0.01 versus circControl Control group; ##p < 0.01 versus circControl treated with LPS group). f circDYM was affinity-isolated with Bio-miR-9-WT or Bio-miR-9-mut. The Bio-miR-9-WT and Bio-miR-9-mut were incubated with HEK293T cell lysates at 25 °C for 2 h. All data were presented as mean ± SEM. ***p < 0.001 vs. the Bio-miR-9-WT GAPDH using Student’s t test. g miR-9 was affinity-isolated with a random probe or a circDYM probe. The biotinylated random and circDYM probe were incubated with HEK293T cell lysates at 25 °C for 2 h. All data were presented as mean ± SEM. ***p < 0.001 vs. circDYM probe U6 using Student’s t test. h Co-localization of circDYM and miR-9 in the cytoplasm of primary mouse microglia by FISH analysis. Green, circDYM; Red, miR-9; Blue, DAPI. Scale bar, 10 μm. i Transduction with the circDYM-GFP lentivirus significantly inhibited the iNOS expression induced by miR-9 in primary mouse microglia. All the data were presented as mean ± SEM of 3 independent experiments. (circDYM: F(1,8) = 5.500, P < 0.05; miR-9: F(1,8) = 58.883, P < 0.001; interaction: F(1,8) = 5.972, P < 0.05. **p < 0.01 versus miR-Control transduced with circControl group; #p < 0.05 versus miR-9 transduced with circControl group)
Fig. 4 CircDYM overexpression inhibited microglial activation by targeting miR-9 in vitro. a Effect of LPS on the expression of circDYM in primary mouse microglia. b Expression of circDYM in primary mouse microglia transduced with the circControl/circDYM-GFP lentivirus. All the data were presented as mean ± SEM of 3 independent experiments. **p < 0.01 and ***p < 0.001 vs. Control using Student’s t test. c, d The levels of DYM mRNA (c) and circDYM (d) in BV-2 cells. Cells were transduced with the circControl/circDYM-GFP lentivirus and incubated with or without RNase R. Total RNA extracted from BV-2 cells and the level of DYM mRNA or circDYM were detected by real-time PCR. All data were presented as mean ± SEM of 3 independent experiments. (DYM, ***p < 0.001 vs. circControl without RNase R; ##p < 0.01 vs. circDYM without RNase R using Student’s t test. circDYM, ***p < 0.001 vs. circControl without RNase R; ###p < 0.001 versus circControl with RNase R using Student’s t test). e Transduction with the circDYM-GFP lentivirus attenuated the iNOS expression induced by LPS in primary mouse microglia. Cells were transduced with circControl/circDYM-GFP lentivirus for 24 h and then treated with LPS (100 ng/ml) for another 24 h. All the data were presented as mean ± SEM of 3 independent experiments. (circDYM: F(1,8) = 8.624, P < 0.05; LPS: F(1,8) = 62.648, P < 0.001; interaction: F(1,8) = 5.396, P < 0.05. **p < 0.01 versus circControl Control group; ##p < 0.01 versus circControl treated with LPS group). f circDYM was affinity-isolated with Bio-miR-9-WT or Bio-miR-9-mut. The Bio-miR-9-WT and Bio-miR-9-mut were incubated with HEK293T cell lysates at 25 °C for 2 h. All data were presented as mean ± SEM. ***p < 0.001 vs. the Bio-miR-9-WT GAPDH using Student’s t test. g miR-9 was affinity-isolated with a random probe or a circDYM probe. The biotinylated random and circDYM probe were incubated with HEK293T cell lysates at 25 °C for 2 h. All data were presented as mean ± SEM. ***p < 0.001 vs. circDYM probe U6 using Student’s t test. h Co-localization of circDYM and miR-9 in the cytoplasm of primary mouse microglia by FISH analysis. Green, circDYM; Red, miR-9; Blue, DAPI. Scale bar, 10 μm. i Transduction with the circDYM-GFP lentivirus significantly inhibited the iNOS expression induced by miR-9 in primary mouse microglia. All the data were presented as mean ± SEM of 3 independent experiments. (circDYM: F(1,8) = 5.500, P < 0.05; miR-9: F(1,8) = 58.883, P < 0.001; interaction: F(1,8) = 5.972, P < 0.05. **p < 0.01 versus miR-Control transduced with circControl group; #p < 0.05 versus miR-9 transduced with circControl group)CC BY · PubMed Central
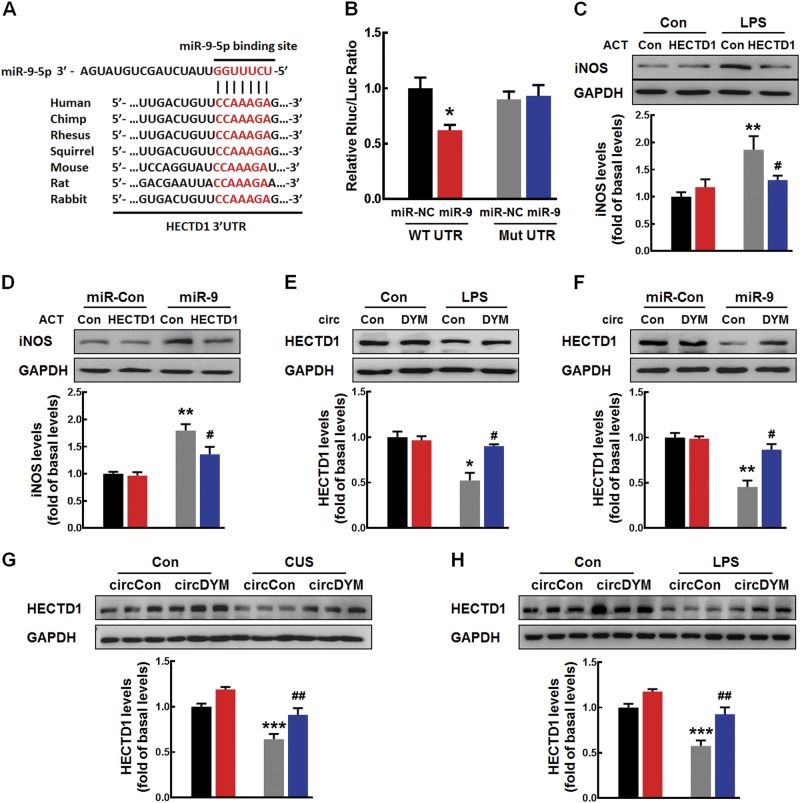
Fig. 5 MiR-9 regulated microglial activation by targeting HECTD1. a Putative miR-9 binding sites in HECTD1 (HECTD1 gene). b Relative luciferase activity of wild-type and 3’-UTR mutant constructs of HECTD1 co-transfected with miR-9 mimics and miRNA negative control. The data were presented as mean ± SEM. *p < 0.05 versus miR-NC WT UTR using Student’s t test. c Transduction-ACT-upregulated HECTD1 significantly inhibited the increased iNOS expression induced by LPS in primary mouse microglia. All the data were presented as mean ± SEM of 3 independent experiments. (HECTD1-ACT: F(1,8) = 5.391, P < 0.05; LPS: F(1,8) = 29.975, P < 0.01; interaction: F(1,8) = 11.766, P < 0.01. **P < 0.01 vs. Control-ACT Control group; #p < 0.05 versus Control-ACT treated with LPS group). d Transfection of cells with HECTD1-ACT significantly inhibited the increased iNOS expression induced by miR-9 in primary mouse microglia. All data were presented as mean ± SEM of 3 independent experiments. (HECTD1-ACT: F(1,8) = 7.627, P < 0.05; miR-9: F(1,8) = 39.874, P < 0.001; interaction: F(1,8) = 5.861, P < 0.05. **p < 0.01 vs. miR-Control transfected with Control-ACT group; #p < 0.05 vs. miR-9 transfected with Control-ACT group). e Effect of circDYM overexpression on the decreased expression HECTD1 induced by LPS. Cells were transduced with the circControl/circDYM-GFP lentivirus for 24 h and then treated with LPS (100 ng/ml) for another 24 h in primary mouse microglia. All data were presented as mean ± SEM of 3 independent experiments. (circDYM: F(1,8) = 8.703, P < 0.05; CUS: F(1,8) = 21.364, P < 0.01; interaction: F(1,8) = 12.326, P < 0.01. *p < 0.05 vs. circControl Control group; #p < 0.05 versus circControl treated with LPS group). f circDYM overexpression significantly attenuated the decreased expression of HECTD1 induced by miR-9 in primary mouse microglia. All the data were presented as mean ± SEM of 3 independent experiments. (circDYM: F(1,8) = 13.306, P < 0.01; miR-9: F(1,8) = 36.924, P < 0.001; interaction: F(1,8) = 14.735, P < 0.01. **p < 0.01 versus miR-Control transduced with circControl group; #p < 0.05 versus miR-9 transduced with circControl group). g, h Effect of circDYM overexpression on the decreased expression of HECTD1 in the CUS (g) and LPS (h) model. Mice were microinjected with the circControl/circDYM-GFP lentivirus in the hippocampus. One week after microinjection, mice were exposed to a CUS protocol for 5 weeks or intraperitoneally injected with LPS (1 mg/kg) for 5 successive days. Three representative immunoblots were presented from 6 mice/group. All data were presented as mean ± SEM. (CUS model, circDYM: F(1,20) = 50.088, P < 0.001; CUS: F(1,20) = 46.113, P < 0.001; interaction: F(1,20) = 5.085, P < 0.05. LPS model, circDYM: F(1,20) = 36.839, P < 0.001; LPS: F(1,20) = 48.185, P < 0.001; interaction: F(1,20) = 5.034, P < 0.05). ***p < 0.001 versus circControl Control group; ##p < 0.01 vs. circControl treated with CUS/LPS group. Control-ACT Control CRISPR Activation Plasmid (ACT), HECTD1-ACT HECTD1 CRISPR Activation Plasmid (ACT)
Fig. 5 MiR-9 regulated microglial activation by targeting HECTD1. a Putative miR-9 binding sites in HECTD1 (HECTD1 gene). b Relative luciferase activity of wild-type and 3’-UTR mutant constructs of HECTD1 co-transfected with miR-9 mimics and miRNA negative control. The data were presented as mean ± SEM. *p < 0.05 versus miR-NC WT UTR using Student’s t test. c Transduction-ACT-upregulated HECTD1 significantly inhibited the increased iNOS expression induced by LPS in primary mouse microglia. All the data were presented as mean ± SEM of 3 independent experiments. (HECTD1-ACT: F(1,8) = 5.391, P < 0.05; LPS: F(1,8) = 29.975, P < 0.01; interaction: F(1,8) = 11.766, P < 0.01. **P < 0.01 vs. Control-ACT Control group; #p < 0.05 versus Control-ACT treated with LPS group). d Transfection of cells with HECTD1-ACT significantly inhibited the increased iNOS expression induced by miR-9 in primary mouse microglia. All data were presented as mean ± SEM of 3 independent experiments. (HECTD1-ACT: F(1,8) = 7.627, P < 0.05; miR-9: F(1,8) = 39.874, P < 0.001; interaction: F(1,8) = 5.861, P < 0.05. **p < 0.01 vs. miR-Control transfected with Control-ACT group; #p < 0.05 vs. miR-9 transfected with Control-ACT group). e Effect of circDYM overexpression on the decreased expression HECTD1 induced by LPS. Cells were transduced with the circControl/circDYM-GFP lentivirus for 24 h and then treated with LPS (100 ng/ml) for another 24 h in primary mouse microglia. All data were presented as mean ± SEM of 3 independent experiments. (circDYM: F(1,8) = 8.703, P < 0.05; CUS: F(1,8) = 21.364, P < 0.01; interaction: F(1,8) = 12.326, P < 0.01. *p < 0.05 vs. circControl Control group; #p < 0.05 versus circControl treated with LPS group). f circDYM overexpression significantly attenuated the decreased expression of HECTD1 induced by miR-9 in primary mouse microglia. All the data were presented as mean ± SEM of 3 independent experiments. (circDYM: F(1,8) = 13.306, P < 0.01; miR-9: F(1,8) = 36.924, P < 0.001; interaction: F(1,8) = 14.735, P < 0.01. **p < 0.01 versus miR-Control transduced with circControl group; #p < 0.05 versus miR-9 transduced with circControl group). g, h Effect of circDYM overexpression on the decreased expression of HECTD1 in the CUS (g) and LPS (h) model. Mice were microinjected with the circControl/circDYM-GFP lentivirus in the hippocampus. One week after microinjection, mice were exposed to a CUS protocol for 5 weeks or intraperitoneally injected with LPS (1 mg/kg) for 5 successive days. Three representative immunoblots were presented from 6 mice/group. All data were presented as mean ± SEM. (CUS model, circDYM: F(1,20) = 50.088, P < 0.001; CUS: F(1,20) = 46.113, P < 0.001; interaction: F(1,20) = 5.085, P < 0.05. LPS model, circDYM: F(1,20) = 36.839, P < 0.001; LPS: F(1,20) = 48.185, P < 0.001; interaction: F(1,20) = 5.034, P < 0.05). ***p < 0.001 versus circControl Control group; ##p < 0.01 vs. circControl treated with CUS/LPS group. Control-ACT Control CRISPR Activation Plasmid (ACT), HECTD1-ACT HECTD1 CRISPR Activation Plasmid (ACT)CC BY · PubMed Central

Verification

Claims the paper makes

The claims and statistics of this paper haven’t been checked yet.

Run the check — free, no account needed. It reads the open-access text and checks the sources it cites.

A few free checks a day · papers already verified open instantly · results are public

Claims other papers make about this one

Each is checked against this paper’s own text: does it say what the citing paper says it does?

Self-check

Percentages, sums and reported differences re-computed from the paper’s own numbers.

The self-check needs the paper’s full text.

Citations

Cites

Show all 63 references

Cited by

Sorted by citations

See all 185

Metadata

Authors
Zhang, Y., Du, L., Bai, Y., Han, B., He, C., Gong, L., Huang, R., Shen, L., Chao, J., Liu, P., Zhang, H., Zhang, H., Gu, L., Li, J., Hu, G., Xie, C., Zhang, Z., & Yao, H.
Affiliations
  • Southeast University (CN)
  • Zhongda Hospital Southeast University (CN)
  • Henan Medical University (CN)
  • Nanjing University of Chinese Medicine (CN)
  • Nanjing Medical University (CN)
  • Henan Psychiatric Hospital (CN)
Corresponding author
  • Xie, Chunming
  • Zhang, Zhijun
  • Yao, Honghong
Venue
Molecular Psychiatry
Published
2018-11-09
Volume
25
Issue
6
Pages
1175-1190
ISSN
  • 1359-4184 (ISSN-L)
  • 1476-5578
OpenAlex
W2899654445
Cited by
184
References
63
Citations by year
2026: 16 · 2025: 27 · 2024: 27 · 2023: 29 · 2022: 27 · 2021: 34 · 2020: 19 · 2019: 5
FWCI
5.24
Type
journal article
Language
en
Open access
Locations
  • Molecular Psychiatry (publishedVersion, cc-by)
  • PubMed Central (publishedVersion, cc-by)
  • PubMed (publishedVersion)
Funders
  • National Natural Science Foundation of China (2017YFA0104303, 2016YFC1306700, 81473190, 81603090, 81761138048, 81673410, 81322048)
  • National Key Research and Development Program of China (2016YFC1306700, 2016YFC1305802, 2016YFC1305800, 2017YFA0104303)
  • Fundamental Research Funds for the Central Universities (2017YFA0104303)
Topics
  • Life Sciences › Biochemistry, Genetics and Molecular Biology › Molecular Biology › Circular RNAs in diseases
  • Health Sciences › Medicine › Pharmacology (medical) › Treatment of Major Depression
  • Life Sciences › Neuroscience › Biological Psychiatry › Tryptophan and brain disorders
Keywords
circular RNA, major depressive disorder, depression-like behavior, miR-9, HECTD1, microglial activation, chronic unpredictable mild stress, lipopolysaccharide, peripheral blood biomarkers, therapeutic target
MeSH terms
RNA, Circular, Animals, Major Depressive Disorder, Disease Models, Animal, Humans, Male, Mice, Inbred C57BL, Microglia, HSP90 Heat-Shock Proteins, MicroRNAs, Mice, Ubiquitination

About these checks

Registry, retraction, Cites and statistics results are computed, not judged, with one exception: a printed reference that no index lists is read once by a model before it counts as a citation error. Claims are extracted by a model and kept only when their quote appears verbatim in the text; each cited source is then checked, with a model’s help, for whether it says what the claim relies on. Those verdicts can be wrong — read the claim’s quote and the cited source before relying on one.

Statistics and arithmetic are recomputed, not judged.

Confidence bands are shown only for fields calibrated on our annotated test set. None is calibrated yet, so no band is shown.

What counts as a claim ›How we measure confidence ›How we check this ›

Are you an author, or do you see a problem with this page? Request a review