

The DOI matches its Crossref record; 38 of the 39 references it cites were found in a registry or an index.
mTOR kinase leads to PTEN-loss-induced cellular senescence by phosphorylating p53
Open accessAbstract
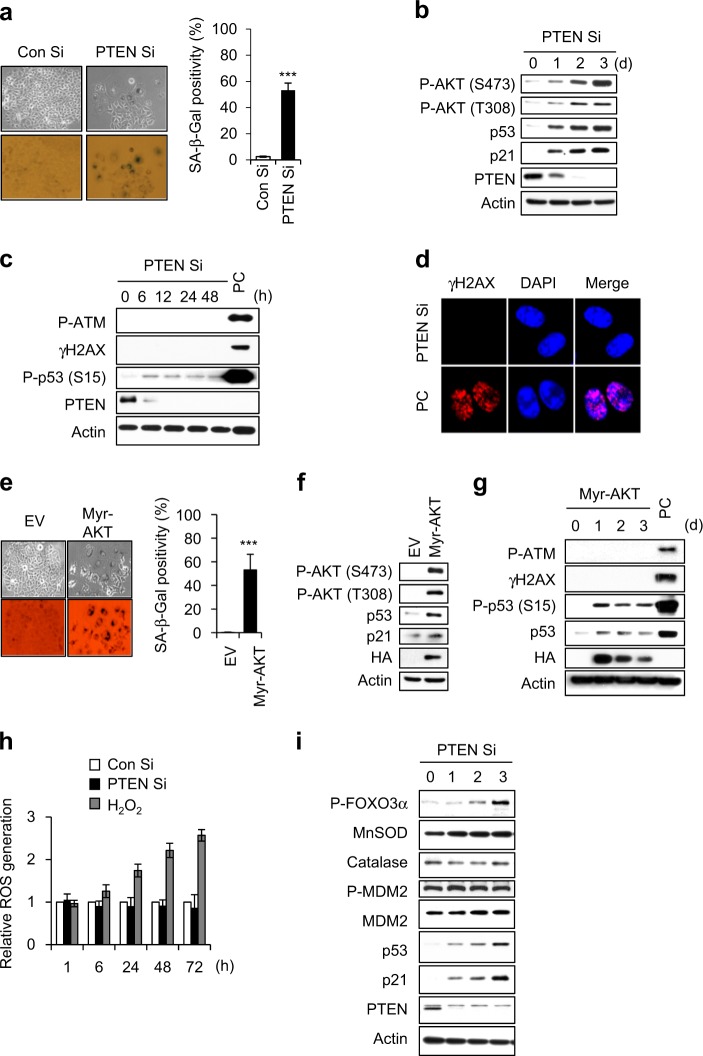
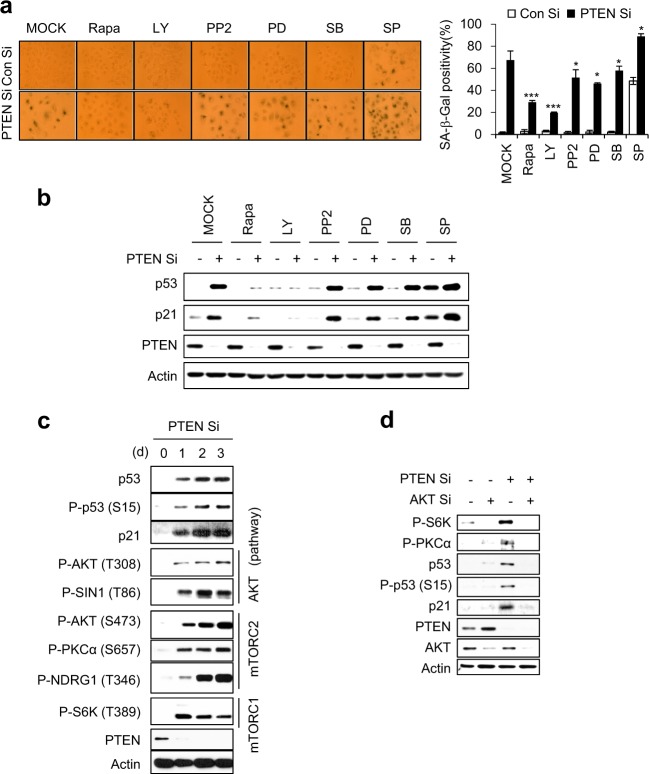
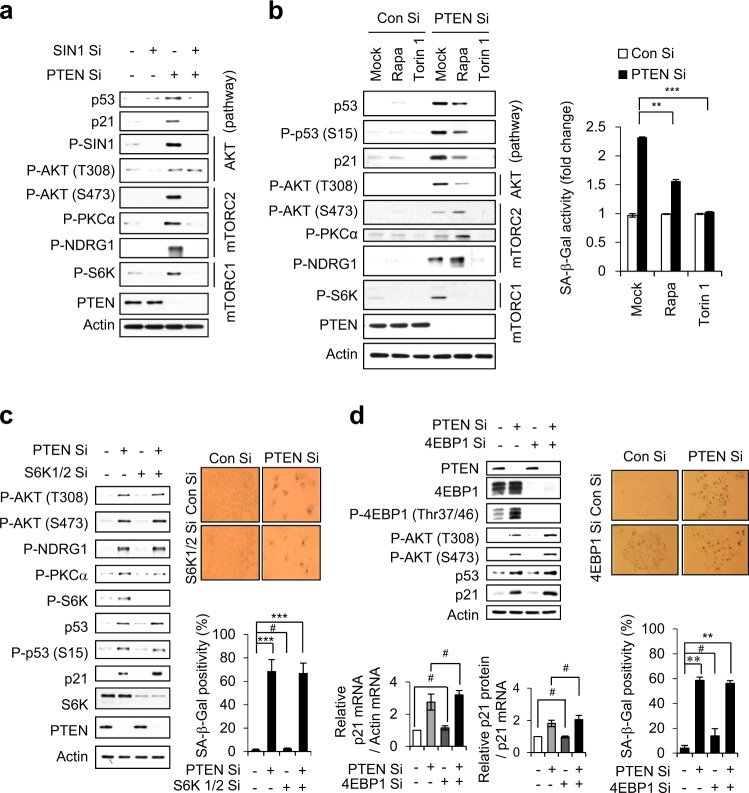
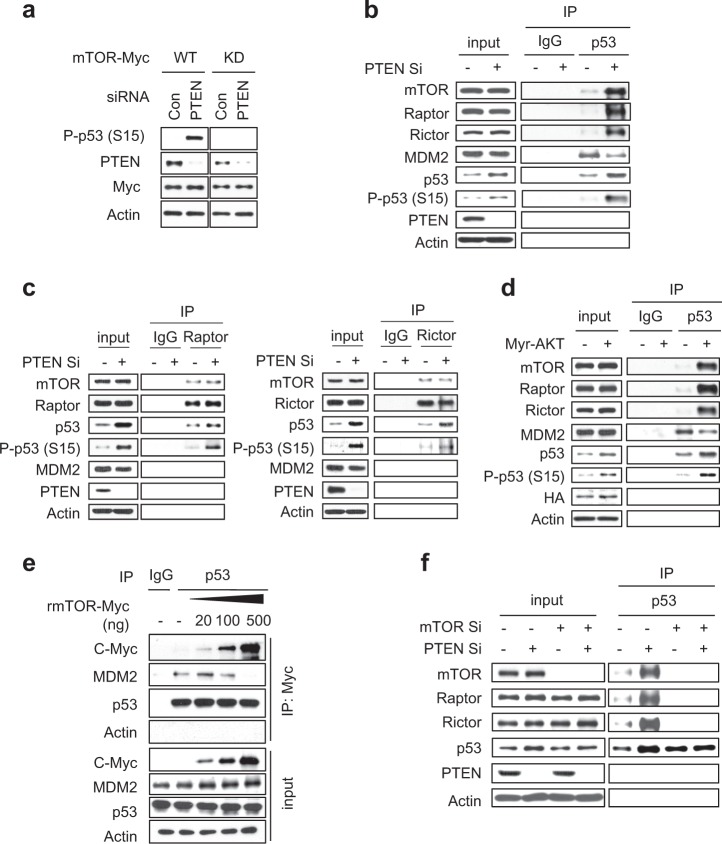
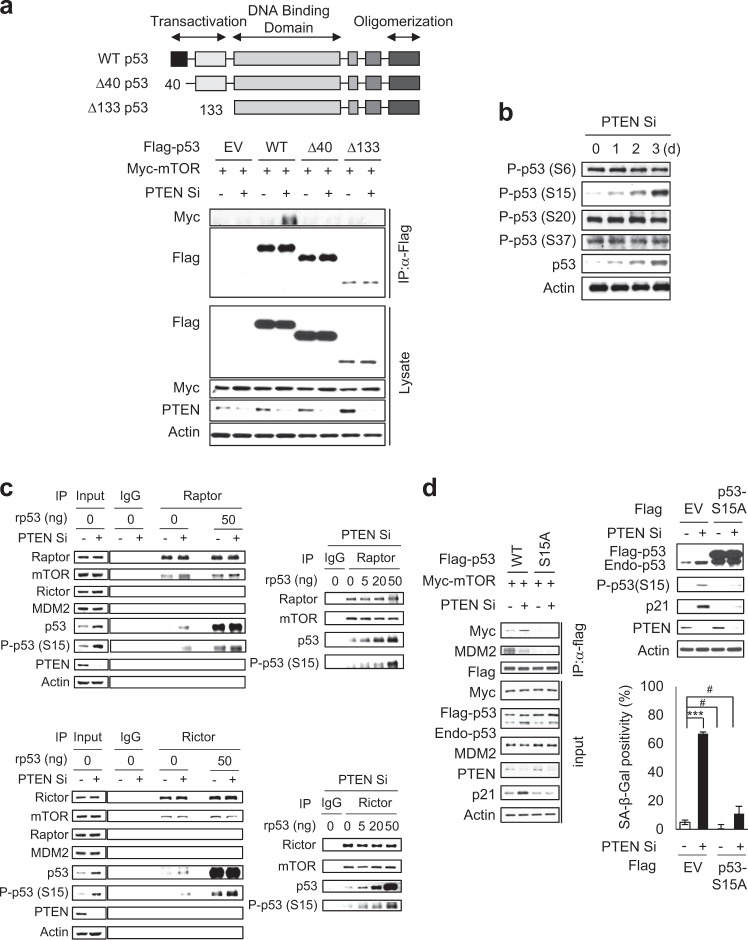
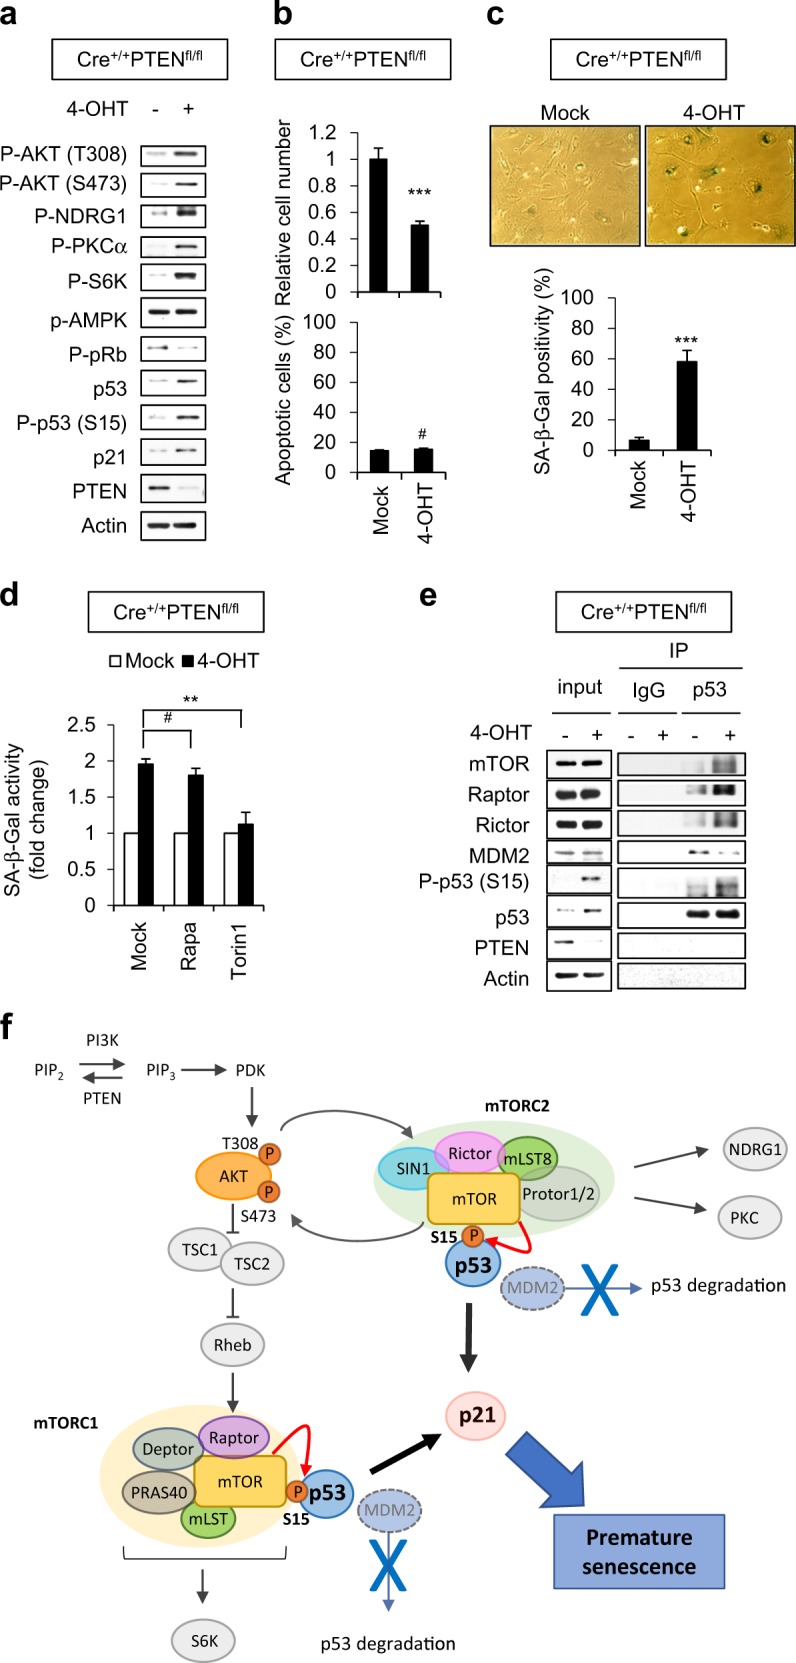
Loss of PTEN, the major negative regulator of the PI3K/AKT pathway induces a cellular senescence as a failsafe mechanism to defend against tumorigenesis, which is called PTEN-loss-induced cellular senescence (PICS). Although many studies have indicated that the mTOR pathway plays a critical role in cellular senescence, the exact functions of mTORC1 and mTORC2 in PICS are not well understood. In this study, we show that mTOR acts as a critical relay molecule downstream of PI3K/AKT and upstream of p53 in PICS. We found that PTEN depletion induces cellular senescence via p53-p21 signaling without triggering DNA damage response. mTOR kinase, a major component of mTORC1 and mTORC2, directly binds p53 and phosphorylates it at serine 15. mTORC1 and mTORC2 compete with MDM2 and increase the stability of p53 to induce cellular senescence via accumulation of the cell cycle inhibitor, p21. In embryonic fibroblasts of PTEN-knockout mice, PTEN deficiency also induces mTORC1 and mTORC2 to bind to p53 instead of MDM2, leading to cellular senescence. These results collectively demonstrate for the first time that mTOR plays a critical role in switching cells from proliferation signaling to senescence signaling via a direct link between the growth-promoting activity of AKT and the growth-suppressing activity of p53.
Overview
The claims and statistics of this paper haven’t been checked yet.
Run the check — free, no account needed. It reads the open-access text and checks the sources it cites.
Integrity signals
Registry
Cites
Statistics
Figures
Verification
Claims the paper makes
The claims and statistics of this paper haven’t been checked yet.
Run the check — free, no account needed. It reads the open-access text and checks the sources it cites.
Claims other papers make about this one
Each is checked against this paper’s own text: does it say what the citing paper says it does?
The cited source says what the claim attributes to it.
In the citing paper
“In PTEN - loss invitro models of induced senescence, the activated mTOR kinase in mTORC1 or mTORC2 stabilizes p53 and triggers the senescent state 39 .”
From Senescence and cancer — role and therapeutic opportunities (2022) · cites this paper as [39]
Self-check
Percentages, sums and reported differences re-computed from the paper’s own numbers.
The self-check needs the paper’s full text.
Citations
Cites
Repertoires of Autophagy in the Pathogenesis of Ocular Diseases
Li, Y., Jiang, Q. L., Cao, G.-F., Yao, J., & Yan, B. (2015) · Cellular Physiology and Biochemistry · doi:10.1159/000373980 · Cited by 16,351
mTOR Signaling in Growth Control and Disease
Laplante, M., & Sabatini, D. M. (2012) · Cell · doi:10.1016/j.cell.2012.03.017 · Cited by 8,509
mTOR Signaling in Growth, Metabolism, and Disease
Saxton, R. A., & Sabatini, D. M. (2017) · Cell · doi:10.1016/j.cell.2017.02.004 · Cited by 7,555
Phosphorylation and regulation of Akt/PKB by the rictor-mTOR complex
Sarbassov, D. D., Guertin, D. A., Ali, S. M., & Sabatini, D. M. (2005) · Science · doi:10.1126/science.1106148 · Cited by 6,216
mTOR: from growth signal integration to cancer, diabetes and ageing
Zoncu, R., Efeyan, A., & Sabatini, D. M. (2011) · Nature Reviews Molecular Cell Biology · doi:10.1038/nrm3025 · Cited by 3,941
A DNA damage checkpoint response in telomere-initiated senescence
Fagagna, F. D. D., Reaper, P. M., Clay-Farrace, L., Fiegler, H., Carr, P., von Zglinicki, T., Saretzki, G., Carter, N. P., & Jackson, S. P. (2003) · Nature · doi:10.1038/nature02118 · Cited by 2,917
Sarbassov, D. D., Ali, S. M., Kim, D.-H., Guertin, D. A., Latek, R. R., Erdjument-Bromage, H., Tempst, P., & Sabatini, D. M. (2004) · Current Biology · doi:10.1016/j.cub.2004.06.054 · Cited by 2,665
Mammalian TOR complex 2 controls the actin cytoskeleton and is rapamycin insensitive
Jacinto, E., Loewith, R., Schmidt, A., Lin, S., Rüegg, M. A., Hall, A., & Hall, M. N. (2004) · Nature Cell Biology · doi:10.1038/ncb1183 · Cited by 2,097
Crucial role of p53-dependent cellular senescence in suppression of Pten-deficient tumorigenesis
Chen, Z., Trotman, L. C., Shaffer, D., Lin, H.-K., Dotan, Z. A., Niki, M., Koutcher, J. A., Scher, H. I., Ludwig, T., Gerald, W., et al. (2005) · Nature · doi:10.1038/nature03918 · Cited by 1,993
Oncogene-induced senescence is part of the tumorigenesis barrier imposed by DNA damage checkpoints
Bartkova, J., Rezaei, N., Liontos, M., Karakaidos, P., Kletsas, D., Issaeva, N., Vassiliou, L.-V. F., Kolettas, E., Niforou, K., Zoumpourlis, V. C., et al. (2006) · Nature · doi:10.1038/nature05268 · Cited by 1,986
The functions and regulation of the PTEN tumour suppressor
Song, M. S., Salmena, L., & Pandolfi, P. P. (2012) · Nature Reviews Molecular Cell Biology · doi:10.1038/nrm3330 · Cited by 1,926
Oncogene-induced senescence is a DNA damage response triggered by DNA hyper-replication
Di Micco, R., Fumagalli, M., Cicalese, A., Piccinin, S., Gasparini, P., Luise, C., Schurra, C., Garre’, M., Giovanni Nuciforo, P., Bensimon, A., et al. (2006) · Nature · doi:10.1038/nature05327 · Cited by 1,821
Raptor, a Binding Partner of Target of Rapamycin (TOR), Mediates TOR Action
Hara, K., Maruki, Y., Long, X., Yoshino, K.-I., Oshiro, N., Sujuti, H., Tokunaga, C., Avruch, J., & Yonezawa, K. (2002) · Cell · doi:10.1016/s0092-8674(02)00833-4 · Cited by 1,810
Kruse, J.-P., & Gu, W. (2009) · Cell · doi:10.1016/j.cell.2009.04.050 · Cited by 1,610
Lowe, S. W., Cepero, E., & Evan, G. I. (2004) · Nature · doi:10.1038/nature03098 · Cited by 1,374
PRAS40 is an insulin-regulated inhibitor of the mTORC1 protein kinase
Sancak, Y., Thoreen, C. C., Peterson, T. R., Lindquist, R. A., Kang, S. A., Spooner, E., Carr, S. A., & Sabatini, D. M. (2007) · Molecular Cell · doi:10.1016/j.molcel.2007.03.003 · Cited by 1,236
García-Martínez, J. M., & Alessi, D. R. (2008) · Biochemical Journal · doi:10.1042/bj20081668 · Cited by 907
Bhaskar, P. T., & Hay, N. (2007) · Developmental Cell · doi:10.1016/j.devcel.2007.03.020 · Cited by 798
Nogueira, V., Park, Y., Chen, C.-C., Xu, P.-Z., Chen, M.-L., Tonic, I., Unterman, T., & Hay, N. (2008) · Cancer Cell · doi:10.1016/j.ccr.2008.11.003 · Cited by 780
Facchinetti, V., Ouyang, W., Wei, H., Soto, N., Lazorchak, A. S., Gould, C. M., Lowry, C. J., Newton, A. C., Mao, Y., Miao, Q., et al. (2008) · The EMBO Journal · doi:10.1038/emboj.2008.120 · Cited by 527
Inside and out: the activities of senescence in cancer
Pérez-Mancera, P. A., Young, A. R. J., & Narita, M. (2014) · Nature Reviews Cancer · doi:10.1038/nrc3773 · Cited by 462
Dynamic Adipocyte Phosphoproteome Reveals that Akt Directly Regulates mTORC2
Humphrey, S. J., Yang, G., Yang, P., Fazakerley, D. J., Stöckli, J., Yang, J. Y. H., & James, D. E. (2013) · Cell Metabolism · doi:10.1016/j.cmet.2013.04.010 · Cited by 412
Many roads lead to oncogene-induced senescence
Courtois-Cox, S., Jones, S. L., & Cichowski, K. (2008) · Oncogene · doi:10.1038/sj.onc.1210950 · Cited by 397
Alimonti, A., Nardella, C., Chen, Z., Clohessy, J. G., Carracedo, A., Trotman, L. C., Cheng, K., Varmeh, S., Kozma, S. C., Thomas, G., et al. (2010) · Journal of Clinical Investigation · doi:10.1172/jci40535 · Cited by 374
p53 isoforms Δ133p53 and p53β are endogenous regulators of replicative cellular senescence
Fujita, K., Mondal, A. M., Horikawa, I., Nguyen, G. H., Kumamoto, K., Sohn, J. J., Bowman, E. D., Mathe, E. A., Schetter, A. J., Pine, S. R., et al. (2009) · Nature Cell Biology · doi:10.1038/ncb1928 · Cited by 336
Miyauchi, H., Minamino, T., Tateno, K., Kunieda, T., Toko, H., & Komuro, I. (2004) · The EMBO Journal · doi:10.1038/sj.emboj.7600045 · Cited by 335
Inactivation of p53 and Pten promotes invasive bladder cancerPreprint
Puzio‐Kuter, A. M., Castillo-Martín, M., Kinkade, C. W., Wang, X., Shen, T. H., Matos, T., Shen, M. M., Cordon‐Cardo, C., & Abate-Shen, C. T. (2009) · Genes & Development · doi:10.1101/gad.1772909 · Cited by 334
Astle, M. V., Hannan, K. M., Ng, P. Y., Lee, R. S., George, A. J., Hsu, A. K., Haupt, Y., Hannan, R. D., & Pearson, R. B. (2012) · Oncogene · doi:10.1038/onc.2011.394 · Cited by 295
The choice between p53-induced senescence and quiescence is determined in part by the mTOR pathway.
Korotchkina, L. G., Leontieva, O. V., Bukreeva, E. I., Demidenko, Z. N., Gudkov, A. V., & Blagosklonny, M. V. (2010) · Aging · doi:10.18632/aging.100160 · Cited by 278
Oncogene-induced senescence: the bright and dark side of the response
Gorgoulis, V. G., & Halazonetis, T. D. (2010) · Current Opinion in Cell Biology · doi:10.1016/j.ceb.2010.07.013 · Cited by 257
Lee, J.-J., Kim, B. C., Park, M.-J., Lee, Y., Kim, Y.-N., Lee, B. L., & Js, L. (2010) · Cell Death and Differentiation · doi:10.1038/cdd.2010.139 · Cited by 179
Self-citationVilella-Bach, M., Nuzzi, P., Fang, Y., & Chen, J. (1999) · Journal of Biological Chemistry · doi:10.1074/jbc.274.7.4266 · Cited by 154
Attenuation of TORC1 signaling delays replicative and oncogenic RAS-induced senescence
Kolesnichenko, M., Hong, L., Liao, R., Vogt, P. K., & Sun, P. (2012) · Cell Cycle · doi:10.4161/cc.20683 · Cited by 123
Non-Cell-Autonomous Regulation of Cellular Senescence in Cancer
Mitri, D. D., & Alimonti, A. (2015) · Trends in Cell Biology · doi:10.1016/j.tcb.2015.10.005 · Cited by 92
Crosstalk between mTOR complexes
Xie, J., & Proud, C. G. (2013) · Nature Cell Biology · doi:10.1038/ncb2877 · Cited by 59
Moral, M., Segrelles, C., Lara, M. F., Martínez‐Cruz, A. B., Lorz, C., Santos, M., García‐Escudero, R., Lu, J., Kiguchi, K., Buitrago, A., et al. (2009) · Cancer Research · doi:10.1158/0008-5472.can-08-3240 · Cited by 56
A GPI processing phospholipase A2, PGAP6, modulates Nodal signaling in embryos by shedding CRIPTO
Lee, G., Fujita, M., Takaoka, K., Murakami, Y., Fujihara, Y., Kanzawa, N., Murakami, K.-I., Kajikawa, E., Takada, Y. K., Saito, K., et al. (2016) · The Journal of Cell Biology · doi:10.1083/jcb.201605121 · Cited by 50
Heparan sulfation is essential for the prevention of cellular senescence
Jung, S. H., Lee, H. C., Yu, D.-M., Kim, B., Park, S. M., Lee, Y., Park, H. J., Ko, Y.-G., & Lee, J.-S. (2015) · Cell Death and Differentiation · doi:10.1038/cdd.2015.107 · Cited by 45
Self-citation
Cited by
Sorted by citations
Senescence and cancer — role and therapeutic opportunities
Schmitt, C. A., Wang, B., & Demaria, M. (2022) · Nature Reviews Clinical Oncology · doi:10.1038/s41571-022-00668-4 · Cited by 794
Role of p53 in the Regulation of Cellular Senescence
Mijit, M., Caracciolo, V., Melillo, A., Amicarelli, F., & Giordano, A. (2020) · Biomolecules · doi:10.3390/biom10030420 · Cited by 639
Senescence of Alveolar Stem Cells Drives Progressive Pulmonary Fibrosis
Yao, C., Guan, X., Carraro, G., Parimon, T., Liu, X., Huang, G., Mulay, A., Soukiasian, H. J., David, G., WEIGT, S. S., et al. (2019) · American Journal of Respiratory and Critical Care Medicine · doi:10.1164/rccm.202004-1274oc · Cited by 541
mTOR substrate phosphorylation in growth control
Battaglioni, S., Benjamin, D., Wälchli, M., Maier, T., & Hall, M. N. (2022) · Cell · doi:10.1016/j.cell.2022.04.013 · Cited by 443
Bao, H., Cao, J., Chen, M., Min, C., Chen, W., Chen, X., Chen, Y., Chen, Y., Chen, Y., Chen, Z., et al. (2023) · Science China Life Sciences · doi:10.1007/s11427-023-2305-0 · Cited by 402
Metadata
- Authors
- Jung, S. H., Hwang, H. J., Kang, D., Park, H. A., Lee, H. C., Jeong, D., Lee, K., Park, H. J., Ko, Y.-G., & Lee, J.-S.
- Affiliations
- Inha University (KR)
- Hallym University (KR)
- Korea University (KR)
- Corresponding author
- Lee, Jae-Seon
- Venue
- Oncogene
- Published
- 2018-10-18
- Volume
- 38
- Issue
- 10
- Pages
- 1639-1650
- ISSN
- 0950-9232 (ISSN-L)
- 1476-5594
- PMC
- PMC6755978
- OpenAlex
- W2897025166
- Cited by
- 166
- References
- 39
- Citations by year
- 2026: 15 · 2025: 18 · 2024: 36 · 2023: 20 · 2022: 28 · 2021: 21 · 2020: 19 · 2019: 9
- FWCI
- 4.36
- Type
- journal article
- Language
- en
- Open access
- hybrid
- doi.org
- Licence
- Locations
- Oncogene (publishedVersion, cc-by)
- PubMed Central (publishedVersion, cc-by)
- PubMed (publishedVersion)
- Funders
- National Research Foundation (2014R1A5A2009392)
- Ministry of Science and ICT, South Korea
- University of Illinois at Urbana-Champaign
- Medical Research Council
- Topics
- Life Sciences › Biochemistry, Genetics and Molecular Biology › Molecular Biology › PI3K/AKT/mTOR signaling in cancer
- Life Sciences › Biochemistry, Genetics and Molecular Biology › Cell Biology › Telomeres, Telomerase, and Senescence
- Health Sciences › Medicine › Oncology › Cancer-related Molecular Pathways
- Keywords
- mTOR, PTEN loss, cellular senescence, p53 phosphorylation, p21, MDM2, mTORC1, mTORC2, PI3K/Akt signaling, p53 stabilization, Pten knockout mice, embryonic fibroblasts, tumor suppression
- MeSH terms
- Mechanistic Target of Rapamycin Complex 1, Mechanistic Target of Rapamycin Complex 2, Animals, Fibroblasts, Humans, Phosphorylation, Signal Transduction, Tumor Suppressor Protein p53, Cellular Senescence, Cell Proliferation, PTEN Phosphohydrolase, Mice, TOR Serine-Threonine Kinases, MCF-7 Cells
About these checks
Registry, retraction, Cites and statistics results are computed, not judged, with one exception: a printed reference that no index lists is read once by a model before it counts as a citation error. Claims are extracted by a model and kept only when their quote appears verbatim in the text; each cited source is then checked, with a model’s help, for whether it says what the claim relies on. Those verdicts can be wrong — read the claim’s quote and the cited source before relying on one.
Statistics and arithmetic are recomputed, not judged.
Confidence bands are shown only for fields calibrated on our annotated test set. None is calibrated yet, so no band is shown.
What counts as a claim ›How we measure confidence ›How we check this ›
Are you an author, or do you see a problem with this page? Request a review
