

Defining data-driven subgroups of obsessive–compulsive disorder with different treatment responses based on resting-state functional connectivity
Open accessThe DOI matches its Crossref record; 81 of the 81 references it cites were found in a registry or an index.
Abstract
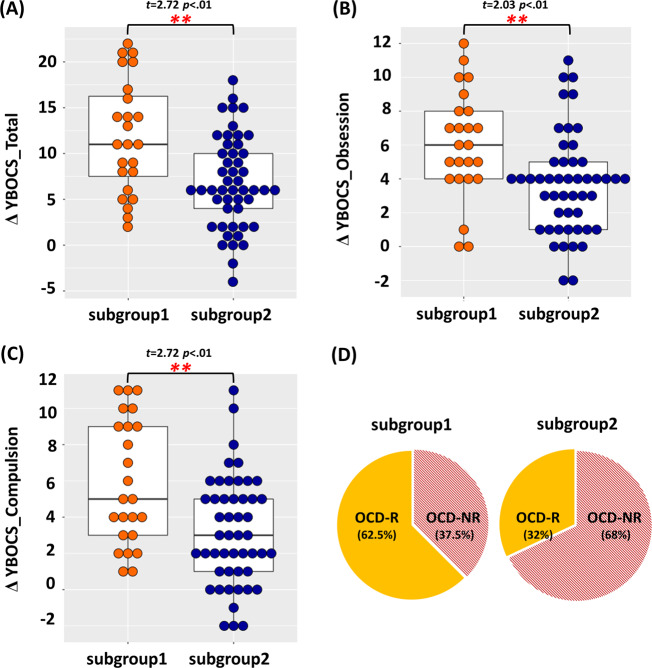
Characterization of obsessive–compulsive disorder (OCD), like other psychiatric disorders, suffers from heterogeneities in its symptoms and therapeutic responses, and identification of more homogeneous subgroups may help to resolve the heterogeneity. We aimed to identify the OCD subgroups based on resting-state functional connectivity (rsFC) and to explore their differences in treatment responses via a multivariate approach. From the resting-state functional MRI data of 107 medication-free OCD patients and 110 healthy controls (HCs), we selected rsFC features, which discriminated OCD patients from HCs via support vector machine (SVM) analyses. With the selected brain features, we subdivided OCD patients into subgroups using hierarchical clustering analyses. We identified 35 rsFC features that achieved a high sensitivity (82.74%) and specificity (76.29%) in SVM analyses. The OCD patients were subdivided into two subgroups, which did not show significant differences in their demographic and clinical backgrounds. However, one of the OCD subgroups demonstrated more impaired rsFC that was involved either within the default mode network (DMN) or between DMN brain regions and other network regions. This subgroup also showed both lower improvements in symptom severity in the 16-week follow-up visit and lower responder percentage than the other subgroup. Our results highlight that not only abnormalities within the DMN but also aberrant rsFC between the DMN and other networks may contribute to the treatment response and support the importance of these neurobiological alterations in OCD patients. We suggest that abnormalities in these connectivity may play predictive biomarkers of treatment response, and aid to build more optimal treatment strategies.
Overview
The claims and statistics of this paper haven’t been checked yet.
Free: it reads the open-access text and checks the first 5 claims that cite a source we can check. Create a free account to check every claim.
Integrity signals
Registry
Cites
Statistics
Figures


Verification
Claims the paper makes
The claims and statistics of this paper haven’t been checked yet.
Free: it reads the open-access text and checks the first 5 claims that cite a source we can check. Create a free account to check every claim.
Claims other papers make about this one
Each is checked against this paper’s own text: does it say what the citing paper says it does?
The source backs part of the claim, not all of it — or backs it for a different population, condition or comparison.
In the citing paper
“Other studies have attempted to identify predictors of therapeutic response in OCD patients, but the wide diversity of methodologies and outcomes makes it difficult to identify precise and reproducible markers of resistance [47–53].”
From Error-Related Brain Potentials as Biomarkers of Pathology Severity and Treatment Resistance in Patients With Obsessive-Compulsive Disorder (2026) · cites this paper as [48]
Experimental — accuracy not yet measured
Self-check
Percentages, sums and reported differences re-computed from the paper’s own numbers.
The self-check needs the paper’s full text.
Citations
Cites
Scikit-learn: Machine Learning in Python
Pedregosa, F., Varoquaux, G., Gramfort, A., Michel, V., Thirion, B., Grisel, O., Blondel, M., Müller, A., Nothman, J., Louppe, G., et al. (2012) · arXiv · doi:10.48550/arxiv.1201.0490 · Cited by 71,016
Cortes, C., & Vapnik, V. (1995) · Machine Learning · doi:10.1007/bf00994018 · Cited by 59,421
Cortes, C., & Vapnik, V. (1995) · Machine-mediated learning · doi:10.1023/a:1022627411411 · Cited by 48,445
Dermatologist-level classification of skin cancer with deep neural networks
Esteva, A., Kuprel, B., Novoa, R. A., Ko, J., Swetter, S. M., Blau, H. M., & Thrun, S. (2017) · Nature · doi:10.1038/nature21056 · Cited by 14,362
The Elements of Statistical Learning: Data Mining, Inference, and Prediction
John Lu, Z. Q. (2010) · Journal of the Royal Statistical Society Series A: Statistics in Society · doi:10.1111/j.1467-985x.2010.00646_6.x · Cited by 12,390
Complex brain networks: graph theoretical analysis of structural and functional systems
Bullmore, E., & Sporns, O. (2009) · Nature Reviews Neuroscience · doi:10.1038/nrn2575 · Cited by 11,820
The Yale-Brown Obsessive Compulsive Scale: I. Development, Use, and Reliability
Goodman, W. K. (1989) · Archives of General Psychiatry · doi:10.1001/archpsyc.1989.01810110048007 · Cited by 7,712
Conn : A Functional Connectivity Toolbox for Correlated and Anticorrelated Brain Networks
Whitfield-Gabrieli, S., & Nieto-Castanon, A. (2012) · Brain Connectivity · doi:10.1089/brain.2012.0073 · Cited by 4,885
A component based noise correction method (CompCor) for BOLD and perfusion based fMRI
Behzadi, Y., Restom, K., Liau, J., & Liu, T. T. (2007) · NeuroImage · doi:10.1016/j.neuroimage.2007.04.042 · Cited by 4,502
What is a support vector machine?
Noble, W. S. (2006) · Nature Biotechnology · doi:10.1038/nbt1206-1565 · Cited by 4,301
Research works printed but not linked: 1
- Keutmann, M. K., Fitzgerald, D. A., Phan, K. L. & Klumpp, H. Cognitive behavioral therapy normalizes prefrontal-amygdala resting state functional connectivity in social anxiety disorder. Biol. Psychiatry 75, 226s–226s (2014).
Cited by
Brucar, L. R., Feczko, E., Fair, D. A., & Zilverstand, A. (2022) · Biological Psychiatry · doi:10.1016/j.biopsych.2022.12.020 · Cited by 63
Neurocircuit models of obsessive-compulsive disorder: limitations and future directions for research
Shephard, E., Batistuzzo, M. C., Hoexter, M. Q., Stern, E. R., Zuccolo, P. F., Ogawa, C. Y., da Silva, R. D. M. F., Brunoni, A. R., Costa, D. L. D. C., Doretto, V. F., et al. (2021) · Brazilian Journal of Psychiatry · doi:10.1590/1516-4446-2020-1709 · Cited by 43
Beyond Feared Outcomes: Exploring Sensory Phenomena as a Novel Therapeutic Target for OCD
Díaz, D. E., & Fitzgerald, K. D. (2025) · American Journal of Psychiatry · doi:10.1176/appi.ajp.20241213 · Cited by 32
Robust sex differences in functional brain connectivity are present in utero
Cook, K. M., De Asis-Cruz, J., Lopez, C., Quistorff, J., Kapse, K., Andersen, N., Vezina, G., & Limperopoulos, C. (2023) · Cerebral Cortex · doi:10.1093/cercor/bhac218 · Cited by 31
Wang, Y., Qin, Y. F., Li, H., Yao, D., Sun, B., Gong, J., Dai, Y., Wen, C., Zhang, L., Zhang, C., et al. (2021) · Frontiers in Neuroscience · doi:10.3389/fnins.2021.665578 · Cited by 24
Metadata
- Authors
- Kwak, S., Kim, M., Kim, T., Kwak, Y., Oh, S., Lho, S. K., Moon, S.-Y., Lee, T. Y., & Kwon, J. S.
- Affiliations
- Seoul National University (KR)
- Corresponding author
- Kwon, Jun Soo
- ORCID
- Venue
- Translational Psychiatry
- Published
- 2020-10-26
- Volume
- 10
- Issue
- 1
- Pages
- 359-359
- ISSN
- 2158-3188 (ISSN-L)
- PMC
- PMC7589530
- OpenAlex
- W3094562254
- Cited by
- 22
- References
- 80
- Citations by year
- 2026: 5 · 2025: 2 · 2024: 1 · 2023: 3 · 2022: 5 · 2021: 6
- FWCI
- 1.40
- Type
- journal article
- Language
- en
- Open access
- gold
- doi.org
- Licence
- cc-by
- creativecommons.org/licenses/by/4.0 (tdm)
- creativecommons.org/licenses/by/4.0 (vor)
- Locations
- Translational Psychiatry (publishedVersion, cc-by)
- PubMed Central (publishedVersion, cc-by)
- PubMed (publishedVersion)
- Seoul National University Open Repository (Seoul National University) (submittedVersion)
- Funders
- National Research Foundation of Korea (2019R1A2B5B03100844, 2018R1A4A1025891)
- Topics
- Social Sciences › Psychology › Clinical Psychology › Obsessive-Compulsive Spectrum Disorders
- Life Sciences › Neuroscience › Cognitive Neuroscience › Functional Brain Connectivity Studies
- Social Sciences › Psychology › Experimental and Cognitive Psychology › Mental Health Research Topics
- Keywords
- obsessive-compulsive disorder, resting-state functional connectivity, treatment response prediction, default mode network, treatment-resistant OCD, symptom severity, predictive biomarkers, subgroup classification
- MeSH terms
- Brain, Brain Mapping, Humans, Magnetic Resonance Imaging, Obsessive-Compulsive Disorder
About these checks
Registry, retraction, Cites and statistics results are computed, not judged, with one exception: a printed reference that no index lists is read once by a model before it counts as a citation error. Claims are extracted by a model and kept only when their quote appears verbatim in the text; each cited source is then checked, with a model’s help, for whether it says what the claim relies on. Those verdicts can be wrong — read the claim’s quote and the cited source before relying on one.
Statistics and arithmetic are recomputed, not judged.
Confidence bands are shown only for fields calibrated on our annotated test set. None is calibrated yet, so no band is shown.
What counts as a claim ›How we measure confidence ›How we check this ›
Are you an author, or do you see a problem with this page? Request a review
How to cite
Cite CoChat for the checks on this page, and the paper for its own findings.
- This page
- CoChat. (2026). Citation check: Defining data-driven subgroups of obsessive–compulsive disorder with different treatment responses based on resting-state functional connectivity. https://app.cochat.ai/papers/10.1038/s41398-020-01045-4
- The paper
- Kwak, S., Kim, M., Kim, T., Kwak, Y., Oh, S., Lho, S. K., Moon, S.-Y., Lee, T. Y., & Kwon, J. S. (2020). Defining data-driven subgroups of obsessive–compulsive disorder with different treatment responses based on resting-state functional connectivity. Translational Psychiatry. https://doi.org/10.1038/s41398-020-01045-4
Data sources
Bibliographic data: Semantic Scholar, OpenAlex, Crossref.
Contains information from the Semantic Scholar Academic Graph Datasets, made available under the ODC Attribution License (ODC-BY 1.0).
Semantic Scholar’s data is described in: Kinney, R., et al. (2023). The Semantic Scholar Open Data Platform. arXiv:2301.10140.
