Student or educator? Sign up with your school email and get 6 months of Pro free.
CoChat

The DOI matches its Crossref record; 48 of the 48 references it cites were found in a registry or an index.

DMP1 prevents osteocyte alterations, FGF23 elevation and left ventricular hypertrophy in mice with chronic kidney disease

Open access

Abstract

During chronic kidney disease (CKD), alterations in bone and mineral metabolism include increased production of the hormone fibroblast growth factor 23 (FGF23) that may contribute to cardiovascular mortality. The osteocyte protein dentin matrix protein 1 (DMP1) reduces FGF23 and enhances bone mineralization, but its effects in CKD are unknown. We tested the hypothesis that DMP1 supplementation in CKD would improve bone health, prevent FGF23 elevations and minimize consequent adverse cardiovascular outcomes. We investigated DMP1 regulation and effects in wild-type (WT) mice and the Col4a3−/− mouse model of CKD. Col4a3−/− mice demonstrated impaired kidney function, reduced bone DMP1 expression, reduced bone mass, altered osteocyte morphology and connectivity, increased osteocyte apoptosis, increased serum FGF23, hyperphosphatemia, left ventricular hypertrophy (LVH), and reduced survival. Genetic or pharmacological supplementation of DMP1 in Col4a3−/− mice prevented osteocyte apoptosis, preserved osteocyte networks, corrected bone mass, partially lowered FGF23 levels by attenuating NFAT-induced FGF23 transcription, and further increased serum phosphate. Despite impaired kidney function and worsened hyperphosphatemia, DMP1 prevented development of LVH and improved Col4a3−/− survival. Our data suggest that CKD reduces DMP1 expression, whereas its restoration represents a potential therapeutic approach to lower FGF23 and improve bone and cardiac health in CKD.

Overview

The claims and statistics of this paper haven’t been checked yet.

Free: it reads the open-access text and checks the first 5 claims that cite a source we can check. Create a free account to check every claim.

A few free checks a day · papers already verified open instantly · results are public

Integrity signals

Registry

Crossref · 10.1038/s41413-019-0051-1

Cites

48 of 48 references verified0 citation errors · 0 not checkable

Statistics

Figures

Fig. 1 DMP1 deficiency and supplementation in Col4a3−/− mice with advanced CKD. a–b DMP1 mRNA expression in whole bone, kidney and heart of a 20 week-old B6 WT, DMP1TG, Col4a3−/−, and Col4a3−/−/DMP1TG mice and whole bone of b 9-week-old 129sv WT and Col4a3−/− mice treated with mouse recombinant his-tagged DMP1 or saline control once a day for one week. c Bright-field microscopy of DMP1 immunostaining in cortical bone of B6 WT and Col4a3−/− mice (scale bar = 50 µm). d His-tag specific immunodetection of DMP1 in bone of 129 Sv WT and Col4a3−/− mice injected with mouse recombinant his-tagged DMP1 or saline control once a day for one week. Staining is detected in DMP1-injected animals only and shows incorporation of DMP1 around blood vessels of cortical bone and in bone marrow. Values are expressed as mean ± SEM; n = 5 mice/group. aP < 0.05 vs. WT
Fig. 1 DMP1 deficiency and supplementation in Col4a3−/− mice with advanced CKD. a–b DMP1 mRNA expression in whole bone, kidney and heart of a 20 week-old B6 WT, DMP1TG, Col4a3−/−, and Col4a3−/−/DMP1TG mice and whole bone of b 9-week-old 129sv WT and Col4a3−/− mice treated with mouse recombinant his-tagged DMP1 or saline control once a day for one week. c Bright-field microscopy of DMP1 immunostaining in cortical bone of B6 WT and Col4a3−/− mice (scale bar = 50 µm). d His-tag specific immunodetection of DMP1 in bone of 129 Sv WT and Col4a3−/− mice injected with mouse recombinant his-tagged DMP1 or saline control once a day for one week. Staining is detected in DMP1-injected animals only and shows incorporation of DMP1 around blood vessels of cortical bone and in bone marrow. Values are expressed as mean ± SEM; n = 5 mice/group. aP < 0.05 vs. WTCC BY · PubMed Central
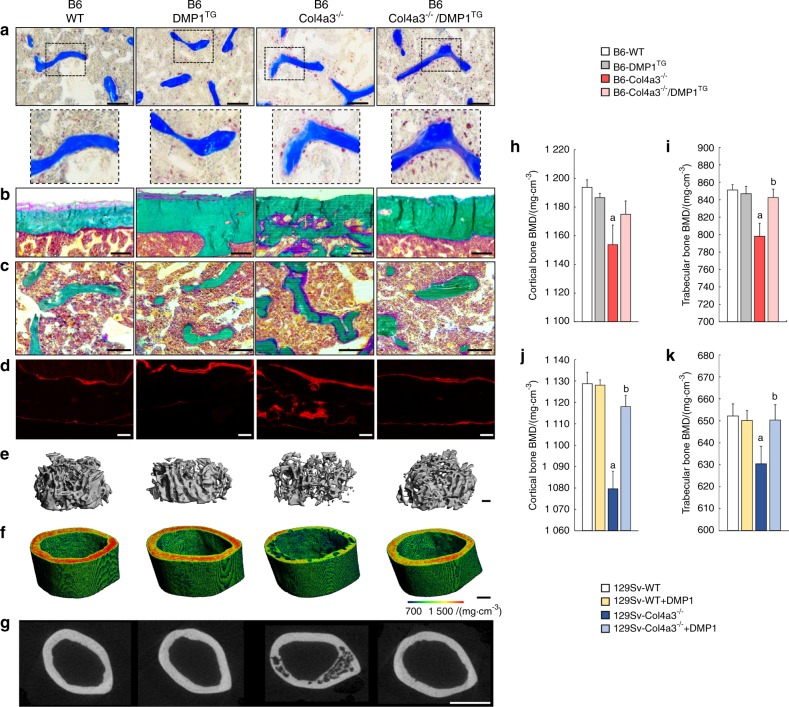
Fig. 2 DMP1 restores bone mineralization in Col4a3−/− mice with advanced CKD. Bone phenotype analyses of femurs from 23-week-old B6 WT, DMP1TG, and Col4a3−/− and Col4a3−/−/DMP1TG mice (a–i) and 9-week-old 129sv WT and Col4a3−/− mice treated with DMP1 or saline control for 1 week (j–k). a Bright-field microscopy of TRAcP staining showing osteoclasts in trabecular bone (scale bar = 100 µm). b, c Bright-field microscopy of modified trichrome Goldner staining of cortical and trabecular bone (scale bar = 100 µm). d Fluorescent microscopy of alizarin red S double labeling in cortical bone (scale bar = 100 µm). e, f 3D microtomography of secondary spongiosa trabecular bone and midshaft cortical bone (scale bar = 200 µm). The degree of mineralization is represented by the heatmap. g 2D microtomography of midshaft cortical bone (scale bar = 1 mm). h–k 3D-microtomography analysis of cortical and trabecular bone mineral density (BMD) showing impaired mineralization in Col4a3−/− mice and correction of impaired mineralization in Col4a3−/− mice with DMP1 supplementation. Values are expressed as mean ± SEM; n ≥ 6/group. P < 0.05 vs. a WT, b Col4a3−/−
Fig. 2 DMP1 restores bone mineralization in Col4a3−/− mice with advanced CKD. Bone phenotype analyses of femurs from 23-week-old B6 WT, DMP1TG, and Col4a3−/− and Col4a3−/−/DMP1TG mice (a–i) and 9-week-old 129sv WT and Col4a3−/− mice treated with DMP1 or saline control for 1 week (j–k). a Bright-field microscopy of TRAcP staining showing osteoclasts in trabecular bone (scale bar = 100 µm). b, c Bright-field microscopy of modified trichrome Goldner staining of cortical and trabecular bone (scale bar = 100 µm). d Fluorescent microscopy of alizarin red S double labeling in cortical bone (scale bar = 100 µm). e, f 3D microtomography of secondary spongiosa trabecular bone and midshaft cortical bone (scale bar = 200 µm). The degree of mineralization is represented by the heatmap. g 2D microtomography of midshaft cortical bone (scale bar = 1 mm). h–k 3D-microtomography analysis of cortical and trabecular bone mineral density (BMD) showing impaired mineralization in Col4a3−/− mice and correction of impaired mineralization in Col4a3−/− mice with DMP1 supplementation. Values are expressed as mean ± SEM; n ≥ 6/group. P < 0.05 vs. a WT, b Col4a3−/−CC BY · PubMed Central
Fig. 3 DMP1 prevents CKD-induced alterations of osteocyte morphology, networks and apoptosis. Cortical bone osteocyte analyses in 20-week-old B6 WT, DMP1TG, and Col4a3−/− and Col4a3−/−/DMP1TG mice and 9-week-old 129sv WT and Col4a3−/− mice treated with DMP1 or saline control for one week. a Acid-etched scanning electron microscopy of cortical bone showing correction of osteocyte morphology in Col4a3−/− bones following DMP1 supplementation (scale bar = 10 µm). b FITC—Imaris analysis of cortical bone showing impaired osteocyte networks in Col4a3−/− cortical bone and correction of the networks following treatment with DMP1. c–f Quantification of FITC-Imaris analysis (b) showing impaired parameters of osteocyte networks and morphology in Col4a3−/− and correction of these parameters following treatment with DMP1. g, h Bright-field microscopy of TUNEL staining on cortical bone and quantification of TUNEL-positive osteocytes. Values are expressed as mean ± SEM; n ≥ 3/group. P < 0.05 vs. a WT, b Col4a3−/−
Fig. 3 DMP1 prevents CKD-induced alterations of osteocyte morphology, networks and apoptosis. Cortical bone osteocyte analyses in 20-week-old B6 WT, DMP1TG, and Col4a3−/− and Col4a3−/−/DMP1TG mice and 9-week-old 129sv WT and Col4a3−/− mice treated with DMP1 or saline control for one week. a Acid-etched scanning electron microscopy of cortical bone showing correction of osteocyte morphology in Col4a3−/− bones following DMP1 supplementation (scale bar = 10 µm). b FITC—Imaris analysis of cortical bone showing impaired osteocyte networks in Col4a3−/− cortical bone and correction of the networks following treatment with DMP1. c–f Quantification of FITC-Imaris analysis (b) showing impaired parameters of osteocyte networks and morphology in Col4a3−/− and correction of these parameters following treatment with DMP1. g, h Bright-field microscopy of TUNEL staining on cortical bone and quantification of TUNEL-positive osteocytes. Values are expressed as mean ± SEM; n ≥ 3/group. P < 0.05 vs. a WT, b Col4a3−/−CC BY · PubMed Central
Fig. 4 DMP1 reduces serum FGF23 in CKD independently of kidney function. Serum and urine biochemistry analysis of a–j 20 week-old B6 WT, DMP1TG, Col4a3−/−, and Col4a3−/−/DMP1TG mice and of k–n) 6- and 9-week-old 129 Sv WT and Col4a3−/− treated with mouse recombinant DMP1 or saline for one week. a–d Serum levels of total FGF23 (cFGF23), intact FGF23 (iFGF23), phosphate and 24 h urine phosphate levels. e–h Serum levels of 1,25(OH)2D, parathyroid hormone (PTH), calcium and 24 h urine calcium levels. i Serum blood urea nitrogen (BUN) levels. j Klotho mRNA expression in the kidney. k Serum BUN levels. l–n Serum cFGF23, iFGF23, and phosphate levels. o FGF23 mRNA expression in whole bone from 129 Sv WT and Col4a3−/− mice with early CKD (6 weeks) and advanced CKD (9 weeks) injected daily with mouse recombinant DMP1 or saline control for one week. Values are expressed as mean ± SEM; n ≥ 5 mice/group. P < 0.05 vs. a WT, b Col4a3−/−
Fig. 4 DMP1 reduces serum FGF23 in CKD independently of kidney function. Serum and urine biochemistry analysis of a–j 20 week-old B6 WT, DMP1TG, Col4a3−/−, and Col4a3−/−/DMP1TG mice and of k–n) 6- and 9-week-old 129 Sv WT and Col4a3−/− treated with mouse recombinant DMP1 or saline for one week. a–d Serum levels of total FGF23 (cFGF23), intact FGF23 (iFGF23), phosphate and 24 h urine phosphate levels. e–h Serum levels of 1,25(OH)2D, parathyroid hormone (PTH), calcium and 24 h urine calcium levels. i Serum blood urea nitrogen (BUN) levels. j Klotho mRNA expression in the kidney. k Serum BUN levels. l–n Serum cFGF23, iFGF23, and phosphate levels. o FGF23 mRNA expression in whole bone from 129 Sv WT and Col4a3−/− mice with early CKD (6 weeks) and advanced CKD (9 weeks) injected daily with mouse recombinant DMP1 or saline control for one week. Values are expressed as mean ± SEM; n ≥ 5 mice/group. P < 0.05 vs. a WT, b Col4a3−/−CC BY · PubMed Central
Fig. 5 DMP1 inhibits FGF23 transcription through regulation of NFAT1 signaling. a, b Serum levels of total FGF23 (cFGF23) in B6 WT and DMP1TG mice 6 h after saline, calcium chloride (3%) and/or NFAT inhibitor (10 µg·g–1) treatment. c FGF23 mRNA expression in untreated and calcium-treated (12 mmol·L–1) primary osteoblasts (BMSCs) isolated from B6 WT and DMP1TG mice. d, e FGF23 promoter activity in MC3T3-E1 osteoblasts transfected with an intact (p[FGF23WT/Luc]) or NFAT mutant (p[FGF23NFAT/Luc]) FGF23 promoter reporter and treated with mouse recombinant DMP1, calcium and/or NFAT inhibitor. f NFAT1 mRNA expression in cortical bone of B6 WT, DMP1TG, Col4a3−/−, and Col4a3−/−/DMP1TG mice. Values are expressed as mean ± SEM; n ≥ 5/group. P < 0.05 vs. a WT or control, b Col4a3−/− or calcium (3% and 6 mmol·L–1), c calcium (12 mmol·L–1), d calcium (12 mmol·L–1) + DMP1 (10 ng·mL–1), e calcium (12 mmol·L–1) + NFAT inhibitor (1 µg·mL–1)
Fig. 5 DMP1 inhibits FGF23 transcription through regulation of NFAT1 signaling. a, b Serum levels of total FGF23 (cFGF23) in B6 WT and DMP1TG mice 6 h after saline, calcium chloride (3%) and/or NFAT inhibitor (10 µg·g–1) treatment. c FGF23 mRNA expression in untreated and calcium-treated (12 mmol·L–1) primary osteoblasts (BMSCs) isolated from B6 WT and DMP1TG mice. d, e FGF23 promoter activity in MC3T3-E1 osteoblasts transfected with an intact (p[FGF23WT/Luc]) or NFAT mutant (p[FGF23NFAT/Luc]) FGF23 promoter reporter and treated with mouse recombinant DMP1, calcium and/or NFAT inhibitor. f NFAT1 mRNA expression in cortical bone of B6 WT, DMP1TG, Col4a3−/−, and Col4a3−/−/DMP1TG mice. Values are expressed as mean ± SEM; n ≥ 5/group. P < 0.05 vs. a WT or control, b Col4a3−/− or calcium (3% and 6 mmol·L–1), c calcium (12 mmol·L–1), d calcium (12 mmol·L–1) + DMP1 (10 ng·mL–1), e calcium (12 mmol·L–1) + NFAT inhibitor (1 µg·mL–1)CC BY · PubMed Central
Fig. 6 DMP1 prevents LVH and prolongs lifespan in Col4a3−/− mice with advanced CKD. Blood pressure and heart morphology analyses of 20-week-old B6 WT, DMP1TG, Col4a3−/−, and Col4a3−/−/DMP1TG mice showing: a–c Non-invasive systolic, diastolic, and mean blood pressure (BP). d, e Body weight and heart weight to tibia length ratio. f Bright-field microscopy of hematoxylin & eosin staining (H&E, scale bar = 1 mm) and fluorescence microscopy of wheat germ agglutinin staining (WGA, scale bar = 50 µm) of heart cross-sections, and M-mode echocardiography. g, h Cardiomyocyte cross-sectional area and perimeter calculated from WGA stained sections. i, j Left ventricular mass and left ventricular posterior wall thickness calculated from echocardiography. k Kaplan–Meier cumulative proportion of mice surviving. B6 WT and DMP1TG mice are represented by the black line. Both B6 Col4a3−/− and Col4a3−/−/DMP1TG mice show reduced lifespan (p < 0.05 vs. WT), but B6 Col4a3−/−/DMP1TG survive longer than B6 Col4a3−/− mice (P < 0.05 vs. Col4a3−/−). Values are expressed as mean ± SEM; n ≥ 5 mice/group. P < 0.05 vs. a WT, b Col4a3−/−
Fig. 6 DMP1 prevents LVH and prolongs lifespan in Col4a3−/− mice with advanced CKD. Blood pressure and heart morphology analyses of 20-week-old B6 WT, DMP1TG, Col4a3−/−, and Col4a3−/−/DMP1TG mice showing: a–c Non-invasive systolic, diastolic, and mean blood pressure (BP). d, e Body weight and heart weight to tibia length ratio. f Bright-field microscopy of hematoxylin & eosin staining (H&E, scale bar = 1 mm) and fluorescence microscopy of wheat germ agglutinin staining (WGA, scale bar = 50 µm) of heart cross-sections, and M-mode echocardiography. g, h Cardiomyocyte cross-sectional area and perimeter calculated from WGA stained sections. i, j Left ventricular mass and left ventricular posterior wall thickness calculated from echocardiography. k Kaplan–Meier cumulative proportion of mice surviving. B6 WT and DMP1TG mice are represented by the black line. Both B6 Col4a3−/− and Col4a3−/−/DMP1TG mice show reduced lifespan (p < 0.05 vs. WT), but B6 Col4a3−/−/DMP1TG survive longer than B6 Col4a3−/− mice (P < 0.05 vs. Col4a3−/−). Values are expressed as mean ± SEM; n ≥ 5 mice/group. P < 0.05 vs. a WT, b Col4a3−/−CC BY · PubMed Central
Fig. 7 Protective role of DMP1 through regulation of apoptosis and calcineurin/NFAT signaling in osteocytes. DMP1 and FGF23 are both mainly produced and secreted by osteocytes. In health, DMP1 maintains osteocyte networks integrity by maintaining adequate bone mineralization and preventing osteocyte apoptosis. DMP1 also inhibits FGF23 transcription in osteocytes which contributes to low baseline levels of circulating FGF23. Mice with advanced CKD show reduced DMP1 expression, which contributes to increased caspase 3/8 and calcineurin/NFAT signaling, resulting in increased osteocyte apoptosis, altered osteocyte morphology and networks, and increased production of FGF23. Elevated levels of circulating FGF23 promote left ventricular hypertrophy and premature death. Consequently, DMP1 supplementation in mice with CKD prevents osteocyte apoptosis, improves osteocyte morphology and connectivity, prevents FGF23 elevation, protects against the development of cardiovascular disease and improves survival
Fig. 7 Protective role of DMP1 through regulation of apoptosis and calcineurin/NFAT signaling in osteocytes. DMP1 and FGF23 are both mainly produced and secreted by osteocytes. In health, DMP1 maintains osteocyte networks integrity by maintaining adequate bone mineralization and preventing osteocyte apoptosis. DMP1 also inhibits FGF23 transcription in osteocytes which contributes to low baseline levels of circulating FGF23. Mice with advanced CKD show reduced DMP1 expression, which contributes to increased caspase 3/8 and calcineurin/NFAT signaling, resulting in increased osteocyte apoptosis, altered osteocyte morphology and networks, and increased production of FGF23. Elevated levels of circulating FGF23 promote left ventricular hypertrophy and premature death. Consequently, DMP1 supplementation in mice with CKD prevents osteocyte apoptosis, improves osteocyte morphology and connectivity, prevents FGF23 elevation, protects against the development of cardiovascular disease and improves survivalCC BY · PubMed Central

Verification

Claims the paper makes

The claims and statistics of this paper haven’t been checked yet.

Free: it reads the open-access text and checks the first 5 claims that cite a source we can check. Create a free account to check every claim.

A few free checks a day · papers already verified open instantly · results are public

Claims other papers make about this one

Each is checked against this paper’s own text: does it say what the citing paper says it does?

Self-check

Percentages, sums and reported differences re-computed from the paper’s own numbers.

The self-check needs the paper’s full text.

Citations

Cites

Show all 47 references

Research works printed but not linked: 1

  1. Neuburg, S. et al. Genetic background influences cardiac phenotype in murine chronic kidney disease. Nephrol. Dial. Transplant. 33, 1129–1137 (2018). · DOI

Cited by

See all 97

Metadata

Authors
Dussold, C., Gerber, C., White, S., Wang, X., Qi, L., Francis, C., Capella, M., Courbon, G., Wang, J., Li, C., Feng, J. Q., Isakova, T., Wolf, M., David, V., & Martin, A.
Affiliations
  • Northwestern University (US)
  • Texas A&M University (US)
  • Duke University (US)
Corresponding author
Martin, Aline
Venue
Bone Research
Published
2019-04-25
Volume
7
Issue
1
Pages
12-12
ISSN
  • 2095-4700 (ISSN-L)
  • 2095-6231
OpenAlex
W2941262857
Cited by
96
References
47
Citations by year
2026: 16 · 2025: 13 · 2024: 11 · 2023: 15 · 2022: 12 · 2021: 14 · 2020: 10 · 2019: 5
FWCI
7.92
Type
journal article
Language
en
Open access
Licence
Locations
  • Bone Research (publishedVersion, cc-by)
  • Europe PMC (PubMed Central) (publishedVersion, cc-by)
  • PubMed Central (publishedVersion, cc-by)
  • PubMed (publishedVersion)
  • HAL (submittedVersion)
  • DOAJ (DOAJ: Directory of Open Access Journals) (submittedVersion)
Funders
U.S. Department of Health & Human Services | NIH | National Institute of Diabetes and Digestive and Kidney Diseases (R01DK101730, R01DK076116, R01DK102815)
Topics
  • Health Sciences › Medicine › Nephrology › Parathyroid Disorders and Treatments
  • Life Sciences › Biochemistry, Genetics and Molecular Biology › Molecular Biology › Bone Metabolism and Diseases
  • Health Sciences › Medicine › Orthopedics and Sports Medicine › Bone health and osteoporosis research
Keywords
DMP1, chronic kidney disease, fibroblast growth factor 23, osteocytes, left ventricular hypertrophy, Col4a3 knockout mice, osteocyte apoptosis, bone mineralization, hyperphosphatemia, cardiovascular mortality, bone health

About these checks

Registry, retraction, Cites and statistics results are computed, not judged, with one exception: a printed reference that no index lists is read once by a model before it counts as a citation error. Claims are extracted by a model and kept only when their quote appears verbatim in the text; each cited source is then checked, with a model’s help, for whether it says what the claim relies on. Those verdicts can be wrong — read the claim’s quote and the cited source before relying on one.

Statistics and arithmetic are recomputed, not judged.

Confidence bands are shown only for fields calibrated on our annotated test set. None is calibrated yet, so no band is shown.

What counts as a claim ›How we measure confidence ›How we check this ›

Are you an author, or do you see a problem with this page? Request a review

How to cite

Cite CoChat for the checks on this page, and the paper for its own findings.

This page
CoChat. (2026). Citation check: DMP1 prevents osteocyte alterations, FGF23 elevation and left ventricular hypertrophy in mice with chronic kidney disease. https://app.cochat.ai/papers/10.1038/s41413-019-0051-1
The paper
Dussold, C., Gerber, C., White, S., Wang, X., Qi, L., Francis, C., Capella, M., Courbon, G., Wang, J., Li, C., Feng, J. Q., Isakova, T., Wolf, M., David, V., & Martin, A. (2019). DMP1 prevents osteocyte alterations, FGF23 elevation and left ventricular hypertrophy in mice with chronic kidney disease. Bone Research. https://doi.org/10.1038/s41413-019-0051-1

Data sources

Bibliographic data: Semantic Scholar, OpenAlex, Crossref.

Contains information from the Semantic Scholar Academic Graph Datasets, made available under the ODC Attribution License (ODC-BY 1.0).

Semantic Scholar’s data is described in: Kinney, R., et al. (2023). The Semantic Scholar Open Data Platform. arXiv:2301.10140.