

The DOI matches its Crossref record; 52 of the 52 references it cites were found in a registry or an index.
Immune cell profiling of COVID-19 patients in the recovery stage by single-cell sequencing
Open accessPublished version of a preprint
Abstract
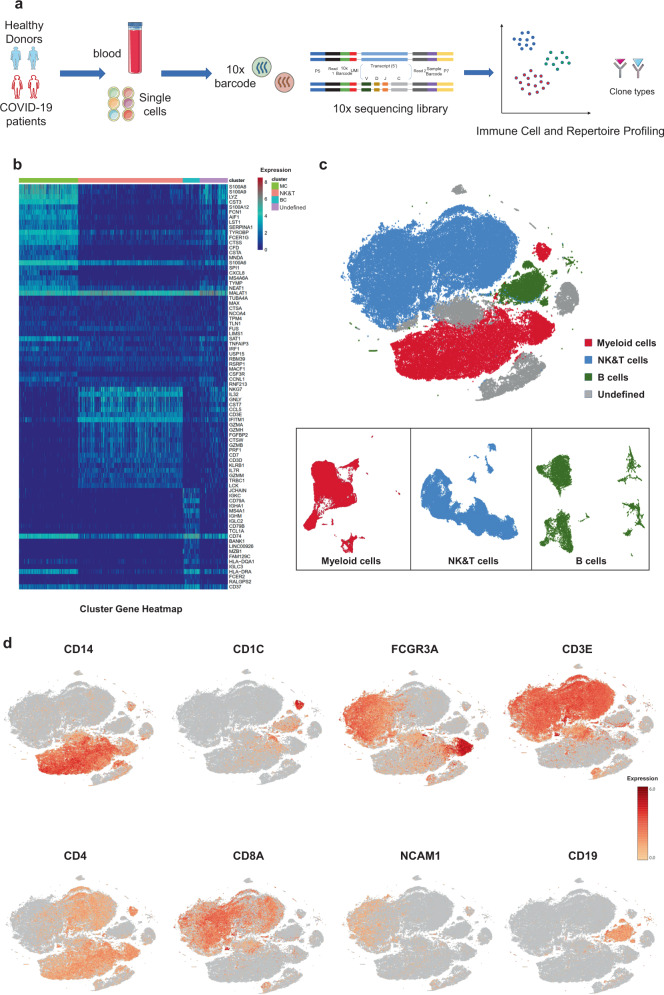
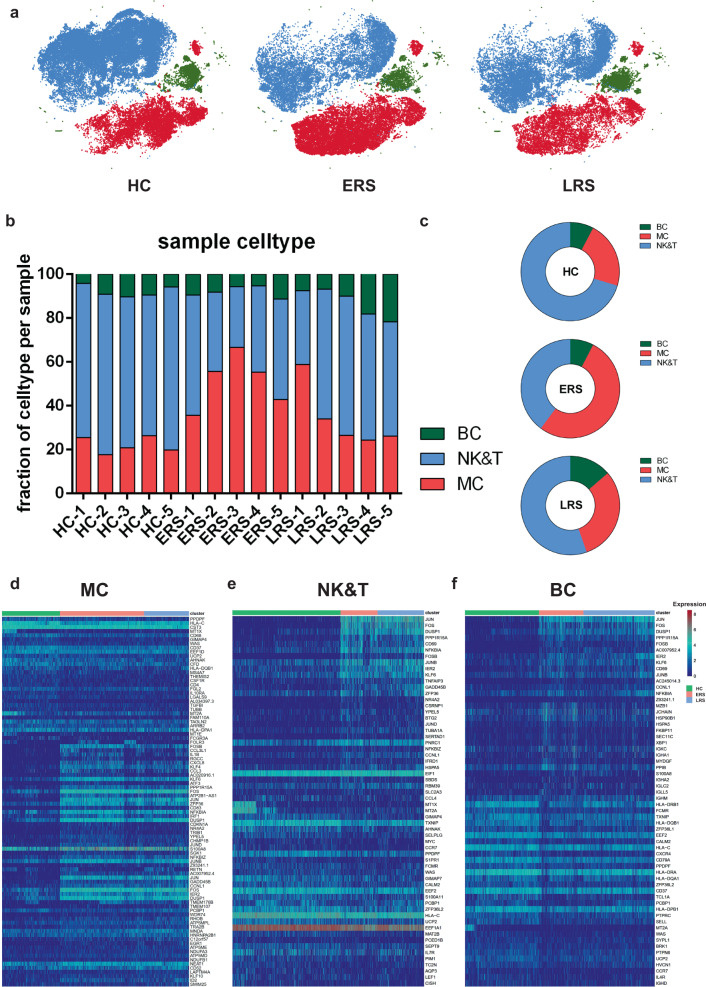
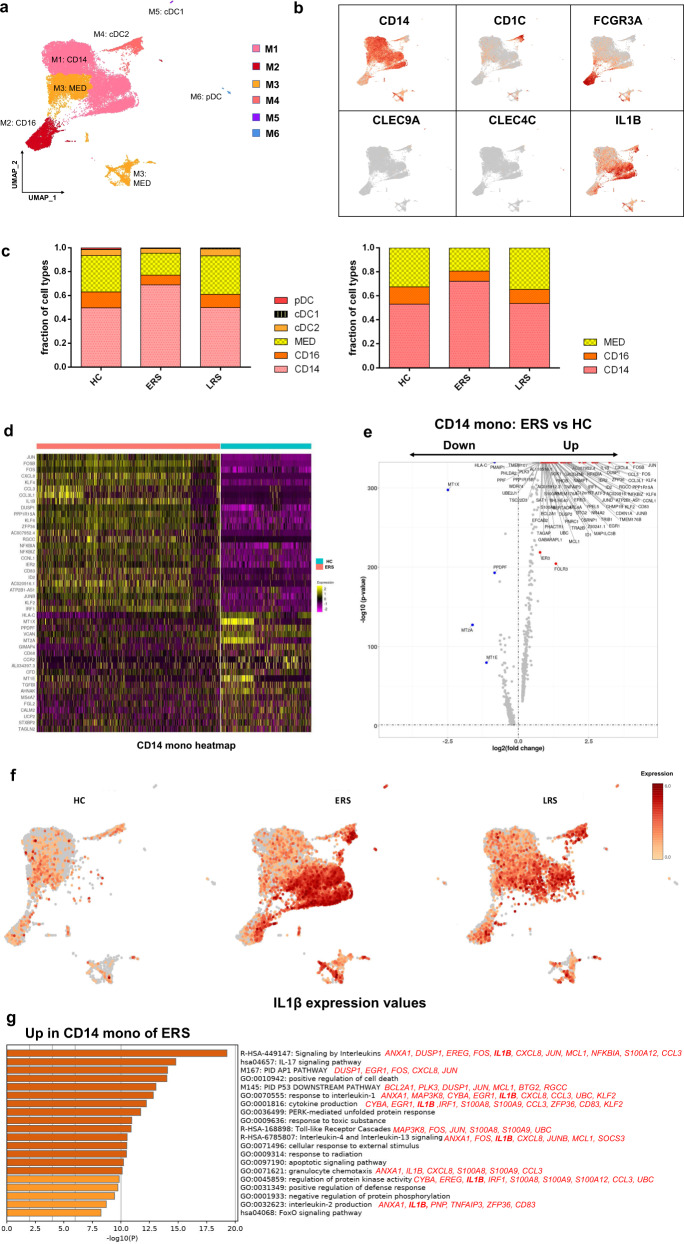
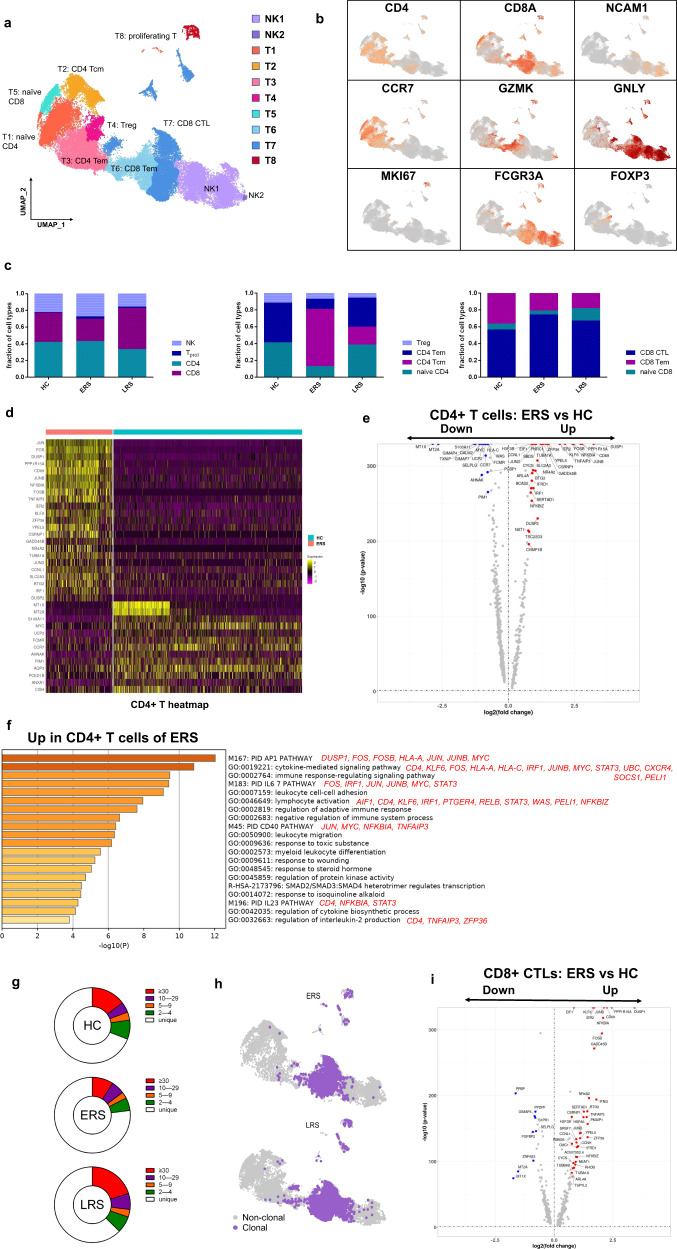
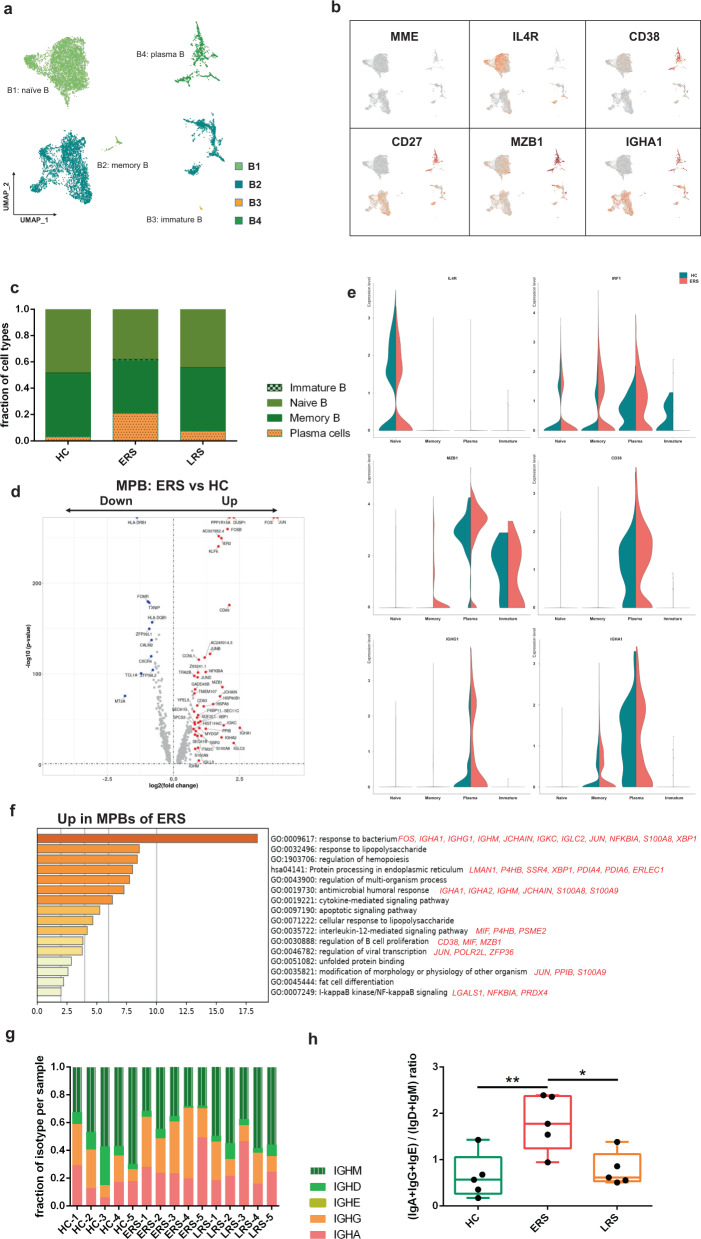
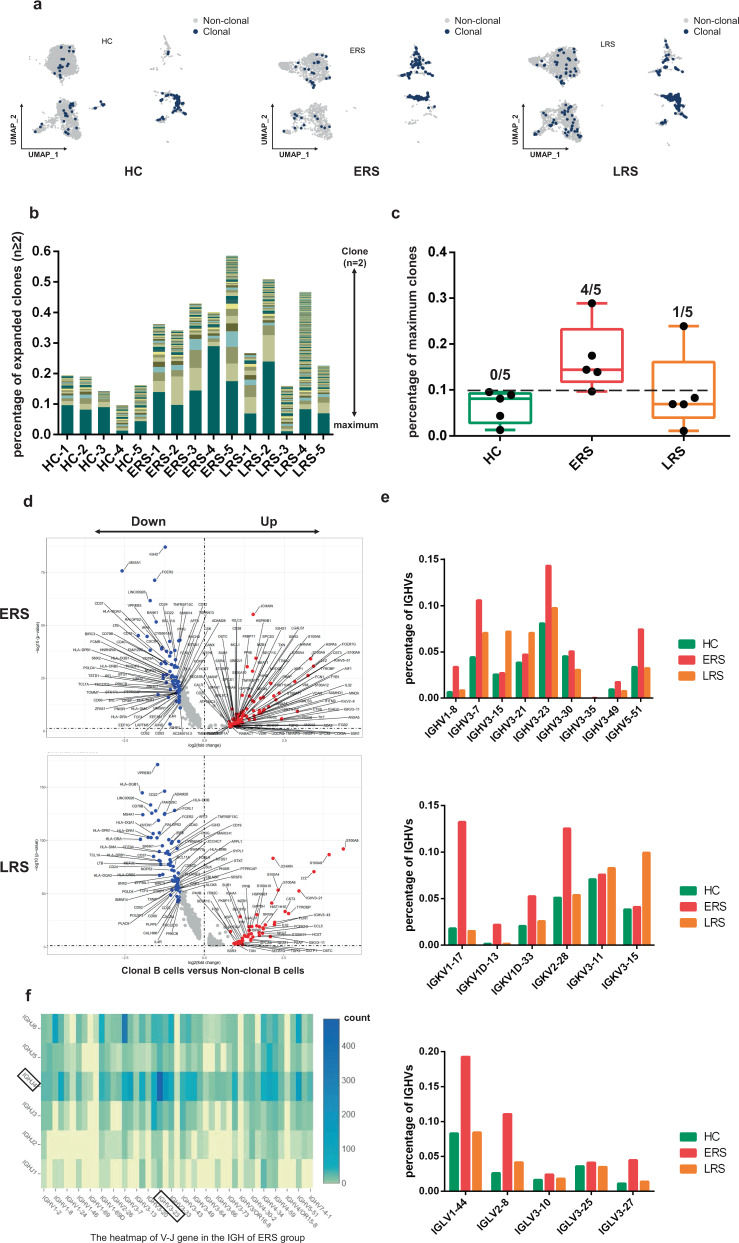
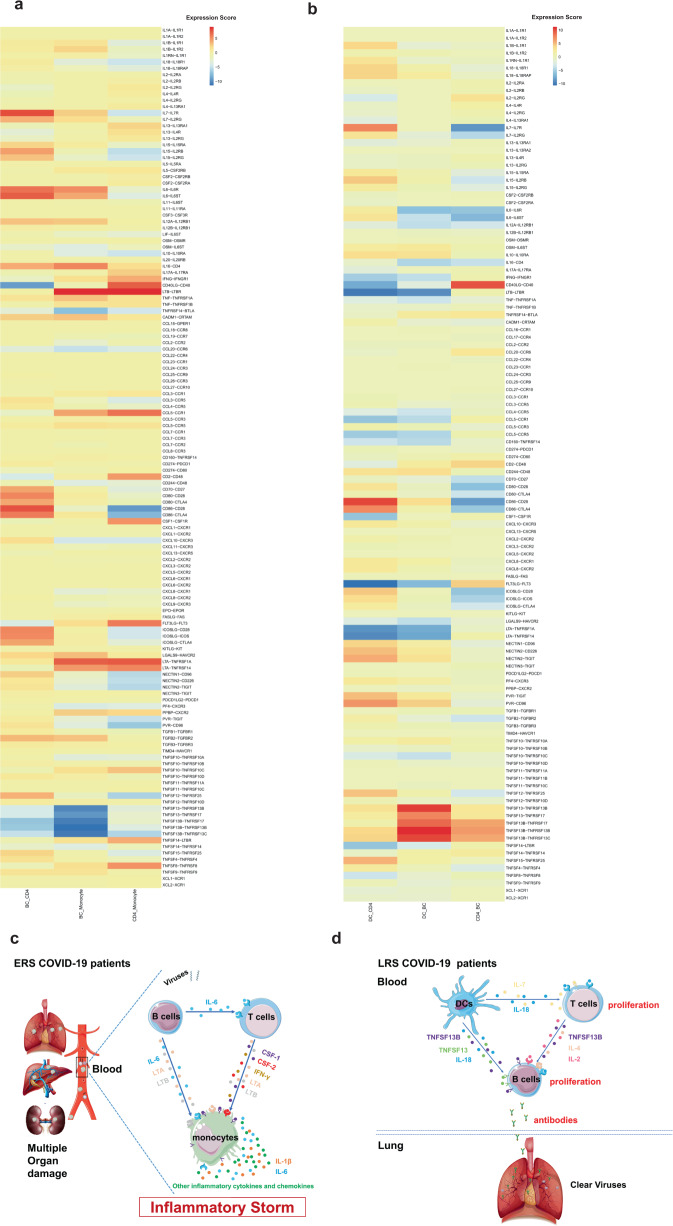
COVID-19, caused by SARS-CoV-2, has recently affected over 1,200,000 people and killed more than 60,000. The key immune cell subsets change and their states during the course of COVID-19 remain unclear. We sought to comprehensively characterize the transcriptional changes in peripheral blood mononuclear cells during the recovery stage of COVID-19 by single-cell RNA sequencing technique. It was found that T cells decreased remarkably, whereas monocytes increased in patients in the early recovery stage (ERS) of COVID-19. There was an increased ratio of classical CD14 ++ monocytes with high inflammatory gene expression as well as a greater abundance of CD14 ++ IL1β + monocytes in the ERS. CD4 + T cells and CD8 + T cells decreased significantly and expressed high levels of inflammatory genes in the ERS. Among the B cells, the plasma cells increased remarkably, whereas the naïve B cells decreased. Several novel B cell-receptor (BCR) changes were identified, such as IGHV3-23 and IGHV3-7, and isotypes (IGHV3-15, IGHV3-30, and IGKV3-11) previously used for virus vaccine development were confirmed. The strongest pairing frequencies, IGHV3-23-IGHJ4, indicated a monoclonal state associated with SARS-CoV-2 specificity, which had not been reported yet. Furthermore, integrated analysis predicted that IL-1β and M-CSF may be novel candidate target genes for inflammatory storm and that TNFSF13, IL-18, IL-2, and IL-4 may be beneficial for the recovery of COVID-19 patients. Our study provides the first evidence of an inflammatory immune signature in the ERS, suggesting COVID-19 patients are still vulnerable after hospital discharge. Identification of novel BCR signaling may lead to the development of vaccines and antibodies for the treatment of COVID-19.
Overview
The claims and statistics of this paper haven’t been checked yet.
Run the check — free, no account needed. It reads the open-access text and checks the sources it cites.
Integrity signals
Registry
Cites
Statistics
Figures
Verification
Claims the paper makes
The claims and statistics of this paper haven’t been checked yet.
Run the check — free, no account needed. It reads the open-access text and checks the sources it cites.
Claims other papers make about this one
Each is checked against this paper’s own text: does it say what the citing paper says it does?
The source backs part of the claim, not all of it — or backs it for a different population, condition or comparison.
In the citing paper
“Milder disease and recovery have been associated with a more robust clonal expansion of CD8+ T cells in both the lungs and blood42,43, although whether this is the cause of milder disease or an effect of recovery is unclear.”
From Immunological mechanisms of vaccine-induced protection against COVID-19 in humans (2021) · cites this paper as [43]
Experimental — accuracy not yet measured
Self-check
Percentages, sums and reported differences re-computed from the paper’s own numbers.
The self-check needs the paper’s full text.
Citations
Cites
Clinical features of patients infected with 2019 novel coronavirus in Wuhan, China
Huang, C., Wang, Y., Li, X., Ren, L., Zhao, J., Hu, Y., Zhang, L., Fan, G., Xu, J., Gu, X., et al. (2020) · The Lancet · doi:10.1016/s0140-6736(20)30183-5 · Cited by 48,884
A novel coronavirus from patients with pneumonia in China, 2019
Zhu, N., Zhang, D., Wang, W., Li, X., Yang, B., Song, J., Zhao, X., Huang, B., Shi, W., Lu, R., et al. (2020) · New England Journal of Medicine · doi:10.1056/nejmoa2001017 · Cited by 28,244
Self-citationWang, D., Hu, B., Hu, C., Zhu, F., Liu, X., Zhang, J., Wang, B., Xiang, H., Cheng, Z., Xiong, Y., et al. (2020) · JAMA · doi:10.1001/jama.2020.1585 · Cited by 20,148
Self-citationLa certeza de lo impredecible: Cultura Educación y Sociedad en tiempos de COVID19
Martínez González, M. (2020) · DSPACE System - Metalibrary (University of the Coast) · Cited by 18,463
Early transmission dynamics in Wuhan, China, of novel coronavirus-infected pneumonia
Li, Q., Guan, X., Wu, P., Wang, X., Zhou, L., Tong, Y., Ren, R., Leung, K. S. M., Lau, E. H. Y., Wong, J. Y., et al. (2020) · New England Journal of Medicine · doi:10.1056/nejmoa2001316 · Cited by 16,575
Comprehensive Integration of Single-Cell Data
Stuart, T., Butler, A., Hoffman, P., Hafemeister, C., Papalexi, E., Mauck, W. M., Hao, Y., Stoeckius, M., Smibert, P., & Satija, R. (2019) · Cell · doi:10.1016/j.cell.2019.05.031 · Cited by 15,453
Metascape provides a biologist-oriented resource for the analysis of systems-level datasets
Zhou, Y., Zhou, B., Pache, L., Chang, M., Khodabakhshi, A. H., Tanaseichuk, O., Benner, C., & Chanda, S. K. (2019) · Nature Communications · doi:10.1038/s41467-019-09234-6 · Cited by 14,611
Structure, function and antigenicity of the SARS-CoV-2 spike glycoprotein
Walls, A. C., Park, Y.-J., Tortorici, M. A., Wall, A., McGuire, A. T., & Veesler, D. (2020) · doi:10.1101/2020.02.19.956581 · Cited by 8,586
Chan, J., Yuan, S.-F., Kok, K.-H., To, K., Chu, H., Yang, J., Xing, F., Liu, J.-L., Yip, C., Poon, R., et al. (2020) · The Lancet · doi:10.1016/s0140-6736(20)30154-9 · Cited by 8,450
Trapnell, C., Cacchiarelli, D., Grimsby, J., Pokharel, P., Li, S., Morse, M., Lennon, N. J., Livak, K. J., Mikkelsen, T. S., & Rinn, J. L. (2014) · Nature Biotechnology · doi:10.1038/nbt.2859 · Cited by 7,314
Cited by
Sorted by citations
Items 301–400 of 737
An Immunological Perspective: What Happened to Pregnant Women After Recovering From COVID-19?
Zhao, S., Xie, T., Shen, L. W., Liu, H., Wang, L., Ma, X., Wu, J., Yuan, S., Mor, G., & Liao, A. (2021) · Frontiers in Immunology · doi:10.3389/fimmu.2021.631044 · Cited by 25
Shalash, A. O., Hussein, W. M., Skwarczyński, M., & Tóth, I. (2021) · Advanced Science · doi:10.1002/advs.202100985 · Cited by 25
Adam, L., Rosenbaum, P., Quentric, P., Parizot, C., Bonduelle, O., Guillou, N., Corneau, A., Dorgham, K., Miyara, M., Luyt, C. E., et al. (2021) · JCI Insight · doi:10.1172/jci.insight.151571 · Cited by 25
What Happens to the Immune System after Vaccination or Recovery from COVID-19?
Tiyo, B. T., Schmitz, G. J. H., Ortega, M. M., da Silva, L. T., de Almeida, A., Oshiro, T. M., & Duarte, A. J. D. S. (2021) · Life · doi:10.3390/life11111152 · Cited by 28
Landscapes and dynamic diversifications of B-cell receptor repertoires in COVID-19 patients
Xiang, H., Zhao, Y., Li, X., Liu, P., Wang, L., Wang, M., Tian, L., Sun, H., Zhang, W., Xu, Z., et al. (2021) · Human Immunology · doi:10.1016/j.humimm.2021.10.007 · Cited by 25
Self-citationT-cell receptor repertoires as potential diagnostic markers for patients with COVID-19
Hou, X., Wang, G., Fan, W., Chen, X., Mo, C., Wang, Y., Gong, W., Wen, X., Chen, H., He, D., et al. (2021) · International Journal of Infectious Diseases · doi:10.1016/j.ijid.2021.10.033 · Cited by 29
Mazaheri, T., Ranasinghe, R. N. K., Al‐Hasani, W., Luxton, J., Kearney, J. C., Manning, A. D., Dimitriadis, G. K., Mare, T. A., & Vincent, R. P. (2022) · PLoS ONE · doi:10.1371/journal.pone.0266652 · Cited by 26
From Immunogen to COVID-19 vaccines: Prospects for the post-pandemic era
Miao, G., Chen, Z., Cao, H., Wu, W., Chu, X., Liu, H., Zhang, L., Zhu, H., Cai, H., Lu, X., et al. (2023) · Biomedicine & Pharmacotherapy · doi:10.1016/j.biopha.2022.114208 · Cited by 27
Strategies for Immunomonitoring after Vaccination and during Infection
Adam, L., Rosenbaum, P., Bonduelle, O., & Combadière, B. (2021) · Vaccines · doi:10.3390/vaccines9040365 · Cited by 25
The Mechanisms and Animal Models of SARS-CoV-2 Infection
Jia, W., Wang, J., Sun, B., Zhou, J., Shi, Y., & Zhou, Z. (2021) · Frontiers in Cell and Developmental Biology · doi:10.3389/fcell.2021.578825 · Cited by 27
Suppressive Monocytes Impair MAIT Cells Response via IL-10 in Patients with Severe COVID-19
Yang, Q., Wen, Y., Qi, F., Gao, X., Chen, W., Xu, G., Wei, C., Wang, H., Tang, X., Lin, J., et al. (2021) · The Journal of Immunology · doi:10.4049/jimmunol.2100228 · Cited by 24
Self-citationMurugan, C., Ramamoorthy, S., Kuppuswamy, G. P., Murugan, R. K., Sivalingam, Y., & Sundaramurthy, A. (2021) · International Journal of Biological Macromolecules · doi:10.1016/j.ijbiomac.2021.10.144 · Cited by 28
Amino acid sensing pathway: A major check point in the pathogenesis of obesity and COVID‐19
Philips, A. M., & Khan, N. (2021) · Obesity Reviews · doi:10.1111/obr.13221 · Cited by 25
Rodrigues, P. R. S., Alrubayyi, A., Pring, E., Bart, V. M. T., Jones, R. E., Coveney, C. R., Lu, F., Tellier, M., Maleki-Toyserkani, S., Richter, F. C., et al. (2020) · Oxford Open Immunology · doi:10.1093/oxfimm/iqaa005 · Cited by 26
Ghaebi, M., Tahmasebi, S., Jozghorbani, M., Sadeghi, A., Thangavelu, L. P., Zekiy, A. O., & Esmaeilzadeh, A. (2021) · Life Sciences · doi:10.1016/j.lfs.2021.119503 · Cited by 22
Zhong, J., Li, P., Liang, M., & Ai, Y. (2021) · Advanced Materials Technologies · doi:10.1002/admt.202100906 · Cited by 24
Single-Cell RNA-Seq of Bone Marrow Cells in Aplastic Anemia
Hu, T., Yanna, Z., Yu, X., Ruilan, G., & Liming, Y. (2022) · Frontiers in Genetics · doi:10.3389/fgene.2021.745483 · Cited by 24
Walter, L. O., Cardoso, C. C., Santos‐Pirath, Í. M., Costa, H. Z., Gartner, R., Werle, I., Mohr, E. T. B., da Rosa, J. S., Felisberto, M., Kretzer, I. F., et al. (2022) · Immunology · doi:10.1111/imm.13457 · Cited by 26
Umar, S., Palasiewicz, K., Meyer, A., Kumar, P., Prabhakar, B. S., Volin, M. V., Rahat, R., Al‐Awqati, M., Chang, H. J., Zomorrodi, R. K., et al. (2022) · Cellular and Molecular Life Sciences · doi:10.1007/s00018-022-04329-8 · Cited by 24
Inflammasomes: a rising star on the horizon of COVID-19 pathophysiology
Wang, M., Yu, F., Chang, W., Zhang, Y., Zhang, L., & Li, P. (2023) · Frontiers in Immunology · doi:10.3389/fimmu.2023.1185233 · Cited by 25
Gabernet, G., Marquez, S., Bjornson, R. D., Peltzer, A., Meng, H., Aron, E., Lee, N. Y., Jensen, C. G., Ladd, D., Polster, M., et al. (2024) · PLoS Computational Biology · doi:10.1371/journal.pcbi.1012265 · Cited by 26
Immunology of COVID‐19 and disease‐modifying therapies: The good, the bad and the unknown
Zrzavy, T., Wimmer, I., Rommer, P. S., & Berger, T. (2020) · European Journal of Neurology · doi:10.1111/ene.14578 · Cited by 23
Yang, J., Zhong, M., Hong, K., Yang, Q., Zhang, E., Zhou, D., Xia, J., Chen, Y., Sun, M., Zhao, B., et al. (2021) · Clinical & Translational Immunology · doi:10.1002/cti2.1259 · Cited by 24
Elevated frequencies of CD14+HLA-DRlo/neg MDSCs in COVID-19 patients
Xue, G., Jiang, M., Zhao, R., Le, A., & Li, J. (2021) · Aging · doi:10.18632/aging.202571 · Cited by 23
Self-citationA novel anti-human IL-1R7 antibody reduces IL-18-mediated inflammatory signaling
Li, S., Jiang, L., Beckmann, K., Højen, J. F., Pessara, U., Powers, N. E., de Graaf, D. M., Azam, T., Lindenberger, J. J., Eisenmesser, E. Z., et al. (2021) · Journal of Biological Chemistry · doi:10.1016/j.jbc.2021.100630 · Cited by 23
SARS-CoV-2 infection paralyzes cytotoxic and metabolic functions of the immune cells
Singh, Y., Trautwein, C., Fendel, R., Krickeberg, N., Berezhnoy, G., Bissinger, R., Ossowski, S., Salker, M. S., Casadei, N., Rieß, O., et al. (2021) · Heliyon · doi:10.1016/j.heliyon.2021.e07147 · Cited by 24
Li, X., Garg, M., Jia, T., Liao, Q., Yuan, L., Mao, L., Wu, Z., Wu, W., Bi, Y., George, N., et al. (2022) · Frontiers in Immunology · doi:10.3389/fimmu.2021.781432 · Cited by 23
Islam, M. S., Wang, Z., Abdel‐Mohsen, M., Chen, X., & Montaner, L. J. (2023) · Journal of Leukocyte Biology · doi:10.1093/jleuko/qiac001 · Cited by 23
Kothari, H., Williams, C. M., McSkimming, C. C., Drago, F., Marshall, M. A., Garmey, J. C., Vigneshwar, M., Zunder, E. R., & McNamara, C. A. (2021) · Science Signaling · doi:10.1126/scisignal.abc5763 · Cited by 22
Immune cell profiling and antibody responses in patients with COVID-19
Rezaei, M. S., Mahmoudi, S., Mortaz, E., & Marjani, M. (2021) · BMC Infectious Diseases · doi:10.1186/s12879-021-06278-2 · Cited by 20
Jackson, M. R., Stevenson, K. H., Chahal, S. K., Curley, E., Finney, G. E., Gutierrez‐Quintana, R., Onwubiko, E., Rupp, A., Strathdee, K. E., Williams, K., et al. (2021) · International Journal of Radiation Oncology*Biology*Physics · doi:10.1016/j.ijrobp.2021.08.029 · Cited by 22
Immune features of COVID-19 convalescent individuals revealed by a single-cell RNA sequencing
Zhao, P., Zou, J., Zhou, F., Zhu, Y., Song, Q., Yu, D., & Li, X. (2022) · International Immunopharmacology · doi:10.1016/j.intimp.2022.108767 · Cited by 21
Neutrophil Extracellular Traps, Sepsis and COVID-19 – A Tripod Stand
Ventura-Santana, E., Ninan, J. R., Snyder, C. M., & Okeke, E. B. (2022) · Frontiers in Immunology · doi:10.3389/fimmu.2022.902206 · Cited by 23
RAGE engagement by SARS-CoV-2 enables monocyte infection and underlies COVID-19 severity
Angioni, R., Bonfanti, M., Caporale, N., Sánchez‐Rodríguez, R., Munari, F., Savino, A., Pasqualato, S., Buratto, D., Pagani, I., Bertoldi, N., et al. (2023) · Cell Reports Medicine · doi:10.1016/j.xcrm.2023.101266 · Cited by 24
Singh, R., Hemati, H., Bajpai, M., Yadav, P., Maheshwari, A., Kumar, S., Agrawal, S., Sevak, J. K., Islam, M., Maras, J. S., et al. (2021) · Immunity Inflammation and Disease · doi:10.1002/iid3.476 · Cited by 22
Rheumatic Musculoskeletal Diseases and COVID-19 A Review of the First 6 Months of the Pandemic
Stradner, M. H., Dejaco, C., Zwerina, J., & Fritsch-Stork, R. D. E. (2020) · Frontiers in Medicine · doi:10.3389/fmed.2020.562142 · Cited by 21
Does Angiotensin II Peak in Response to SARS-CoV-2?
Xavier, L. L., Neves, P. F. R., Paz, L. V., Neves, L. T., Bagatini, P. B., Timmers, L. F. S. M., Rasia‐Filho, A. A., Mestriner, R. G., & Wieck, A. (2021) · Frontiers in Immunology · doi:10.3389/fimmu.2020.577875 · Cited by 21
Krysko, O., Kondakova, E. V., Vershinina, O., Галова, Е. А., Blagonravova, A. S., Gorshkova, E. N., Bachert, C., Ivanchenko, M., Krysko, D. V., & Vedunova, M. V. (2021) · Frontiers in Immunology · doi:10.3389/fimmu.2021.715072 · Cited by 21
Robust Virus-Specific Adaptive Immunity in COVID-19 Patients with SARS-CoV-2 Δ382 Variant Infection
Fong, S., Yeo, N. K., Chan, Y., Goh, Y. S., Amrun, S. N., Ang, N., Rajapakse, M. P., Lum, J., Foo, S., Lee, C. Y., et al. (2021) · Journal of Clinical Immunology · doi:10.1007/s10875-021-01142-z · Cited by 21
Ehling, R. A., Weber, C. R., Mason, D. M., Friedensohn, S., Wagner, B., Bieberich, F., Kapetanovic, E., Vazquez-Lombardi, R., Roberto, R. B. D., Hong, K., et al. (2021) · Cell Reports · doi:10.1016/j.celrep.2021.110242 · Cited by 27
Schultz, I. C., Bertoni, A. P. S., & Wink, M. R. (2022) · Journal of Molecular Medicine · doi:10.1007/s00109-021-02175-y · Cited by 20
Natural killer cells for antiviral therapy
Smith, D. M., Schafer, J. R., Tullius, B. P., Witkam, L., & Paust, S. (2023) · Science Translational Medicine · doi:10.1126/scitranslmed.abl5278 · Cited by 22
Vázquez‐Alejo, E., Tarancón‐Díez, L., Espinar-Buitrago, M. D. L. S., Genebat, M., Calderón, A., Pérez-Cabeza, G., Magro-López, E., Leal, M., & Muñoz‐Fernández, M. Á. (2023) · Journal of Clinical Medicine · doi:10.3390/jcm12103539 · Cited by 21
Regulation of Human Innate Lymphoid Cells in the Context of Mucosal Inflammation
Schulz-Kuhnt, A., Wirtz, S. J., Neurath, M. F., & Atreya, I. (2020) · Frontiers in Immunology · doi:10.3389/fimmu.2020.01062 · Cited by 21
Analysis of type I IFN response and T cell activation in severe COVID-19/HIV-1 coinfection
d’Ettorre, G., Recchia, G. E., Ridolfi, M., Siccardi, G., Pinacchio, C., Innocenti, G. P., Santinelli, L., Frasca, F., Bitossi, C., Ceccarelli, G., et al. (2020) · Medicine · doi:10.1097/md.0000000000021803 · Cited by 21
A Shift Towards an Immature Myeloid Profile in Peripheral Blood of Critically Ill COVID-19 Patients
Vadillo, E., Taniguchi‐Ponciano, K., López-Macías, C. I. R., Carvente-Garcia, R., Mayani, H., Ferat-Osorio, E. A., Flores, G., Torres, J., González-Bonilla, C. R., Majluf, A., et al. (2020) · Archives of Medical Research · doi:10.1016/j.arcmed.2020.11.005 · Cited by 21
Potential SARS-CoV-2 vaccines: Concept, progress, and challenges
Hosseini, S. A., Zahedipour, F., Mirzaei, H., & Oskuee, R. K. (2021) · International Immunopharmacology · doi:10.1016/j.intimp.2021.107622 · Cited by 26
Experimental Animal Models of Coronavirus Infections: Strengths and Limitations
Casel, M. A. B., Rollon, R., & Choi, Y. K. (2021) · Immune Network · doi:10.4110/in.2021.21.e12 · Cited by 21
Calvet, J., Berenguer, A., Gay, M., Massanella, M., Domingo, P., Llop-Vilaltella, M., Sánchez-Jiménez, E., Arévalo, M., Carrillo, J., Albiñana-Giménez, N., et al. (2022) · Scientific Reports · doi:10.1038/s41598-021-04683-w · Cited by 20
Distinct Cellular Immune Responses to SARS-CoV-2 in Pregnant Women
Gomez‐Lopez, N., Romero, R. J., Li, T., Gershater, M., Leng, Y., Zou, C., Farías, M., Galaz, J., Miller, D., Tarca, A. L., et al. (2022) · The Journal of Immunology · doi:10.4049/jimmunol.2101123 · Cited by 20
Therapeutic potential of curcumin in ARDS and COVID ‐19
Suresh, M. V., Francis, S., Aktay, S., Kralovich, G., & Raghavendran, K. (2022) · Clinical and Experimental Pharmacology and Physiology · doi:10.1111/1440-1681.13744 · Cited by 20
Yin, J., Zhao, Y., Huang, F., Yang, Y., Huang, Y., Zhuang, Z., Wang, Y., Wang, Z., Lin, X., Zheng, Y., et al. (2023) · The Innovation · doi:10.1016/j.xinn.2022.100359 · Cited by 9
Self-citationDissecting CD8+ T cell pathology of severe SARS-CoV-2 infection by single-cell immunoprofiling
Schreibing, F., Hannani, M. T., Kim, H., Nagai, J. S., Ticconi, F., Fewings, E., Bleckwehl, T., Begemann, M., Torow, N., Kuppe, C., et al. (2022) · Frontiers in Immunology · doi:10.3389/fimmu.2022.1066176 · Cited by 19
Mabrey, F. L., Nian, H., Yu, C., Barnes, E. M., Malhotra, U., Mikacenic, C. R., Goldstein, J., O’Mahony, D. S., Garcia‐Diaz, J., Finn, P. W., et al. (2023) · EBioMedicine · doi:10.1016/j.ebiom.2023.104667 · Cited by 22
Resolution pharmacology and the treatment of infectious diseases
Costa, V. V., Resende, F., Melo, E. M., & Teixeira, M. M. (2024) · British Journal of Pharmacology · doi:10.1111/bph.16323 · Cited by 19
Immune Literacy: Reading, Writing, and Editing Adaptive Immunity
Csepregi, L., Ehling, R. A., Wagner, B., & Reddy, S. T. (2020) · iScience · doi:10.1016/j.isci.2020.101519 · Cited by 22
Bioinformatics resources facilitate understanding and harnessing clinical research of SARS-CoV-2
Ahsan, M. A., Liu, Y., Feng, C., Zhou, Y., Ma, G., Bai, Y., & Chen, M. (2020) · Briefings in Bioinformatics · doi:10.1093/bib/bbaa416 · Cited by 20
Fiorito, S., Soligo, M., Gao, Y., Öğülür, İ., Akdiş, C. A., & Bonini, S. (2022) · Allergy · doi:10.1111/all.15239 · Cited by 20
Mahmood, Z., Alrefai, H., Hetta, H. F., Kader, H. A., Munawar, N., Rahman, S. A., Elshaer, S., Batiha, G. E., & Muhammad, K. (2020) · Vaccines · doi:10.3390/vaccines8030443 · Cited by 20
COVID-19: Imbalanced Immune Responses and Potential Immunotherapies
Xie, B., Zhang, J., Li, Y., Yuan, S., & Shang, Y. (2021) · Frontiers in Immunology · doi:10.3389/fimmu.2020.607583 · Cited by 19
Kim, C. W., Oh, J. E., & Lee, H. K. (2021) · Immune Network · doi:10.4110/in.2021.21.e10 · Cited by 19
Spike Glycoprotein Is Central to Coronavirus Pathogenesis-Parallel Between m-CoV and SARS-CoV-2
Saadi, F., Pal, D., & Sarma, J. D. (2021) · Annals of Neurosciences · doi:10.1177/09727531211023755 · Cited by 17
Hyper-inflammatory responses in COVID-19 and anti-inflammatory therapeutic approaches
Choi, H., & Shin, E. (2022) · BMB Reports · doi:10.5483/bmbrep.2022.55.1.152 · Cited by 19
Risk factors of the severe course and fatal outcome in COVID-19
Sсherbak, S. G., Kamilova, Т. A., Голота, А. С., & Vologzhanin, D. A. (2022) · Physical and rehabilitation medicine medical rehabilitation · doi:10.36425/rehab104997 · Cited by 22
The deciphering of the immune cells and marker signature in COVID‐19 pathogenesis: An update
Jasim, S. A., Mahdi, R. S., Bokov, D. O., Najm, M. A. A., Sobirova, G. N., Bafoeva, Z. O., Taifi, A., Alkadir, O. K. A., Mustafa, Y. F., Mirzaei, R., et al. (2022) · Journal of Medical Virology · doi:10.1002/jmv.28000 · Cited by 21
Regulated necrosis in COVID-19: A double-edged sword
Sun, C., Han, Y., Zhang, R., Liu, S., Wang, J., Zhang, Y., Chen, X., Jiang, C. Q., Wang, J., Fan, X., et al. (2022) · Frontiers in Immunology · doi:10.3389/fimmu.2022.917141 · Cited by 20
DNA methylation predicts the outcome of COVID-19 patients with acute respiratory distress syndrome
Bradić, M., Taleb, S. J., Thomas, B., Chidiac, O. M., Robay, A., Hassan, N., Malek, J. A., Hssain, A. A., & Khalil, C. A. (2022) · Journal of Translational Medicine · doi:10.1186/s12967-022-03737-5 · Cited by 19
Dai, W., Zhong, A., Qiao, Q., Wu, J., Li, W.-W., Wu, Q.-Y., Zhou, H., Qin, S., Jiang, W.-J., Zhang, J., et al. (2022) · Virology Journal · doi:10.1186/s12985-022-01926-8 · Cited by 17
Palasiewicz, K., Umar, S., Romay, B., Zomorrodi, R. K., & Shahrara, S. (2021) · European Journal of Immunology · doi:10.1002/eji.202049159 · Cited by 19
Single-Cell Analysis of Different Stages of Oral Cancer Carcinogenesis in a Mouse Model
Huang, L.-Y., Hsieh, Y.-P., Wang, Y., Hwang, D., Jiang, S. S., Huang, W.-T., Chiang, W.-F., Liu, K., & Huang, T. (2020) · International Journal of Molecular Sciences · doi:10.3390/ijms21218171 · Cited by 18
Alshammary, A. F., & Alsulaiman, A. M. (2021) · Virulence · doi:10.1080/21505594.2021.1929800 · Cited by 18
Novel skewed usage of B-cell receptors in COVID-19 patients with various clinical presentations
Ma, J., Bai, H., Gong, T., Mao, W., Nie, Y., Zhang, X., Da, Y., Wang, X., Qin, H., Zeng, Q., et al. (2022) · Immunology Letters · doi:10.1016/j.imlet.2022.08.006 · Cited by 18
Self-citationYang, X., Chi, H., Wu, M., Wang, Z., Lang, Q., Han, Q., Wang, X., Liu, X., Li, Y., Wang, X., et al. (2022) · Frontiers in Immunology · doi:10.3389/fimmu.2022.992787 · Cited by 18
Self-citationInnate immune imprints in SARS-CoV-2 Omicron variant infection convalescents
Li, Z., Chen, X., Dan, J., Hu, T., Hu, Y., Liu, S., Chai, Y., Shi, Y., Wu, J., Ni, H., et al. (2022) · Signal Transduction and Targeted Therapy · doi:10.1038/s41392-022-01237-y · Cited by 20
Emerging roles of SARS-CoV-2 Spike-ACE2 in immune evasion and pathogenesis
Baldari, C. T., Onnis, A., Andreano, E., Giudice, G. D., & Rappuoli, R. (2023) · Trends in Immunology · doi:10.1016/j.it.2023.04.001 · Cited by 18
Lee, G., Schauner, R., Burke, J., Borocz, J., Vasana, S., Sobieraj, L., Giraudo, M. F., Jackson, Z., Ansari, M. Q., Navas, M. E., et al. (2023) · Frontiers in Immunology · doi:10.3389/fimmu.2023.1022890 · Cited by 18
Recombinant interleukin-2 stimulates lymphocyte recovery in patients with severe COVID-19
Zhu, M., Wang, Q., Zhou, S., Wang, B., Li, K., & He, P. (2021) · Experimental and Therapeutic Medicine · doi:10.3892/etm.2021.9658 · Cited by 18
A Missing Link: Engagements of Dendritic Cells in the Pathogenesis of SARS-CoV-2 Infections
Alamri, A., Fisk, D., Upreti, D., & Kung, S. K. P. (2021) · International Journal of Molecular Sciences · doi:10.3390/ijms22031118 · Cited by 18
Endothelial cell, myeloid, and adaptive immune responses in SARS‐CoV‐2 infection
Degauque, N., Haziot, A., Brouard, S., & Mooney, N. (2021) · The FASEB Journal · doi:10.1096/fj.202100024r · Cited by 14
Transforming microfluidics for single-cell analysis with robotics and artificial intelligence
Cheng, J., Anne, R., & Chen, Y. (2025) · Lab on a Chip · doi:10.1039/d5lc00216h · Cited by 21
Immunological features of coronavirus disease 2019 in patients with cancer
Thibaudin, M., Fumet, J.-D., Bon, M., Hampe, L., Limagne, E., & Ghiringhelli, F. (2020) · European Journal of Cancer · doi:10.1016/j.ejca.2020.08.013 · Cited by 17
CSF1R defines the mononuclear phagocyte system lineage in human blood in health and COVID-19
Combes, T., Orsenigo, F., Stewart, A., Mendis, A., Dunn‐Walters, D. K., Gordon, S., & Martínez, F. O. (2021) · Immunotherapy Advances · doi:10.1093/immadv/ltab003 · Cited by 17
Desvaux, E., Hamon, A., Hubert, S., Boudjeniba, C., Chassagnol, B., Swindle, J., Aussy, A., Laigle, L., Laplume, J., Soret, P., et al. (2021) · PLoS ONE · doi:10.1371/journal.pone.0254374 · Cited by 18
Agrafiotis, A., Neumeier, D., Hong, K., Chowdhury, T., Ehling, R. A., Kuhn, R., Sandu, I., Kreiner, V., Cotet, T., Shlesinger, D., et al. (2023) · iScience · doi:10.1016/j.isci.2023.106055 · Cited by 15
Insight into the mechanisms of coronaviruses evading host innate immunity
Yao, T., Foo, C., Zheng, G., Huang, R., Li, Q., Shen, J., & Wang, Z. (2023) · Biochimica et Biophysica Acta (BBA) - Molecular Basis of Disease · doi:10.1016/j.bbadis.2023.166671 · Cited by 18
T cell receptor β repertoires in patients with COVID-19 reveal disease severity signatures
Xu, J., Li, X., Yuan, N., Li, C., Yang, J., Cheng, L., Lu, Z., Hou, H., Zhang, B., Hu, H., et al. (2023) · Frontiers in Immunology · doi:10.3389/fimmu.2023.1190844 · Cited by 18
Self-citationNajm, A., Alunno, A., Mariette, X., Terrier, B., Marco, G. D., Emmel, J., Mason, L., McGonagle, D., & Machado, P. (2021) · RMD Open · doi:10.1136/rmdopen-2020-001549 · Cited by 17
COVID-19 and Coronaviral Hepatitis: Evidence of Collateral Damage
Parvez, M. K. (2020) · Future Virology · doi:10.2217/fvl-2020-0065 · Cited by 16
Moon, C. Y., Schilder, B. M., Raj, T., & Huang, K. (2021) · iScience · doi:10.1016/j.isci.2021.102550 · Cited by 16
Meta-analysis of COVID-19 single-cell studies confirms eight key immune responses
Garg, M., Xu, L., Moreno, P. A., Papatheodorou, I., Shu, Y., Brāzma, A., & Miao, Z. (2021) · Scientific Reports · doi:10.1038/s41598-021-00121-z · Cited by 13
Dannebaum, R., Suwalski, P., Asgharian, H., Du, Z. G., Lin, H., Weiner, J. M., Holtgrewe, M., Thibeault, C., Müller, M., Wang, X., et al. (2022) · EClinicalMedicine · doi:10.1016/j.eclinm.2022.101438 · Cited by 15
Alesci, A., Pergolizzi, S., Fumia, A., Miller, A., Cernigliaro, C., Zaccone, M., Salamone, V., Mastrantonio, E., Gangemi, S., Pioggia, G., et al. (2022) · Nutrients · doi:10.3390/nu14122534 · Cited by 16
Suma, S., Suehara, Y., Fujisawa, M., Abe, Y., Hattori, K., Makishima, K., Sakamoto, T., Sawa, A., Bando, H., Kaji, D., et al. (2023) · Leukemia · doi:10.1038/s41375-023-02093-7 · Cited by 17
Viral infection and host immune response in diabetes
Joshi, G., Das, A., Verma, G., & Guchhait, P. (2023) · IUBMB Life · doi:10.1002/iub.2794 · Cited by 21
A Review on Currently Available Potential Therapeutic Options for COVID-19
Moghadam, S. O. (2020) · International Journal of General Medicine · doi:10.2147/ijgm.s263666 · Cited by 20
Leukotrienes, a potential target for Covid-19
Citron, F., Perelli, L., Deem, A. K., Genovese, G., & Viale, A. (2020) · Prostaglandins Leukotrienes and Essential Fatty Acids · doi:10.1016/j.plefa.2020.102174 · Cited by 16
Wu, Y., Wang, S., Wu, C.-H., Yen, L.-C., Lai, H.-F., Ho, C., & Chiu, Y. (2020) · PLoS ONE · doi:10.1371/journal.pone.0242900 · Cited by 15
SARS-CoV-2 infection: molecular mechanisms of severe outcomes to suggest therapeutics
Hartog, N., Faber, W., Frisch, A., Bauss, J. M., Bupp, C. P., Rajasekaran, S., & Prokop, J. W. (2021) · Expert Review of Proteomics · doi:10.1080/14789450.2021.1908894 · Cited by 14
Boulanger, M. C., Molina, E., Wang, K., Kickler, T. S., Xu, Y., & Garibaldi, B. T. (2021) · The American Journal of Medicine · doi:10.1016/j.amjmed.2021.01.040 · Cited by 15
Codd, A. S., Hanna, S. J., Compeer, E. B., Richter, F. C., Pring, E. J., Gea-Mallorquí, E., Borsa, M., Moon, O. R., Scourfield, D. O., Ahern, D., et al. (2021) · Oxford Open Immunology · doi:10.1093/oxfimm/iqab016 · Cited by 16
Metadata
- Authors
- Wen, W., Su, W., Tang, H., Le, W., Zhang, X., Zheng, Y., Liu, X., Xie, L., Li, J., Ye, J., Dong, L., Cui, X., Miao, Y., Wang, D., Dong, J., Xiao, C., Chen, W., & Wang, H.
- Affiliations
- Second Military Medical University (CN)
- Sun Yat-sen University (CN)
- Wuhan Hankou Hospital (CN)
- Corresponding author
- Chen, Wei
- Wang, Hongyang
- ORCID
- Venue
- Cell Discovery
- Published
- 2020-05-04
- Volume
- 6
- Issue
- 1
- Pages
- 31-31
- ISSN
- 2056-5968 (ISSN-L)
- PMC
- PMC7197635
- OpenAlex
- W3021575042
- Cited by
- 730
- References
- 49
- Citations by year
- 2026: 14 · 2025: 37 · 2024: 53 · 2023: 72 · 2022: 138 · 2021: 222 · 2020: 194
- FWCI
- 20.71
- Type
- journal article
- Language
- en
- Update notices
- correction (2020-06-20)
- Open access
- gold
- doi.org
- Locations
- Cell Discovery (publishedVersion, cc-by)
- medRxiv (acceptedVersion)
- PubMed Central (publishedVersion, cc-by)
- PubMed (publishedVersion)
- Funders
- National Natural Science Foundation of China (81830054, 81988101,91859205, 81722034, 81670015, 81530028,81721003)
- Ministry of Science and Technology of the People's Republic of China (2018ZX09101002, 2017ZX100203205)
- Shanghai Municipal Human Resources and Social Security Bureau (2019PJD059)
- Natural Science Foundation of Guangdong Province (2016A030306006, 2020B1515020057)
- Topics
- Health Sciences › Medicine › Infectious Diseases › COVID-19 Clinical Research Studies
- Health Sciences › Medicine › Infectious Diseases › SARS-CoV-2 and COVID-19 Research
- Life Sciences › Biochemistry, Genetics and Molecular Biology › Molecular Biology › Single-cell and spatial transcriptomics
- Keywords
- COVID-19 pandemic, SARS-CoV-2, immune profiling, recovery stages, peripheral blood mononuclear cells, T cell depletion, monocytes, CD14+ monocytes, IL-1β, B cells, plasma cells, B cell receptor, IGHV3-23, inflammatory storm, macrophage colony-stimulating factor, cytokines, vaccine development
About these checks
Registry, retraction, Cites and statistics results are computed, not judged, with one exception: a printed reference that no index lists is read once by a model before it counts as a citation error. Claims are extracted by a model and kept only when their quote appears verbatim in the text; each cited source is then checked, with a model’s help, for whether it says what the claim relies on. Those verdicts can be wrong — read the claim’s quote and the cited source before relying on one.
Statistics and arithmetic are recomputed, not judged.
Confidence bands are shown only for fields calibrated on our annotated test set. None is calibrated yet, so no band is shown.
What counts as a claim ›How we measure confidence ›How we check this ›
Are you an author, or do you see a problem with this page? Request a review
