Cited by 9

The DOI matches its Crossref record; 4 of the 4 references it cites were found in a registry or an index.

Immune response and homeostasis mechanism following administration of BBIBP-CorV SARS-CoV-2 inactivated vaccine

Yin, Jianhua, Zhao, Yingze, Huang, Fubaoqian, Yang, Yunkai, Huang, Yaling, Zhuang, Zhenkun, Wang, Yanxia, Wang, Zhifeng, Lin, Xiumei, Zheng, Yuhui, Zhou, Wenwen, Wang, Shuo, Xu, Ziqian, Ye, Beiwei, Guo, Yaxin, Lei, Wenwen, Li, Lei, Tian, Jinmin, Gan, Jinxian, Wang, Hui, Wang, Wei, Ma, Peiyao, Liu, Chang, Wei, Xiaoyu, Shi, Xuyang, Wang, Zifei, Wang, Yang, Liu, Ying, Yang, Mingming, Yuan, Yue, Song, Yumo, Ma, Wen, Huang, Zhuoli, Liu, Ya, Huang, Yunting, Lu, Haorong, Liu, Peipei, Liang, Hao, Hou, Yong, Xu, Xun, Liu, Longqi, Zhang, Yuntao, Wu, Guizhen, Gao, George F., Jin, Xin, Liu, Chuanyu, Yang, Xiaoming, Liu, William J.·2023·The Innovation

Overview

The claims and statistics of this paper haven’t been checked yet.

Run the check — free, no account needed. It reads the open-access text and checks the sources it cites.

A few free checks a day · papers already verified open instantly · results are public

Integrity signals

Registry

Crossref · 10.1016/j.xinn.2022.100359

Cites

4 of 4 references verified0 citation errors · 0 not checkable

Statistics

Figures

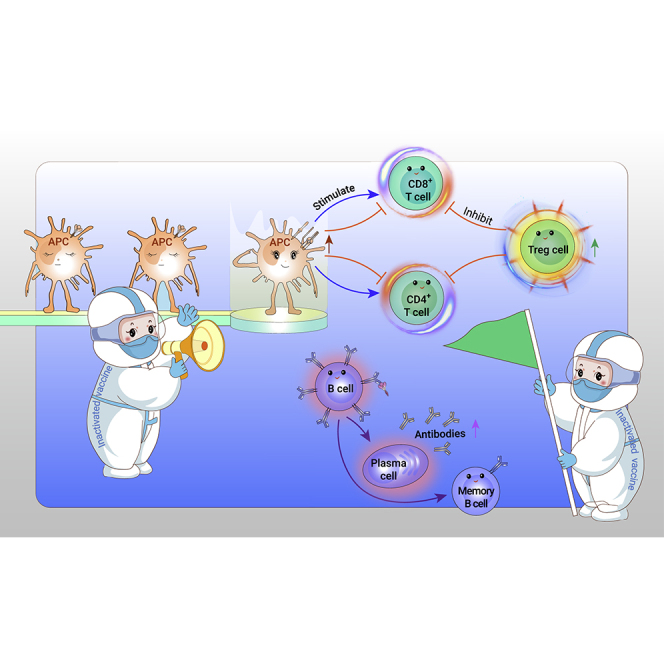
Graphical abstract
Graphical abstract CC BY-NC-ND · PubMed Central
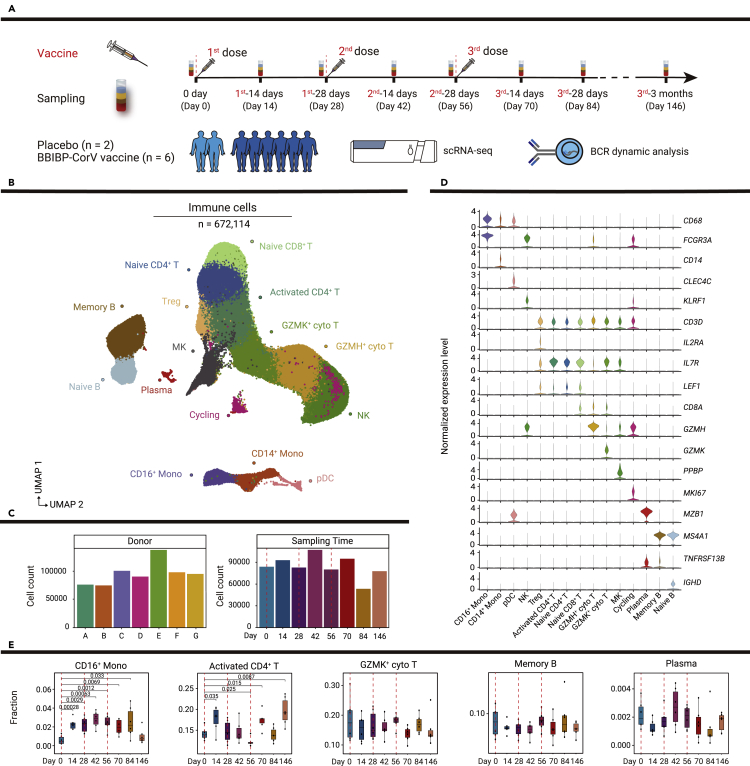
Figure 1 Study design and single-cell analysis of PBMC dynamics in vaccine and placebo recipients (A) Flowchart of the study design. Eight participants received three doses of placebo or BBIBP-CorV vaccine, and blood samples were collected from these participants at eight time points divided before and after vaccinations. Then, scRNA-seq and B cell receptor dynamic analysis were conducted. Red dotted lines indicate inoculation days. (B) Uniform manifold approximation and projection (UMAP) plot shows 15 cell types of 672,114 immune cells by unsupervised clustering. Each cell type is indicated by a different color. (C) Bar plots show the number of cells in each sample and the number of cells at each time point. A, B, C, D, E, and G represent vaccine recipients, while F represents a placebo recipient. (D) Violin plots show the normalized expression levels of canonical markers defining cell types in (B). (E) Boxplots show the proportions of selected cells at all time points. p values < 0.05 (Student’s t test) are indicated.
Figure 1 Study design and single-cell analysis of PBMC dynamics in vaccine and placebo recipients (A) Flowchart of the study design. Eight participants received three doses of placebo or BBIBP-CorV vaccine, and blood samples were collected from these participants at eight time points divided before and after vaccinations. Then, scRNA-seq and B cell receptor dynamic analysis were conducted. Red dotted lines indicate inoculation days. (B) Uniform manifold approximation and projection (UMAP) plot shows 15 cell types of 672,114 immune cells by unsupervised clustering. Each cell type is indicated by a different color. (C) Bar plots show the number of cells in each sample and the number of cells at each time point. A, B, C, D, E, and G represent vaccine recipients, while F represents a placebo recipient. (D) Violin plots show the normalized expression levels of canonical markers defining cell types in (B). (E) Boxplots show the proportions of selected cells at all time points. p values < 0.05 (Student’s t test) are indicated.CC BY-NC-ND · PubMed Central
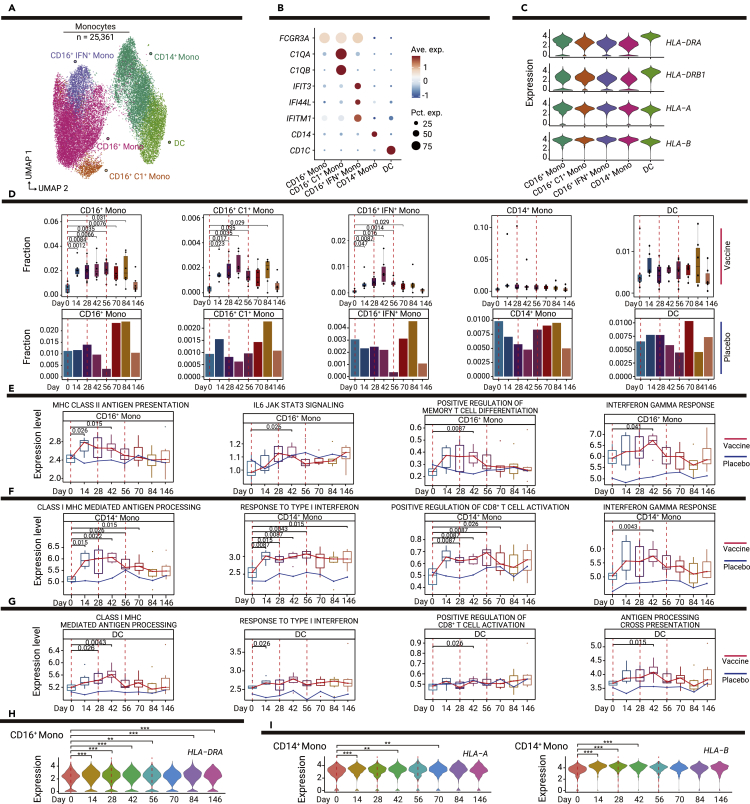
Figure 2 Dynamic changes in innate immune responses among myeloid cell subsets (A) UMAP plot shows the results of sub-clustering involving 25,361 monocytes. (B) Dot plot shows the expression levels of selected genes in the five subsets of myeloid cells. Dot color indicates mean expression level and dot size indicates the percentage of the cell expressing the gene. (C) Violin plot shows the expression levels of MHC-II and MHC-I genes in myeloid cell subsets. (D) Boxplots show the proportions of myeloid cell subsets in vaccine recipients at all time points; bar plots show the proportions of myeloid cell subsets in one placebo recipient at all time points. p values < 0.05 (Student’s t test) are indicated. (E–G) Changes in functional pathways over time in monocyte subsets, the red line indicates the median expression level of vaccine recipients, the blue line indicates the expression level of the placebo recipient, including CD16+ monocytes (E), CD4+ monocytes (F), and DCs (G). p values < 0.05 (Wilcoxon rank-sum test) are indicated. (H) Violin plot shows the dynamic changes in MHC-II expression levels over time in CD16+ monocytes. ∗p < 0.05, ∗∗p < 0.01, and ∗∗∗p < 0.001 (Wilcoxon rank-sum test). (I) Violin plots show dynamic changes in MHC-II and MHC-I expression levels over time in CD14+ monocytes. ∗p < 0.05, ∗∗p < 0.01, and ∗∗∗p < 0.001 (Wilcoxon rank-sum test).
Figure 2 Dynamic changes in innate immune responses among myeloid cell subsets (A) UMAP plot shows the results of sub-clustering involving 25,361 monocytes. (B) Dot plot shows the expression levels of selected genes in the five subsets of myeloid cells. Dot color indicates mean expression level and dot size indicates the percentage of the cell expressing the gene. (C) Violin plot shows the expression levels of MHC-II and MHC-I genes in myeloid cell subsets. (D) Boxplots show the proportions of myeloid cell subsets in vaccine recipients at all time points; bar plots show the proportions of myeloid cell subsets in one placebo recipient at all time points. p values < 0.05 (Student’s t test) are indicated. (E–G) Changes in functional pathways over time in monocyte subsets, the red line indicates the median expression level of vaccine recipients, the blue line indicates the expression level of the placebo recipient, including CD16+ monocytes (E), CD4+ monocytes (F), and DCs (G). p values < 0.05 (Wilcoxon rank-sum test) are indicated. (H) Violin plot shows the dynamic changes in MHC-II expression levels over time in CD16+ monocytes. ∗p < 0.05, ∗∗p < 0.01, and ∗∗∗p < 0.001 (Wilcoxon rank-sum test). (I) Violin plots show dynamic changes in MHC-II and MHC-I expression levels over time in CD14+ monocytes. ∗p < 0.05, ∗∗p < 0.01, and ∗∗∗p < 0.001 (Wilcoxon rank-sum test).CC BY-NC-ND · PubMed Central
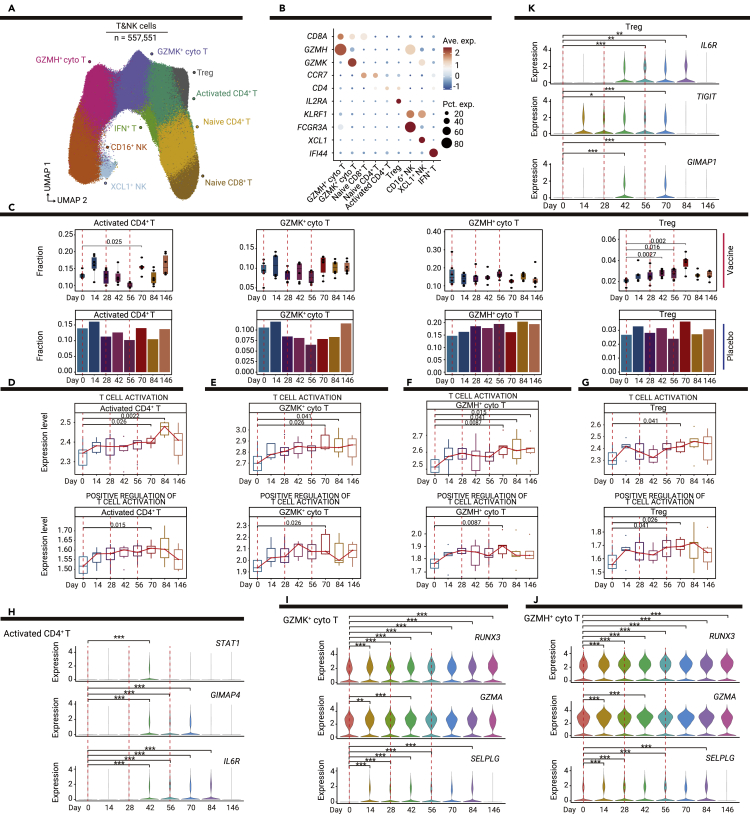
Figure 3 Vaccine-mediated induction of T cell responses in T and NK cell subsets (A) UMAP plot shows the results of sub-clustering involving 557,551 T and NK cells. (B) Dot plot shows the expression levels of selected genes in the nine subsets of T and NK cells. Dot color indicates mean expression level and dot size indicates the proportion of cells expressing the gene. (C) Boxplots show the proportions of T and NK cell subsets in vaccine recipients at all time points; bar plots show the proportions of T and NK cell subsets in one placebo recipient at all time points. p values < 0.05 (Student’s t test) are indicated. (D–G) Changes in T cell activation and positive regulation of T cell activation pathways over time in T cell subsets; the red line indicates the median expression level of vaccine recipients, including activated CD4+ T cells (D), GZMK+ cytotoxic T cells (E), GZMH+ cytotoxic T cells (F), and Treg cells (G). p values < 0.05 (Wilcoxon rank-sum test) are indicated. (H–K) Violin plots show dynamic changes in the expression levels of selected genes over time in T cell subsets, including activated CD4+ T cells (H), GZMK+ cytotoxic T cells (I), GZMH+ cytotoxic T cells (J), and Treg cells (K). ∗p < 0.05, ∗∗p < 0.01, and ∗∗∗p < 0.001 (Wilcoxon rank-sum test).
Figure 3 Vaccine-mediated induction of T cell responses in T and NK cell subsets (A) UMAP plot shows the results of sub-clustering involving 557,551 T and NK cells. (B) Dot plot shows the expression levels of selected genes in the nine subsets of T and NK cells. Dot color indicates mean expression level and dot size indicates the proportion of cells expressing the gene. (C) Boxplots show the proportions of T and NK cell subsets in vaccine recipients at all time points; bar plots show the proportions of T and NK cell subsets in one placebo recipient at all time points. p values < 0.05 (Student’s t test) are indicated. (D–G) Changes in T cell activation and positive regulation of T cell activation pathways over time in T cell subsets; the red line indicates the median expression level of vaccine recipients, including activated CD4+ T cells (D), GZMK+ cytotoxic T cells (E), GZMH+ cytotoxic T cells (F), and Treg cells (G). p values < 0.05 (Wilcoxon rank-sum test) are indicated. (H–K) Violin plots show dynamic changes in the expression levels of selected genes over time in T cell subsets, including activated CD4+ T cells (H), GZMK+ cytotoxic T cells (I), GZMH+ cytotoxic T cells (J), and Treg cells (K). ∗p < 0.05, ∗∗p < 0.01, and ∗∗∗p < 0.001 (Wilcoxon rank-sum test).CC BY-NC-ND · PubMed Central
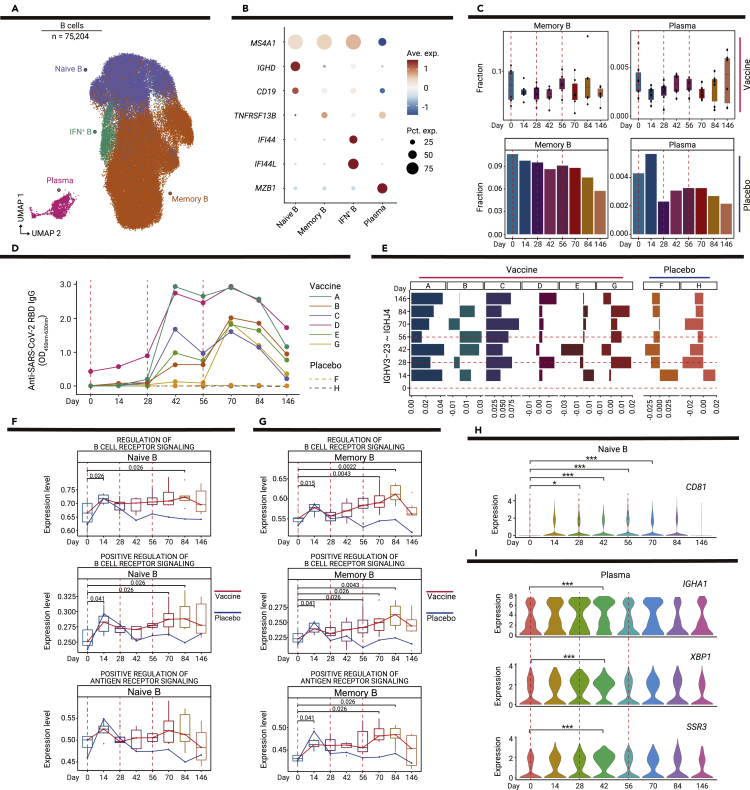
Figure 4 Dynamic changes in functional status among B cell subsets (A) UMAP plot shows the results of sub-clustering involving 75,204 B cells. (B) Dot plot shows the expression level of selected genes in four subsets of B cells. Dot color indicates mean expression level and dot size indicates the proportion of cells expressing the gene. (C) Boxplots show the proportions of memory B and plasma cells in six vaccine recipients at all time points; bar plots show the proportions of memory B and plasma cells in one placebo recipient at all time points. p values < 0.05 (Student’s t test) are indicated. (D) Line chart shows the dynamic changes in anti-receptor-binding domain IgG levels in six vaccine recipients and two placebo recipients, as determined by enzyme-linked immunosorbent assays. (E) Bar plot shows the proportion of IGHV3-23-IGHJ4 pairs in six vaccine recipients and two placebo recipients. The proportion of IGHV3-23-IGHJ4 pairs in each time point is minus the proportion on day 0. (F and G) Changes in pathways regulating B cell receptor signaling over time in memory B cells (F) and plasma cells (G); the red line indicates the median expression level of vaccine recipients, the blue line indicates the expression level of the placebo recipient. p values < 0.05 (Wilcoxon rank-sum test) are indicated. (H) Violin plot shows the expression level CD81 at dynamic time points in naive B cells. ∗p < 0.05, ∗∗p < 0.01, and ∗∗∗p < 0.001 (Wilcoxon rank-sum test). (I) Violin plots show dynamic changes in the expression levels of IGHA1, XBP1, and SSR3 over time in plasma cells. ∗p < 0.05, ∗∗p < 0.01, and ∗∗∗p < 0.001 (Wilcoxon rank-sum test).
Figure 4 Dynamic changes in functional status among B cell subsets (A) UMAP plot shows the results of sub-clustering involving 75,204 B cells. (B) Dot plot shows the expression level of selected genes in four subsets of B cells. Dot color indicates mean expression level and dot size indicates the proportion of cells expressing the gene. (C) Boxplots show the proportions of memory B and plasma cells in six vaccine recipients at all time points; bar plots show the proportions of memory B and plasma cells in one placebo recipient at all time points. p values < 0.05 (Student’s t test) are indicated. (D) Line chart shows the dynamic changes in anti-receptor-binding domain IgG levels in six vaccine recipients and two placebo recipients, as determined by enzyme-linked immunosorbent assays. (E) Bar plot shows the proportion of IGHV3-23-IGHJ4 pairs in six vaccine recipients and two placebo recipients. The proportion of IGHV3-23-IGHJ4 pairs in each time point is minus the proportion on day 0. (F and G) Changes in pathways regulating B cell receptor signaling over time in memory B cells (F) and plasma cells (G); the red line indicates the median expression level of vaccine recipients, the blue line indicates the expression level of the placebo recipient. p values < 0.05 (Wilcoxon rank-sum test) are indicated. (H) Violin plot shows the expression level CD81 at dynamic time points in naive B cells. ∗p < 0.05, ∗∗p < 0.01, and ∗∗∗p < 0.001 (Wilcoxon rank-sum test). (I) Violin plots show dynamic changes in the expression levels of IGHA1, XBP1, and SSR3 over time in plasma cells. ∗p < 0.05, ∗∗p < 0.01, and ∗∗∗p < 0.001 (Wilcoxon rank-sum test).CC BY-NC-ND · PubMed Central
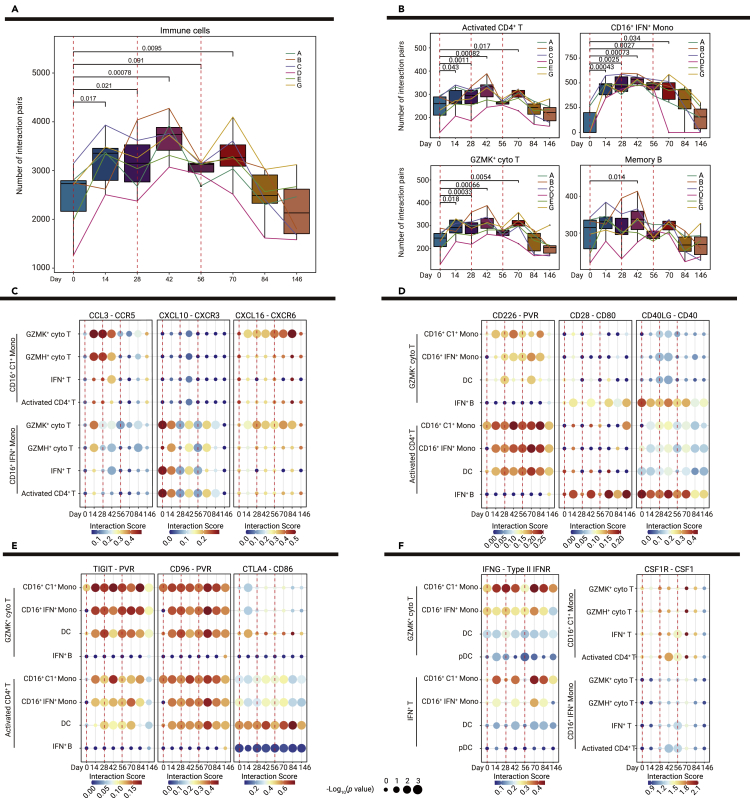
Figure 5 Dynamic changes in interactions between innate and adaptive immunity (A) Boxplots show the numbers of interaction pairs among overall immune cells over time in six vaccine recipients; sample points from the same recipient are connected via lines in the same color. p values < 0.05 (Student' s t test) are indicated. (B) Bar and line plots show the numbers of interaction pairs in selected cell subsets over time in six vaccine recipients; sample points from the same recipient are connected via lines in the same color. p values < 0.05 (Student' s t test) are indicated. (C–F) Dot plots show the potential ligand-receptor pairs among innate immune cell subsets and adaptive immune cell subsets over time, including chemokine-receptor pairs indicative of interactions between monocyte and T cell subsets (C), co-stimulatory ligand-receptor pairs indicative of interactions between T cell and APC subsets (D), co-inhibitory ligand-receptor pairs indicative of interactions between T cell and APCs subsets (E), and IFNG-type II IFNR and CSF1-CSR1R pairs (F). Dot colors show the interaction scores calculated using the CellPhoneDB, while dot sizes indicate p values.
Figure 5 Dynamic changes in interactions between innate and adaptive immunity (A) Boxplots show the numbers of interaction pairs among overall immune cells over time in six vaccine recipients; sample points from the same recipient are connected via lines in the same color. p values < 0.05 (Student' s t test) are indicated. (B) Bar and line plots show the numbers of interaction pairs in selected cell subsets over time in six vaccine recipients; sample points from the same recipient are connected via lines in the same color. p values < 0.05 (Student' s t test) are indicated. (C–F) Dot plots show the potential ligand-receptor pairs among innate immune cell subsets and adaptive immune cell subsets over time, including chemokine-receptor pairs indicative of interactions between monocyte and T cell subsets (C), co-stimulatory ligand-receptor pairs indicative of interactions between T cell and APC subsets (D), co-inhibitory ligand-receptor pairs indicative of interactions between T cell and APCs subsets (E), and IFNG-type II IFNR and CSF1-CSR1R pairs (F). Dot colors show the interaction scores calculated using the CellPhoneDB, while dot sizes indicate p values.CC BY-NC-ND · PubMed Central
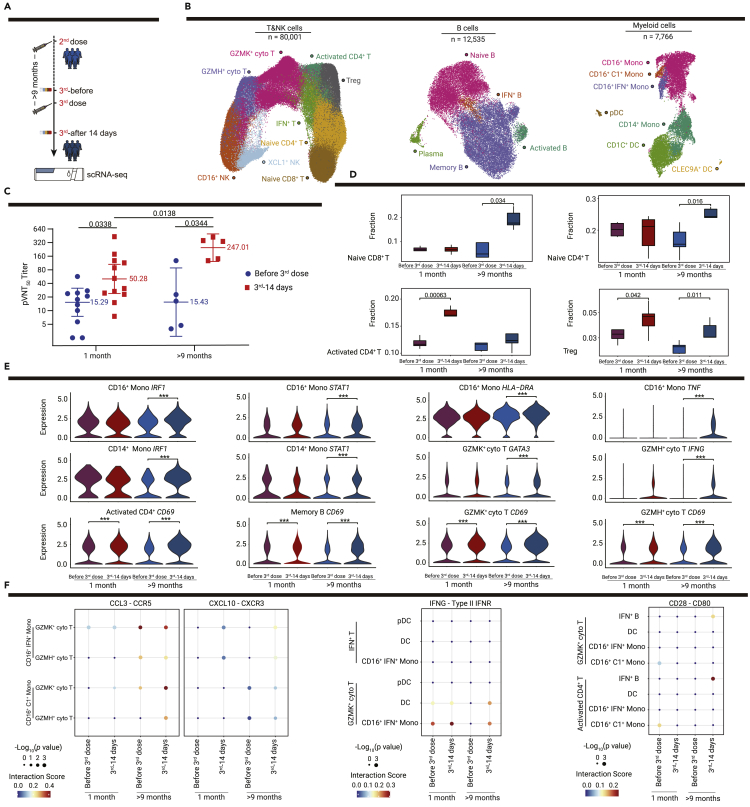
Figure 6 Changes in the immune response after the third dose vaccination using different booster dosing strategies (A) Flowchart of the sampling design for validation cohort 2 (n = 6, who received the third dose more than 9 months after the second injection). (B) UMAP plots show immune cells of the discovery cohort (n = 6) and validation cohort 2 (n = 5) before and after the third dose vaccination, including subsets of T and NK cells, B cells and myeloid cells by unsupervised clustering. Each cell type is indicated by a different color. (C) Comparison of neutralizing antibody titers before and after the third dose vaccination with 1 month or more than 9 month intervals between the second and third vaccinations, blue dots show the neutralizing antibody titers of vaccine recipients before the third dose vaccination, and red squares show the neutralizing antibody titers 14 days after the third injections. Median titers of groups at each time point are indicated. p values < 0.05 (paired t test and Student’s t test) are indicated. (D) Boxplots show the proportions of T cell subsets for the discovery cohort and validation cohort 2 before and after the third dose vaccination. p values < 0.05 are indicated; ∗p < 0.05, ∗∗p < 0.01, and ∗∗∗p < 0.001 (Student’s t test). (E) Violin plot shows the expression levels of selected genes in selected cell types before and after the third dose vaccination in the discovery cohort and validation cohort 2. ∗p < 0.05, ∗∗p < 0.01, and ∗∗∗p < 0.001 (Wilcoxon rank-sum test). (F) Dot plots show the potential ligand-receptor pairs among APCs and T cell subsets before and after the third dose vaccination in the discovery cohort and validation cohort 2. Dot colors show the interaction scores calculated using the CellPhoneDB, while dot sizes indicate the p values.
Figure 6 Changes in the immune response after the third dose vaccination using different booster dosing strategies (A) Flowchart of the sampling design for validation cohort 2 (n = 6, who received the third dose more than 9 months after the second injection). (B) UMAP plots show immune cells of the discovery cohort (n = 6) and validation cohort 2 (n = 5) before and after the third dose vaccination, including subsets of T and NK cells, B cells and myeloid cells by unsupervised clustering. Each cell type is indicated by a different color. (C) Comparison of neutralizing antibody titers before and after the third dose vaccination with 1 month or more than 9 month intervals between the second and third vaccinations, blue dots show the neutralizing antibody titers of vaccine recipients before the third dose vaccination, and red squares show the neutralizing antibody titers 14 days after the third injections. Median titers of groups at each time point are indicated. p values < 0.05 (paired t test and Student’s t test) are indicated. (D) Boxplots show the proportions of T cell subsets for the discovery cohort and validation cohort 2 before and after the third dose vaccination. p values < 0.05 are indicated; ∗p < 0.05, ∗∗p < 0.01, and ∗∗∗p < 0.001 (Student’s t test). (E) Violin plot shows the expression levels of selected genes in selected cell types before and after the third dose vaccination in the discovery cohort and validation cohort 2. ∗p < 0.05, ∗∗p < 0.01, and ∗∗∗p < 0.001 (Wilcoxon rank-sum test). (F) Dot plots show the potential ligand-receptor pairs among APCs and T cell subsets before and after the third dose vaccination in the discovery cohort and validation cohort 2. Dot colors show the interaction scores calculated using the CellPhoneDB, while dot sizes indicate the p values.CC BY-NC-ND · PubMed Central

Verification

Claims the paper makes

The claims and statistics of this paper haven’t been checked yet.

Run the check — free, no account needed. It reads the open-access text and checks the sources it cites.

A few free checks a day · papers already verified open instantly · results are public

Claims other papers make about this one

Each is checked against this paper’s own text: does it say what the citing paper says it does?

Self-check

Percentages, sums and reported differences re-computed from the paper’s own numbers.

The self-check needs the paper’s full text.

Citations

Cites

Show all 4 references

Research works printed but not linked: 25

  1. Pollard, 2021, A guide to vaccinology: from basic principles to new developments, Nat. Rev. Immunol., 21, 83, 10.1038/s41577-020-00479-7 · DOI · Paper page
  2. Hotez, 2022, Whole inactivated virus and protein-based COVID-19 vaccines, Annu. Rev. Med., 73, 55, 10.1146/annurev-med-042420-113212 · DOI
  3. Xia, 2021, Safety and immunogenicity of an inactivated SARS-CoV-2 vaccine, BBIBP-CorV: a randomised, double-blind, placebo-controlled, phase 1/2 trial, Lancet Infect. Dis., 21, 39, 10.1016/S1473-3099(20)30831-8 · DOI
  4. Xia, 2022, Safety and immunogenicity of an inactivated COVID-19 vaccine, BBIBP-CorV, in people younger than 18 years: a randomised, double-blind, controlled, phase 1/2 trial, Lancet Infect. Dis., 22, 196, 10.1016/S1473-3099(21)00462-X · DOI
  5. Deng, 2021, SARS-CoV-2-specific T cell immunity to structural proteins in inactivated COVID-19 vaccine recipients, Cell. Mol. Immunol., 18, 2040, 10.1038/s41423-021-00730-8 · DOI
  6. Noé, 2020, The application of single-cell RNA sequencing in vaccinology, J. Immunol. Res., 2020, 8624963
  7. Cao, 2021, Integrated single-cell analysis revealed immune dynamics during Ad5-nCoV immunization, Cell Discov., 7, 64, 10.1038/s41421-021-00300-2 · DOI
  8. Arunachalam, 2021, Systems vaccinology of the BNT162b2 mRNA vaccine in humans, Nature, 596, 410, 10.1038/s41586-021-03791-x · DOI · Paper page
  9. Liu, 2021, Comprehensive investigations revealed consistent pathophysiological alterations after vaccination with COVID-19 vaccines, Cell Discov., 7, 99, 10.1038/s41421-021-00329-3 · DOI
  10. Pulendran, 2006, Translating innate immunity into immunological memory: implications for vaccine development, Cell, 124, 849, 10.1016/j.cell.2006.02.019 · DOI
  11. Jarjour, 2021, T cell memory: understanding COVID-19, Immunity, 54, 14, 10.1016/j.immuni.2020.12.009 · DOI
  12. Meckiff, 2020, Imbalance of regulatory and cytotoxic SARS-CoV-2-reactive CD4(+) T cells in COVID-19, Cell, 183, 1340, 10.1016/j.cell.2020.10.001 · DOI
  13. Tinoco, 2016, PSGL-1 is an immune checkpoint regulator that promotes T cell exhaustion, Immunity, 44, 1470, 10.1016/j.immuni.2016.05.011 · DOI
  14. Quast, 2021, B cell memory: understanding COVID-19, Immunity, 54, 205, 10.1016/j.immuni.2021.01.014 · DOI
  15. Maecker, 1997, Normal lymphocyte development but delayed humoral immune response in CD81-null mice, J. Exp. Med., 185, 1505, 10.1084/jem.185.8.1505 · DOI
  16. Efremova, 2020, CellPhoneDB: inferring cell-cell communication from combined expression of multi-subunit ligand-receptor complexes, Nat. Protoc., 15, 1484, 10.1038/s41596-020-0292-x · DOI · Paper page
  17. Chen, 2013, Molecular mechanisms of T cell co-stimulation and co-inhibition, Nat. Rev. Immunol., 13, 227, 10.1038/nri3405 · DOI · Paper page
  18. Lindqvist, 2010, T regulatory cells control T-cell proliferation partly by the release of soluble CD25 in patients with B-cell malignancies, Immunology, 131, 371, 10.1111/j.1365-2567.2010.03308.x · DOI
  19. McElvaney, 2020, Characterization of the inflammatory response to severe COVID-19 illness, Am. J. Respir. Crit. Care Med., 202, 812, 10.1164/rccm.202005-1583OC · DOI
  20. Gebre, 2022, mRNA vaccines induce rapid antibody responses in mice, NPJ Vaccines, 7, 88, 10.1038/s41541-022-00511-y · DOI
  21. Zeng, 2022, Immunogenicity and safety of a third dose of CoronaVac, and immune persistence of a two-dose schedule, in healthy adults: interim results from two single-centre, double-blind, randomised, placebo-controlled phase 2 clinical trials, Lancet Infect. Dis., 22, 483, 10.1016/S1473-3099(21)00681-2 · DOI
  22. Zhao, 2022, Omicron SARS-CoV-2 neutralization from inactivated and ZF2001 vaccines, N. Engl. J. Med., 387, 277, 10.1056/NEJMc2206900 · DOI
  23. Tindemans, 2014, GATA-3 function in innate and adaptive immunity, Immunity, 41, 191, 10.1016/j.immuni.2014.06.006 · DOI
  24. Zhang, 2022, Humoral and cellular immune memory to four COVID-19 vaccines, Cell, 185, 2434, 10.1016/j.cell.2022.05.022 · DOI
  25. Liu, 2022, Robust induction of B cell and T cell responses by a third dose of inactivated SARS-CoV-2 vaccine, Cell Discov., 8, 10, 10.1038/s41421-022-00373-7 · DOI

Cited by

Sorted by citations

See all 9

Metadata

Authors
Yin, J., Zhao, Y., Huang, F., Yang, Y., Huang, Y., Zhuang, Z., Wang, Y., Wang, Z., Lin, X., Zheng, Y., Zhou, W., Wang, S., Xu, Z., Ye, B., Guo, Y., Lei, W., Li, L., Tian, J., Gan, J., Wang, H., Wang, W., Ma, P., Liu, C., Wei, X., Shi, X., Wang, Z., Wang, Y., Liu, Y., Yang, M., Yuan, Y., Song, Y., Ma, W., Huang, Z., Liu, Y., Huang, Y., Lu, H., Liu, P., Liang, H., Hou, Y., Xu, X., Liu, L., Zhang, Y., Wu, G., Gao, G. F., Jin, X., Liu, C., Yang, X., & Liu, W. J.
Venue
The Innovation
Publisher
Elsevier BV
Published
2023-01
Volume
4
Issue
1
Pages
100359
ISSN
2666-6758
Cited by
9
References
4
Language
en

About these checks

Registry, retraction, Cites and statistics results are computed, not judged, with one exception: a printed reference that no index lists is read once by a model before it counts as a citation error. Claims are extracted by a model and kept only when their quote appears verbatim in the text; each cited source is then checked, with a model’s help, for whether it says what the claim relies on. Those verdicts can be wrong — read the claim’s quote and the cited source before relying on one.

Statistics and arithmetic are recomputed, not judged.

Confidence bands are shown only for fields calibrated on our annotated test set. None is calibrated yet, so no band is shown.

What counts as a claim ›How we measure confidence ›How we check this ›

Are you an author, or do you see a problem with this page? Request a review

How to cite

Cite CoChat for the checks on this page, and the paper for its own findings.

This page
CoChat. (2026). Citation check: Immune response and homeostasis mechanism following administration of BBIBP-CorV SARS-CoV-2 inactivated vaccine. https://app.cochat.ai/papers/10.1016/j.xinn.2022.100359
The paper
Yin, J., Zhao, Y., Huang, F., Yang, Y., Huang, Y., Zhuang, Z., Wang, Y., Wang, Z., Lin, X., Zheng, Y., Zhou, W., Wang, S., Xu, Z., Ye, B., Guo, Y., Lei, W., Li, L., Tian, J., Gan, J., . . . Liu, W. J. (2023). Immune response and homeostasis mechanism following administration of BBIBP-CorV SARS-CoV-2 inactivated vaccine. The Innovation. https://doi.org/10.1016/j.xinn.2022.100359