

The DOI matches its Crossref record; 51 of the 51 references it cites were found in a registry or an index.
Establishment of intestinal organoid cultures modeling injury-associated epithelial regeneration
Open accessAbstract
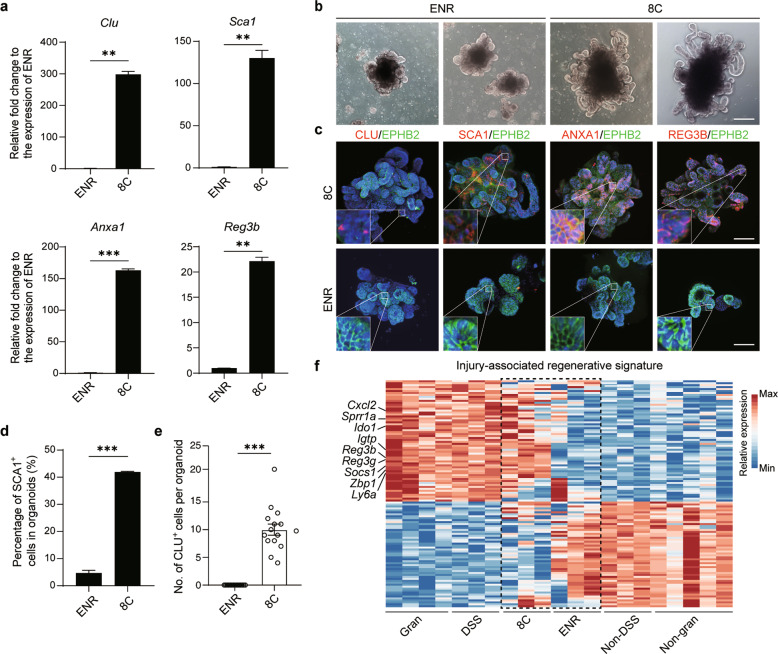
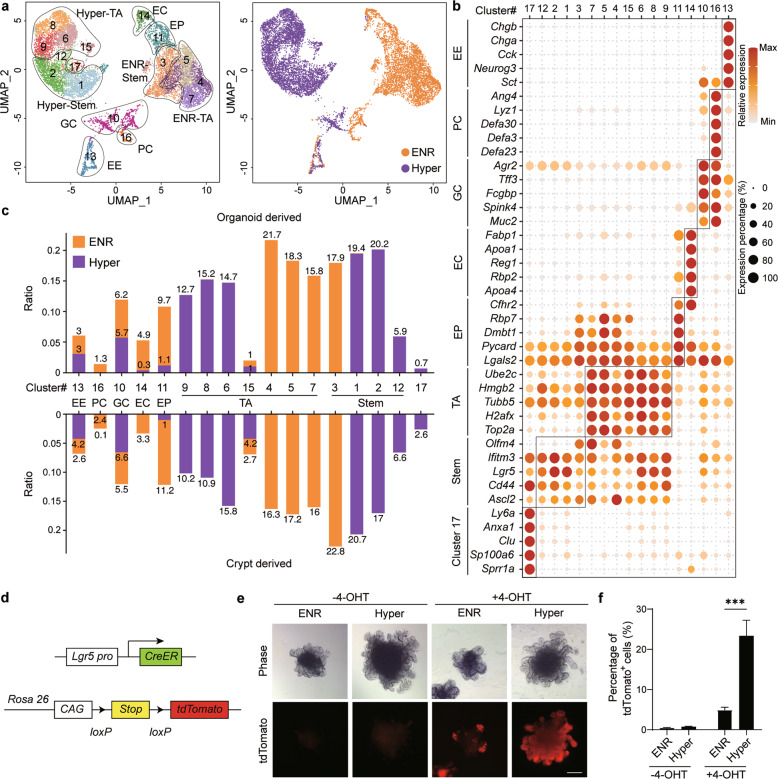
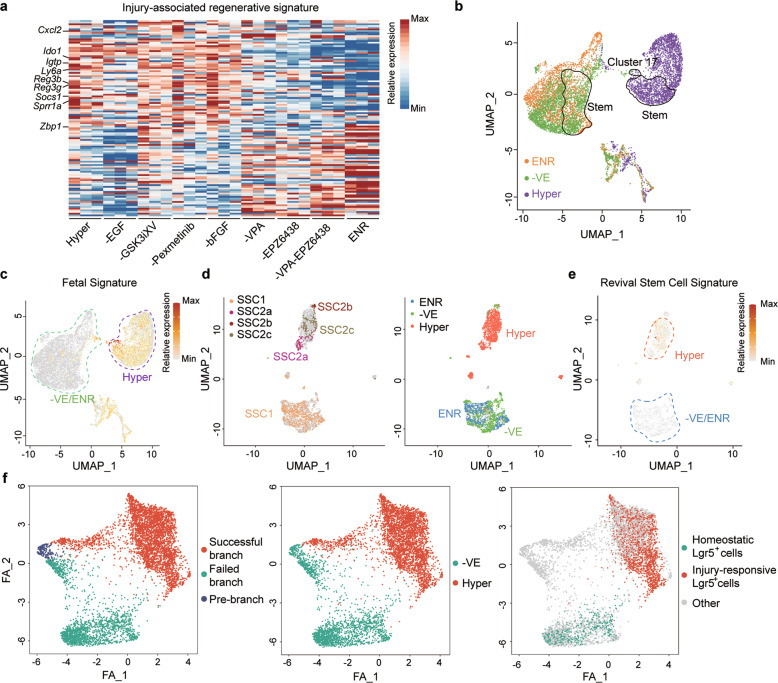
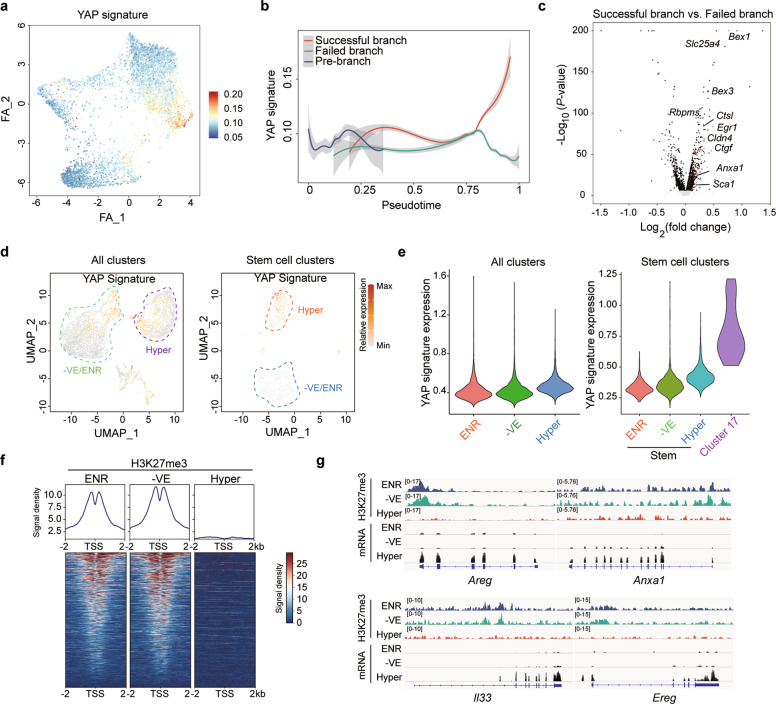
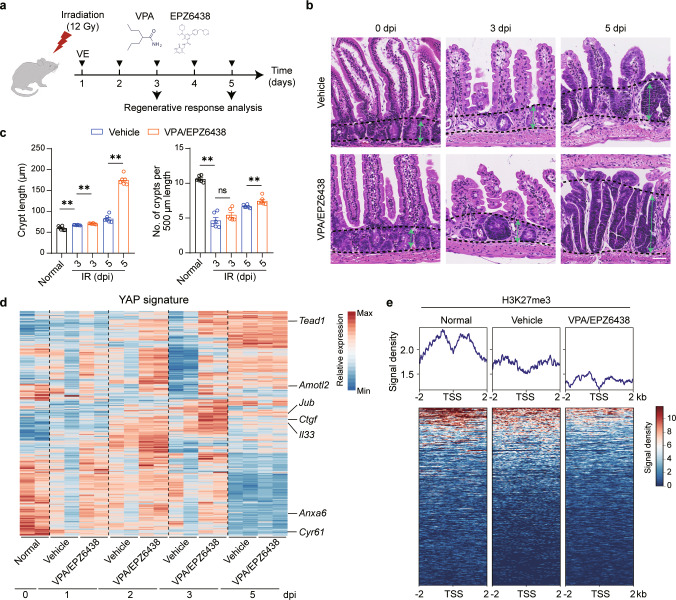
The capacity of 3D organoids to mimic physiological tissue organization and functionality has provided an invaluable tool to model development and disease in vitro. However, conventional organoid cultures primarily represent the homeostasis of self-organizing stem cells and their derivatives. Here, we established a novel intestinal organoid culture system composed of 8 components, mainly including VPA, EPZ6438, LDN193189, and R-Spondin 1 conditioned medium, which mimics the gut epithelium regeneration that produces hyperplastic crypts following injury; therefore, these organoids were designated hyperplastic intestinal organoids (Hyper-organoids). Single-cell RNA sequencing identified different regenerative stem cell populations in our Hyper-organoids that shared molecular features with in vivo injury-responsive Lgr5 + stem cells or Clu + revival stem cells. Further analysis revealed that VPA and EPZ6438 were indispensable for epigenome reprogramming and regeneration in Hyper-organoids, which functioned through epigenetically regulating YAP signaling. Furthermore, VPA and EPZ6438 synergistically promoted regenerative response in gut upon damage in vivo. In summary, our results demonstrated a new in vitro organoid model to study epithelial regeneration, highlighting the importance of epigenetic reprogramming that pioneers tissue repair.
Overview
The claims and statistics of this paper haven’t been checked yet.
Run the check — free, no account needed. It reads the open-access text and checks the sources it cites.
Integrity signals
Registry
Cites
Statistics
Figures
Verification
Claims the paper makes
The claims and statistics of this paper haven’t been checked yet.
Run the check — free, no account needed. It reads the open-access text and checks the sources it cites.
Claims other papers make about this one
Each is checked against this paper’s own text: does it say what the citing paper says it does?
The source backs part of the claim, not all of it — or backs it for a different population, condition or comparison.
In the citing paper
“Significant differences in morphology and functionality or even organoid formation efficiency depend on the different cells-of-origin of the culture or different cells in the organoid as well as different medium composition120,202–204.”
From Organoids (2022) · cites this paper as [120]
Experimental — accuracy not yet measuredThe source backs part of the claim, not all of it — or backs it for a different population, condition or comparison.
In the citing paper
“In that regard, a nice example was described by Fujii M et al. who demonstrated how refining of culture conditions could increase the diversity of differentiated cell fates in human small intestinal organoids120.”
From Organoids (2022) · cites this paper as [120]
Experimental — accuracy not yet measured
Self-check
Percentages, sums and reported differences re-computed from the paper’s own numbers.
The self-check needs the paper’s full text.
Citations
Cites
Fast and accurate short read alignment with Burrows-Wheeler transform
Li, H., & Durbin, R. (2009) · Bioinformatics · doi:10.1093/bioinformatics/btp324 · Cited by 58,607
Single Lgr5 stem cells build crypt-villus structures in vitro without a mesenchymal niche
Sato, T., Vries, R. G., Snippert, H. J., van de Wetering, M., Barker, N., Stange, D. E., van Es, J. H., Abo, A., Kujala, P., Peters, P. J., et al. (2009) · Nature · doi:10.1038/nature07935 · Cited by 7,204
Identification of stem cells in small intestine and colon by marker gene Lgr5
Barker, N., van Es, J. H., Kuipers, J., Kujala, P., van den Born, M., Cozijnsen, M., Haegebarth, A., Korving, J., Begthel, H., Peters, P. J., et al. (2007) · Nature · doi:10.1038/nature06196 · Cited by 5,687
Modeling Development and Disease with Organoids
Clevers, H. (2016) · Cell · doi:10.1016/j.cell.2016.05.082 · Cited by 3,196
Organogenesis in a dish: Modeling development and disease using organoid technologies
Lancaster, M. A., & Knoblich, J. A. (2014) · Science · doi:10.1126/science.1247125 · Cited by 2,931
Paneth cells constitute the niche for Lgr5 stem cells in intestinal crypts
Sato, T., van Es, J. H., Snippert, H. J., Stange, D. E., Vries, R. G., van den Born, M., Barker, N., Shroyer, N. F., van de Wetering, M., & Clevers, H. (2011) · Nature · doi:10.1038/nature09637 · Cited by 2,510
Snippert, H. J., van der Flier, L. G., Sato, T., van Es, J. H., van den Born, M., Kroon-Veenboer, C., Barker, N., Klein, A. M., van Rheenen, J., Simons, B. D., et al. (2010) · Cell · doi:10.1016/j.cell.2010.09.016 · Cited by 1,951
Directed differentiation of human pluripotent stem cells into intestinal tissue in vitro
Spence, J. R., Mayhew, C. N., Rankin, S. A., Kuhar, M. F., Vallance, J. E., Tolle, K. A., Hoskins, E. E., Kalinichenko, V. V., Wells, S. I., Zorn, A. M., et al. (2010) · Nature · doi:10.1038/nature09691 · Cited by 1,911
Phiel, C. J., Zhang, F., Huang, E. Y., Guenther, M. G., Lazar, M. A., & Klein, P. S. (2001) · Journal of Biological Chemistry · doi:10.1074/jbc.m101287200 · Cited by 1,758
A single-cell survey of the small intestinal epithelium
Haber, A. L., Biton, M., Rogel, N., Herbst, R. H., Shekhar, K., Smillie, C., Burgin, G., Delorey, T. M., Howitt, M. R., Katz, Y., et al. (2017) · Nature · doi:10.1038/nature24489 · Cited by 1,750
Cited by
Sorted by citations
Zhao, Z., Chen, X., Dowbaj, A. M., Sljukic, A., Bratlie, K., Lin, L., Fong, E. L. S., Balachander, G. M., Chen, Z., Soragni, A., et al. (2022) · Nature Reviews Methods Primers · doi:10.1038/s43586-022-00174-y · Cited by 1,082
Kim, S., Min, S., Choi, Y. S., Jo, S.-H., Jung, J. H., Han, K., Kim, J., An, S., Ji, Y. W., Kim, Y.-G., et al. (2022) · Nature Communications · doi:10.1038/s41467-022-29279-4 · Cited by 375
Mex3a marks drug-tolerant persister colorectal cancer cells that mediate relapse after chemotherapy
Álvarez-Varela, A., Novellasdemunt, L., Barriga, F. M., Hernando‐Momblona, X., Cañellas-Socias, A., Cano-Crespo, S., Sevillano, M., Cortina, C., Stork, D., Morral, C., et al. (2022) · Nature Cancer · doi:10.1038/s43018-022-00402-0 · Cited by 153
Organoids in gastrointestinal diseases: From experimental models to clinical translation
Günther, C., Winner, B., Neurath, M. F., & Stappenbeck, T. S. (2022) · Gut · doi:10.1136/gutjnl-2021-326560 · Cited by 145
Developments and Opportunities for 3D Bioprinted Organoids
Ya, R., Yang, X., Ma, Z., Sun, X., Zhang, Y., Li, W., Yang, H. S., Qiang, L., Yang, Z., Liu, Y., et al. (2021) · International Journal of Bioprinting · doi:10.18063/ijb.v7i3.364 · Cited by 131
TGFB1 induces fetal reprogramming and enhances intestinal regeneration
Chen, L., Qiu, X., Dupre, A., Pellón-Cárdenas, O., Fan, X., Xu, X., Rout, P., Walton, K. D., Burclaff, J., Zhang, R., et al. (2023) · Cell stem cell · doi:10.1016/j.stem.2023.09.015 · Cited by 119
Yao, Q., Cheng, S., Pan, Q., Yu, J., Cao, G., Li, L., & Cao, H. (2024) · MedComm · doi:10.1002/mco2.735 · Cited by 100
3d organ-on-a-chip: the convergence of microphysiological systems and organoids
Baptista, L. S., Porrini, C., Kronemberger, G. S., Kelly, D. J., & Perrault, C. M. (2022) · Frontiers in Cell and Developmental Biology · doi:10.3389/fcell.2022.1043117 · Cited by 90
Chemical reprogramming for cell fate manipulation: Methods, applications, and perspectives
Wang, J., Sun, S., & Deng, H. (2023) · Cell Stem Cell · doi:10.1016/j.stem.2023.08.001 · Cited by 91
Self-citationActivation of fetal-like molecular programs during regeneration in the intestine and beyond
Viragova, S., Li, D., & Klein, O. D. (2024) · Cell stem cell · doi:10.1016/j.stem.2024.05.009 · Cited by 89
Applications of human organoids in the personalized treatment for digestive diseases
Wang, Q., Guo, F., Jin, Y., & Ma, Y. (2022) · Signal Transduction and Targeted Therapy · doi:10.1038/s41392-022-01194-6 · Cited by 87
Qian, M., Liu, J., Zhao, D., Cai, P., Pan, C., Jia, W., Gao, Y., Zhang, Y., Zhang, N., Zhang, Y., et al. (2021) · Cellular and Molecular Gastroenterology and Hepatology · doi:10.1016/j.jcmgh.2021.08.014 · Cited by 71
The Hippo–YAP/TAZ Signaling Pathway in Intestinal Self-Renewal and Regeneration After Injury
Deng, F., Wu, Z., Zou, F., Wang, S., & Wang, X. (2022) · Frontiers in Cell and Developmental Biology · doi:10.3389/fcell.2022.894737 · Cited by 70
Mechanisms of radiation‐induced tissue damage and response
Zhou, L., Zhu, J., Liu, Y., Zhou, P., & Gu, Y. (2024) · MedComm · doi:10.1002/mco2.725 · Cited by 77
Current applications of intestinal organoids: a review
Xiang, T., Wang, J., & Li, H. (2024) · Stem Cell Research & Therapy · doi:10.1186/s13287-024-03768-3 · Cited by 62
Predicting Radiation-Induced Lung Injury in Patients With Lung Cancer: Challenges and Opportunities
Kuipers, M. E., Wink, K. C. J., Hiemstra, P. S., & Slats, A. M. (2023) · International Journal of Radiation Oncology*Biology*Physics · doi:10.1016/j.ijrobp.2023.10.044 · Cited by 55
Li, Y., Wang, X., Zhou, X., Chen, H., Song, S., Deng, L., Yao, Y., & Yin, X. (2025) · Nature Communications · doi:10.1038/s41467-024-55567-2 · Cited by 58
Pinto, S. F. T., Hosseini, M., Buckley, S. T., Yin, W., Garousi, J., Gräslund, T., van IJzendoorn, S., Santos, H. A., & Sarmento, B. F. C. C. (2024) · Journal of Controlled Release · doi:10.1016/j.jconrel.2024.01.015 · Cited by 51
Two-photon polymerization-based 3D micro-scaffolds toward biomedical devices
Wang, W., Chen, Z., Lin, B., Liu, M., Zhang, Y., Liu, S., Li, Y., & Zhao, Q. (2024) · Chemical Engineering Journal · doi:10.1016/j.cej.2024.152469 · Cited by 52
Advanced In Vitro Models for Preclinical Drug Safety: Recent Progress and Prospects
Nair, D. G., & Weiskirchen, R. (2024) · Current Issues in Molecular Biology · doi:10.3390/cimb47010007 · Cited by 50
Harnessing the power of artificial intelligence for human living organoid research
Wang, H., Li, X., You, X., & Zhao, G. (2024) · Bioactive Materials · doi:10.1016/j.bioactmat.2024.08.027 · Cited by 43
From morphology to single-cell molecules: high-resolution 3D histology in biomedicine
Xu, X., Su, J., Zhu, R., Li, K., Zhao, X., Fan, J., & Mao, F. (2025) · Molecular Cancer · doi:10.1186/s12943-025-02240-x · Cited by 43
Epigenetic memory of colitis promotes tumour growth
Nagaraja, S., Ojeda-Miron, L., Zhang, R., Oreskovic, E., Hock, C., Yan, H., Zeve, D., Sharma, K., Hyman, R. R., Zhang, Q., et al. (2026) · Nature · doi:10.1038/s41586-026-10258-4 · Cited by 36
Intracellular pH dynamics regulates intestinal stem cell lineage specification
Liu, Y., Reyes, E. A., Castillo‐Azofeifa, D., Klein, O. D., Nystul, T. G., & Barber, D. L. (2023) · Nature Communications · doi:10.1038/s41467-023-39312-9 · Cited by 30
Organoids as preclinical models of human disease: progress and applications
Chen, B., Du, C., Wang, M., Guo, J., & Liu, X. (2024) · Medical Review · doi:10.1515/mr-2023-0047 · Cited by 31
Parente, I. A., Chiara, L., & Bertoni, S. (2024) · Life Sciences · doi:10.1016/j.lfs.2024.122875 · Cited by 33
Nanomaterials in Organoids: From Interactions to Personalized Medicine
Shi, Y., Han, X., Zou, S., & Liu, G. (2024) · ACS Nano · doi:10.1021/acsnano.4c13330 · Cited by 30
Genetic and epigenetic alterations in aging and rejuvenation of human
Park, K., Jeon, M. C., Lee, D., Kim, J., & Im, S.-W. (2024) · Molecules and Cells · doi:10.1016/j.mocell.2024.100137 · Cited by 30
Engineered Human Organoids for Biomedical Applications
Zhu, Y., Sun, L., Wu, X., Gu, Z., & Zhao, Y. (2023) · Advanced Functional Materials · doi:10.1002/adfm.202310961 · Cited by 29
Theranostic Lipid Nanoparticles for Renal Cell Carcinoma
Mao, X., Wang, G., Wang, Z., Duan, C., Wu, X., & Xu, H. (2023) · Advanced Materials · doi:10.1002/adma.202306246 · Cited by 29
Listen to Your Gut: Key Concepts for Bioengineering Advanced Models of the Intestine
Cameron, O., Neves, J. F., & Gentleman, E. (2023) · Advanced Science · doi:10.1002/advs.202302165 · Cited by 26
Eskiocak, O., Gewolb, J., Shah, V., Rouse, J. A., Chowdhury, S., Akyildiz, E. O., Fernández-Maestre, I., Boyer, J. A., Filliol, A. A., Harris, A. S., et al. (2025) · Nature Aging · doi:10.1038/s43587-025-01022-w · Cited by 27
Qian, S., Mao, J., Liu, Z., Zhao, B., Zhao, Q., Lu, B., Zhang, L., Mao, X., Cheng, L., Cui, W., et al. (2022) · Smart Medicine · doi:10.1002/smmd.20220007 · Cited by 25
Kang, T. H., & Lee, S. I. (2024) · Journal of Animal Science and Biotechnology/Journal of animal science and biotechnology · doi:10.1186/s40104-023-00976-4 · Cited by 25
Lu, J. N., Křepelová, A., Rasa, S. M. M., Annunziata, F., Husak, O., Adam, L., Nunna, S., & Neri, F. (2021) · Scientific Reports · doi:10.1038/s41598-021-96321-8 · Cited by 26
Domene, A., Orozco, H., Rodríguez-Viso, P., Monedero, V., Zúñiga, M., Vélez, D., & Devesa, V. (2023) · Chemico-Biological Interactions · doi:10.1016/j.cbi.2023.110404 · Cited by 22
A patient-derived organoid model captures fetal-like plasticity in colorectal cancer
Xiong, L., Xu, Y., Gao, Z., Shi, J., Wang, Y., Wang, X., Huang, W., Li, M., Wang, L., Xu, J., et al. (2025) · Cell Research · doi:10.1038/s41422-025-01139-y · Cited by 23
Self-citationHuman gut homeostasis and regeneration: the role of the gut microbiota and its metabolites
Gómez, C. M. A., García-Gutiérrez, E., Escobar, J. S., & Cotter, P. D. (2022) · Critical Reviews in Microbiology · doi:10.1080/1040841x.2022.2142088 · Cited by 26
Kang, W., Jin, T., Zhāng, T., Ma, S., Yan, H., Liu, Z., Ji, Z., Cai, Y., Wang, S., Song, M., et al. (2021) · Nucleic Acids Research · doi:10.1093/nar/gkab870 · Cited by 20
Biomaterials for inflammatory bowel disease: treatment, diagnosis and organoids
Wang, J., Shi, Y., Mao, B., Zhang, B., Yang, J., Hu, Z., & Liao, W. (2024) · Applied Materials Today · doi:10.1016/j.apmt.2024.102078 · Cited by 22
Vitamin B12 ameliorates gut epithelial injury via modulating the HIF-1 pathway and gut microbiota
Feng, C., Yan, J., Luo, T., Zhang, H., Zhang, H., Yu, Y., Chen, Y., & Chen, H. (2024) · Cellular and Molecular Life Sciences · doi:10.1007/s00018-024-05435-5 · Cited by 17
Research progress and application of liver organoids for disease modeling and regenerative therapy
Hu, Y., Geng, Q., Wang, L., Wang, Y., Huang, C., Fan, Z., & Kong, D. (2024) · Journal of Molecular Medicine · doi:10.1007/s00109-024-02455-3 · Cited by 21
Guo, W., Zhang, X., Li, L., Shao, P., Liang, C., Zhang, H., Liu, K., Wang, S., Peng, Y., Luo, J., et al. (2024) · Nature Genetics · doi:10.1038/s41588-024-01979-1 · Cited by 19
Self-citationIntestinal transit-amplifying cells require METTL3 for growth factor signaling and cell survival
Danan, C. H., Naughton, K. E., Hayer, K. E., Vellappan, S., McMillan, E. A., Zhou, Y., Matsuda, R., Nettleford, S. K., Katada, K., Parham, L. R., et al. (2023) · JCI Insight · doi:10.1172/jci.insight.171657 · Cited by 16
Progress and perspective of organoid technology in cancer-related translational medicine
Lin, Y., Jiang, L., He, Q., Yuan, M., & Cao, J. (2022) · Biomedicine & Pharmacotherapy · doi:10.1016/j.biopha.2022.112869 · Cited by 18
Mechanisms and modeling of wound repair in the intestinal epithelium
Boger, K. D., Sheridan, A. E., Ziegler, A. L., & Blikslager, A. T. (2022) · Tissue Barriers · doi:10.1080/21688370.2022.2087454 · Cited by 15
Dietary nutrition regulates intestinal stem cell homeostasis
Ma, N., Chen, X., Liu, C., Sun, Y., Johnston, L. J., & Ma, X. (2022) · Critical Reviews in Food Science and Nutrition · doi:10.1080/10408398.2022.2087052 · Cited by 16
Hertwig's epithelial root sheath cells show potential for periodontal complex regeneration
Bi, F., Tang, H., Zhang, Z., Lyu, Y., Huo, F., Chen, G., & Guo, W. (2022) · Journal of Periodontology · doi:10.1002/jper.22-0072 · Cited by 15
Self-citationBrown, R. E., Jacobse, J., Anant, S. A., Blunt, K. M., Chen, B., Vega, P. N., Jones, C. T., Pilat, J. M., Revetta, F. L., Gorby, A. H., et al. (2022) · JCI Insight · doi:10.1172/jci.insight.153045 · Cited by 15
Intestinal organoid modeling: bridging the gap from experimental model to clinical translation
Liu, T., Li, X., Li, H., Qin, J., Xu, H., Wen, J., Ya-qin, H., & Cao, Z. (2024) · Frontiers in Oncology · doi:10.3389/fonc.2024.1334631 · Cited by 19
Inhibition of EZH2 Reduces Aging-Related Decline in Interstitial Cells of Cajal of the Mouse Stomach
Taheri, N., Choi, E. L., Nguyen, V. T. T., Zhang, Y., Huynh, N. M., Kellogg, T. A., van Wijnen, A. J., Ördög, T., & Hayashi, Y. (2024) · Cellular and Molecular Gastroenterology and Hepatology · doi:10.1016/j.jcmgh.2024.101376 · Cited by 14
Kumar, D., Gupta, S., Gupta, V., Tanwar, R., & Chandel, A. (2025) · Stem Cell Reviews and Reports · doi:10.1007/s12015-025-10893-w · Cited by 18
Dynamics and plasticity of stem cells in the regenerating human colonic epitheliumPreprint
Oost, K. C., Kahnwald, M., Barbiero, S., de Medeiros, G., Suppinger, S., Kalck, V., Meylan, L. C., Smallwood, S. A., Stadler, M. B., & Liberali, P. (2023) · bioRxiv (Cold Spring Harbor Laboratory) · doi:10.1101/2023.12.18.572103 · Cited by 14
Huang, W., Zhou, X., Fu, G., Ding, M., Wu, H., Zeng, M., Zhang, H., Xu, L., Gao, Y., Wang, H., et al. (2021) · Theranostics · doi:10.7150/thno.54457 · Cited by 13
Zhang, S., Sui, Y., Yan, S., Zhang, Y., Ding, C., Su, X., Xiong, J., & Wei, S. (2022) · Stem Cell Research & Therapy · doi:10.1186/s13287-022-03033-5 · Cited by 14
Establishment of Epithelial Inflammatory Injury Model Using Intestinal Organoid Cultures
Xing, C., Liang, G., Yu, X. H., Zhang, A., Luo, X., Liu, Y., Tang, Z., Wu, B., Song, Z., & Lan, D. (2023) · Stem Cells International · doi:10.1155/2023/3328655 · Cited by 12
Organoids in gastrointestinal diseases: from bench to clinic
Wang, Q., Guo, F., Zhang, Q., Hu, T., Jin, Y., Yang, Y., & Ma, Y. (2024) · MedComm · doi:10.1002/mco2.574 · Cited by 13
Modulation of β-Catenin promotes WNT expression in macrophages and mitigates intestinal injury
Chugh, R. M., Bhanja, P., Zitter, R., Gunewardena, S., Badkul, R., & Saha, S. (2025) · Cell Communication and Signaling · doi:10.1186/s12964-025-02065-7 · Cited by 15
Advances and applications of gut organoids: modeling intestinal diseases and therapeutic development
Xu, X., Zhang, Y., Huang, G., Perekatt, A. O., Wang, Y., & Chen, L. (2025) · Life Medicine · doi:10.1093/lifemedi/lnaf012 · Cited by 16
Roca, M. S., Lombardi, R., Testa, C., Iannelli, F., Grumetti, L., Moccia, T., Barile, V., Addi, L., Memoli, D., Leone, A., et al. (2025) · Cell Death and Disease · doi:10.1038/s41419-025-07902-8 · Cited by 11
Wang, X., Zhong, Y., Zheng, C., Huang, C., Yao, H., Guo, Z., Wu, Y., Wang, Z., Wu, Z., Ge, R., et al. (2024) · Food Research International · doi:10.1016/j.foodres.2024.114999 · Cited by 11
Urological cancer organoids, patients' avatars for precision medicine: past, present and future
Chen, H., Zhang, W., Maskey, N., Yang, F., Zheng, Z., Li, C., Wang, R., Wu, P., Mao, S., Zhang, J., et al. (2022) · Cell & Bioscience · doi:10.1186/s13578-022-00866-8 · Cited by 15
Self-citationColorectal Organoids: Models, Imaging, Omics, Therapy, Immunology, and Ethics
Taglieri, M., Gregorio, L. D., Matis, S., Uras, C. R. M., Ardy, M., Casati, S., Marchese, M., Poggi, A. D., Raffaghello, L., & Benelli, R. (2025) · Cells · doi:10.3390/cells14060457 · Cited by 12
van der Net, M. C., Vliem, M. J., Kemp, L. J. S., Gonzalez, C. P., Haddad, T. S., Strating, E., García, A. K., Houtekamer, R. M., Pannekoek, W., van den Anker, K. B., et al. (2025) · Cell Reports · doi:10.1016/j.celrep.2025.116308 · Cited by 16
Advanced Progression for the Heterogeneity and Homeostasis of Intestinal Stem Cells
Sun, M., Tan, Z., Lin, K., Li, X., Zhu, J., Zhan, L., & Zheng, H. (2023) · Stem Cell Reviews and Reports · doi:10.1007/s12015-023-10578-2 · Cited by 10
Taking a Step Back: Insights into the Mechanisms Regulating Gut Epithelial Dedifferentiation
Ouladan, S., & Gregorieff, A. (2021) · International Journal of Molecular Sciences · doi:10.3390/ijms22137043 · Cited by 9
Yu, W., Lin, Y., Lü, Y., Wang, Y., Zhang, D., Quan, H., Luo, Y., Zhang, Y., Jiang, Z., Chen, J., et al. (2024) · Food Frontiers · doi:10.1002/fft2.408 · Cited by 9
Martinet, M. G., Thomas, M., Bojunga, J., Pletz, M. W., Vehreschild, M. J. G. T., & Würstle, S. M. (2025) · Frontiers in Microbiology · doi:10.3389/fmicb.2025.1553979 · Cited by 9
In vivo detection of endogenous toxic phenolic compounds of intestine.
Jin, W.-Y., Guo, J.-X., Tang, R., Wang, J.-L., Zhao, H., Zhang, M., Teng, L.-Z., Sansonetti, P., & Gao, Y.-Z. (2024) · Journal of Hazardous Materials · doi:10.1016/j.jhazmat.2024.135526 · Cited by 7
Regulation of revival stem cell differentiation by CREPT/RPRD1B during intestinal regeneration
Lan, T., Li, M., Duan, X., Jia, H., Cao, Y., Wang, Y., Ren, F., Sheng, J., Xu, J., & Chang, Z. (2025) · Cell & Bioscience · doi:10.1186/s13578-025-01434-6 · Cited by 8
Self-citationOrgan‐Specific Dedifferentiation and Epigenetic Remodeling in In Vivo Reprogramming
Jo, B., Lee, S., Eom, H., Kim, J., & Cha, H. (2025) · Aging Cell · doi:10.1111/acel.70268 · Cited by 9
You, M., & Xu, M. (2024) · Nutrients · doi:10.3390/nu16060845 · Cited by 8
CL429 enhances the renewal of intestinal stem cells by upregulating TLR2-YAP1
Fang, L., Cheng, Y., Fang, D., Feng, Z., Wang, Y., Yu, Y., Zhao, J., Huang, D., Zhai, X., Liu, C., et al. (2024) · International Immunopharmacology · doi:10.1016/j.intimp.2024.112614 · Cited by 9
Intestinal organoid technology and applications in probiotics
Tan, H., Chen, X., Wang, C., Song, J., Xu, J., Zhang, Y., & Suo, H. (2023) · Critical Reviews in Food Science and Nutrition · doi:10.1080/10408398.2023.2288887 · Cited by 9
Self-citationAdvanced analysis and applications of single-cell transcriptome sequencing
Zhao, R.-H., Yicheng, B., Jingying, Z., Hu, M., Xinyan, Z., Yang, M., Tengfei, D., & Junjing, J. (2023) · All Life · doi:10.1080/26895293.2023.2199140 · Cited by 7
Ren, J., Liu, M., Rong, M., Zhang, X., Wang, G., Liu, Y., Li, H., & Duan, S. (2024) · Cell organoid (Print) · doi:10.26599/co.2024.9410009 · Cited by 8
Self-citationChen, L., Hao, Y., Zhai, T., Yang, F., Chen, S., Lin, X., & Li, J. (2025) · Cancer Informatics · doi:10.1177/11769351251323569 · Cited by 6
Xia, M., Wu, G., Wu, D., Hu, W., Deng, H., & Wang, S. (2026) · Acta Pharmaceutica Sinica B · doi:10.1016/j.apsb.2026.03.013 · Cited by 7
Self-citationOrganoids to Remodel SARS-CoV-2 Research: Updates, Limitations and Perspectives
An, Y., He, Y., Ge, N., Guo, J., Yang, F., & Sun, S. (2023) · Aging and Disease · doi:10.14336/ad.2023.0209 · Cited by 6
Zheng, S., Su, Y.-Y., Cai, F.-L., Xu, D.-F., & Xu, Y. (2025) · Frontiers in Microbiology · doi:10.3389/fmicb.2025.1669482 · Cited by 5
Xu, Z.-Y., Wang, M., Shi, J.-Y., Liu, Y., Yu, C., Zhang, X.-Y., Zhang, C.-W., He, Q.-F., Pan, C., Zhou, J., et al. (2025) · Materials Today Bio · doi:10.1016/j.mtbio.2025.101700 · Cited by 5
Self-citationNagao, I., Nakazawa, M., & Ambrosini, Y. M. (2024) · Journal of Visualized Experiments · doi:10.3791/65720 · Cited by 5
Zhang, Y., Yang, N., Li, Q., Tang, Y., Bai, B., & Liu, G. (2025) · Virology · doi:10.1016/j.virol.2025.110595 · Cited by 4
Single-cell genomic profiling to study regeneration
Maynard, A., Soretić, M., & Treutlein, B. (2024) · Current Opinion in Genetics & Development · doi:10.1016/j.gde.2024.102231 · Cited by 4
Wang, X., Jing, Y., Zheng, C., Huang, C., Yao, H., Guo, Z., Wu, Y., Wang, Z., Wu, Z., Ge, R., et al. (2024) · Food & Function · doi:10.1039/d4fo01723d · Cited by 4
Wang, J., Wang, T., Zhu, L., Wang, J., Gao, Q., Guo, L., Lv, G., Zhang, W., Zhang, Z., Yang, C., et al. (2025) · International Immunopharmacology · doi:10.1016/j.intimp.2025.114573 · Cited by 4
Construction of Lymphoma Organoids and Applications in Tumor Microenvironment Research
Zhu, M., Li, T., Han, S., Zhao, D., Chen, X., Wong, V., Wang, H., & Liu, Y. (2025) · European Journal Of Haematology · doi:10.1111/ejh.14448 · Cited by 4
Kim, H. M., Kim, Y., Kim, Y., Kim, Y. J., & Ko, K. S. (2023) · Preventive Nutrition and Food Science · doi:10.3746/pnf.2023.28.3.360 · Cited by 6
Applications and perspectives of tumor organoids in radiobiology (Review)
Jin, Y., Wang, K., Tang, Y., & Zheng, D. (2024) · Oncology Reports · doi:10.3892/or.2024.8759 · Cited by 5
Intestinal LKB1 Loss Drives a Premalignant Program Along the Serrated Cancer Pathway
Plugge, S., Ma, H., van der Vaart, J., Sprangers, J., Morsink, F. H. M., Xanthakis, D., Jamieson, C., Stroot, K. B. W., Keijzer, A., Margaritis, T., et al. (2025) · Gastroenterology · doi:10.1053/j.gastro.2025.07.041 · Cited by 6
A Three-Step Protocol to Differentiate iPSC into Colon Organoids
Aksoy, Z. B., & Akçalı, K. C. (2024) · Methods in molecular biology · doi:10.1007/978-1-0716-3995-5_6 · Cited by 3
Advances in the Study of Pluripotent Stem Cells in Livestock
Zhou, X., Gao, C., Zhao, W., Wei, X., Yu, D., Zou, H., & Du, W. (2025) · Cell Proliferation · doi:10.1111/cpr.70008 · Cited by 3
Wang, X., Zhang, W., Yang, S., Zheng, C., Wang, Z., Yang, G., Huang, C., Yao, H., Huang, K., Yan, Y., et al. (2026) · npj Science of Food · doi:10.1038/s41538-025-00672-9 · Cited by 3
Bai, J., Zhang, C., Li, G., Wang, Y., Dong, Y., Klar, R. M., & He, T. (2025) · Journal of Orthopaedic Translation · doi:10.1016/j.jot.2025.04.002 · Cited by 3
A Strainer-Based Platform for the Collection and Immunolabeling of Mouse Intestinal Organoids
Tan, J., Liu, Y., Li, W., Chen, G., Fang, Y., He, X., Fu, B., & Jing, Z. (2023) · International Journal of Molecular Sciences · doi:10.3390/ijms241713568 · Cited by 3
Unraveling Interactions Between Gut Epithelium and Microbiota Using Models of Intestinal Organoids
Huang, Y., He, K., & Chen, Y. (2024) · Infectious Microbes & Diseases · doi:10.1097/im9.0000000000000153 · Cited by 3
Zeng, X., Yin, L., Zhang, Y., Wang, Q., Li, J., Yin, Y., Wang, Q., Li, J., & Yang, H. (2025) · Biological Trace Element Research · doi:10.1007/s12011-025-04546-9 · Cited by 2
Hu, X., Xie, Y., Wang, J., Zhang, X., & Wu, R. (2026) · Animals · doi:10.3390/ani16030469 · Cited by 2
Self-citationHepatitis E virus replication is maintained in proliferative cells within the intestinal crypt
Prallet, S., Maier, N., Li, A., Afting, C., Huang, H.-E., Hu, J., Toprak, E., Keya, D. P., Colasanti, O., León-Janampa, N., et al. (2026) · Science Advances · doi:10.1126/sciadv.aeb2333 · Cited by 3
Cellular mechano-memory informs biomaterials and mechano-medicine
Qiao, P., Zhao, H., Ma, Z., Hasani, M., & Song, Y. (2026) · Cell Reports Physical Science · doi:10.1016/j.xcrp.2026.103308 · Cited by 2
Metadata
- Authors
- Qu, M., Xiong, L., Lyu, Y., Zhang, X., Shen, J., Guan, J., Chai, P., Lin, Z., Nie, B., Li, C., Xu, J., & Deng, H.
- Affiliations
- Peking University (CN)
- Capital Medical University (CN)
- Corresponding author
- Li, Cheng
- Xu, Jun
- Deng, Hongkui
- ORCID
- Venue
- Cell Research
- Published
- 2021-01-08
- Volume
- 31
- Issue
- 3
- Pages
- 259-271
- ISSN
- 1001-0602 (ISSN-L)
- 1748-7838
- PMC
- PMC8027647
- OpenAlex
- W3119003316
- Cited by
- 138
- References
- 51
- Citations by year
- 2026: 21 · 2025: 31 · 2024: 41 · 2023: 18 · 2022: 21 · 2021: 6
- FWCI
- 6.83
- Type
- journal article
- Language
- en
- Open access
- hybrid
- doi.org
- Locations
- Cell Research (publishedVersion, cc-by)
- PubMed Central (publishedVersion, cc-by)
- PubMed (publishedVersion)
- Greater South Information System
- Funders
- National Natural Science Foundation of China (31521004, 31871266, 2017YFA0103000, 31730059)
- Peking University
- Topics
- Life Sciences › Biochemistry, Genetics and Molecular Biology › Molecular Biology › Wnt/β-catenin signaling in development and cancer
- Health Sciences › Medicine › Gastroenterology › Digestive system and related health
- Health Sciences › Medicine › Oncology › Cancer Cells and Metastasis
- Keywords
- intestinal organoids, epithelial regeneration, intestinal injury, valproic acid, LDN-193189, RSPO1, Lgr5+ stem cells, epigenetic reprogramming, YAP signaling, tissue repair, single-cell RNA sequencing
- MeSH terms
- Animals, Benzamides, Biphenyl Compounds, Cells, Cultured, Colitis, Disease Models, Animal, Female, Intestinal Mucosa, Intestines, Male, Mice, Inbred C57BL, Mice, Transgenic, Morpholines, Organoids, Pyridones, Radiation Injuries, Regeneration, Stem Cells, Valproic Acid, Signal Transduction, Dextran Sulfate, Treatment Outcome, Culture Media, Conditioned, Tissue Culture Techniques, Mice
About these checks
Registry, retraction, Cites and statistics results are computed, not judged, with one exception: a printed reference that no index lists is read once by a model before it counts as a citation error. Claims are extracted by a model and kept only when their quote appears verbatim in the text; each cited source is then checked, with a model’s help, for whether it says what the claim relies on. Those verdicts can be wrong — read the claim’s quote and the cited source before relying on one.
Statistics and arithmetic are recomputed, not judged.
Confidence bands are shown only for fields calibrated on our annotated test set. None is calibrated yet, so no band is shown.
What counts as a claim ›How we measure confidence ›How we check this ›
Are you an author, or do you see a problem with this page? Request a review
