

The DOI matches its Crossref record; 33 of the 34 references it cites were found in a registry or an index.
Xrare: a machine learning method jointly modeling phenotypes and genetic evidence for rare disease diagnosis
Open accessAbstract
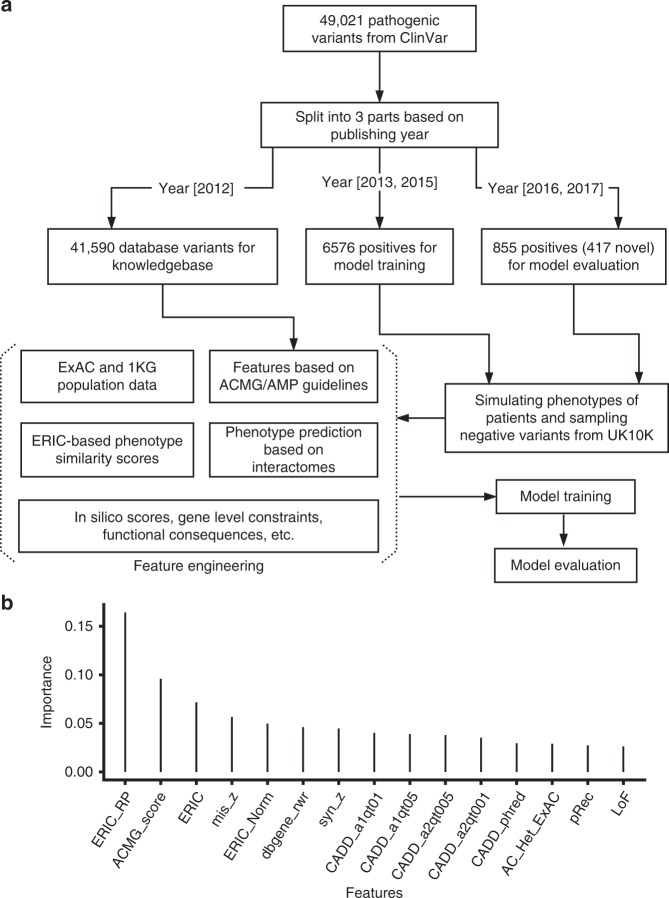
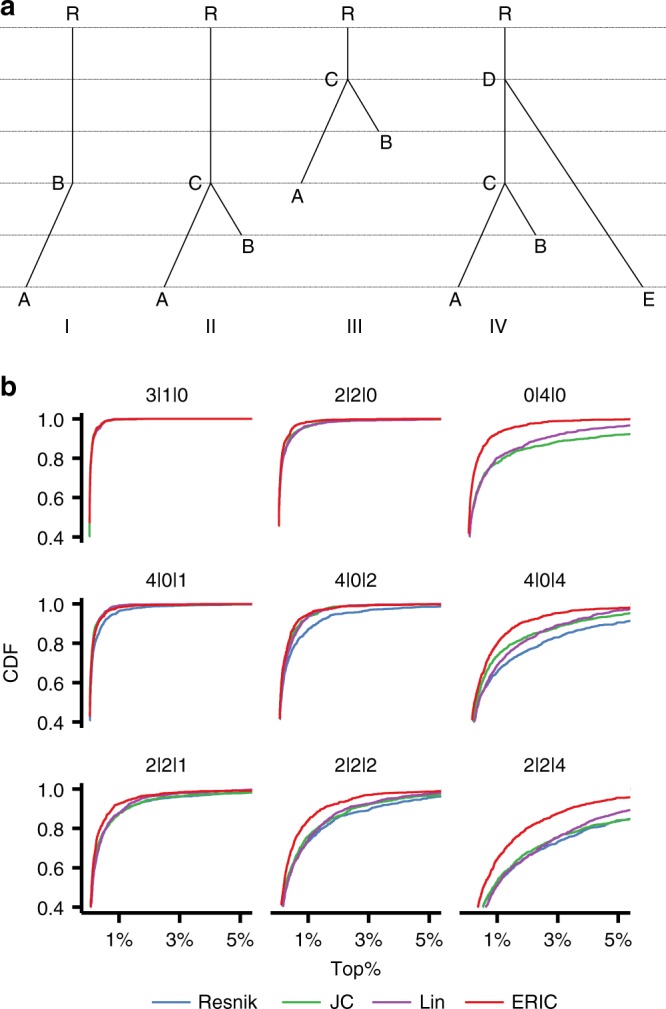
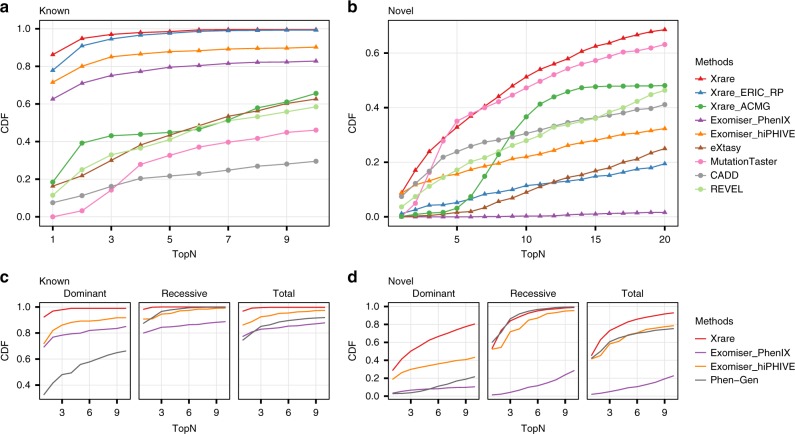
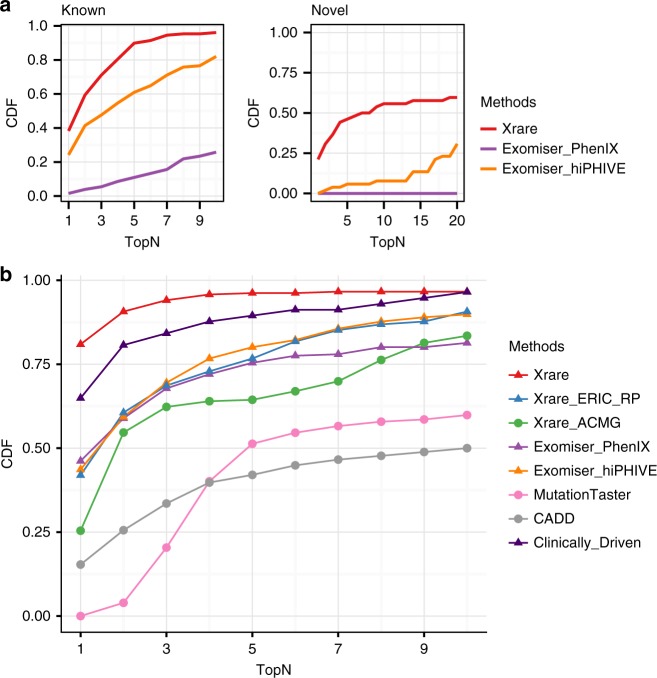
PURPOSE: Despite the successful progress next-generation sequencing technologies has achieved in diagnosing the genetic cause of rare Mendelian diseases, the current diagnostic rate is still far from satisfactory because of heterogeneity, imprecision, and noise in disease phenotype descriptions and insufficient utilization of expert knowledge in clinical genetics. To overcome these difficulties, we present a novel method called Xrare for the prioritization of causative gene variants in rare disease diagnosis. METHODS: We propose a new phenotype similarity scoring method called Emission-Reception Information Content (ERIC), which is highly tolerant of noise and imprecision in clinical phenotypes. We utilize medical genetic domain knowledge by designing genetic features implementing American College of Medical Genetics and Genomics (ACMG) guidelines. RESULTS: ERIC score ranked consistently higher for disease genes than other phenotypic similarity scores in the presence of imprecise and noisy phenotypes. Extensive simulations and real clinical data demonstrated that Xrare outperforms existing alternative methods by 10-40% at various genetic diagnosis scenarios. CONCLUSION: The Xrare model is learned from a large database of clinical variants, and derives its strength from the tight integration of medical genetics features and phenotypic features similarity scores. Xrare provides the clinical community with a robust and powerful tool for variant prioritization.
Overview
The claims and statistics of this paper haven’t been checked yet.
Run the check — free, no account needed. It reads the open-access text and checks the sources it cites.
Integrity signals
Registry
Cites
Statistics
Figures
Verification
Claims the paper makes
The claims and statistics of this paper haven’t been checked yet.
Run the check — free, no account needed. It reads the open-access text and checks the sources it cites.
Claims other papers make about this one
Each is checked against this paper’s own text: does it say what the citing paper says it does?
The source backs part of the claim, not all of it — or backs it for a different population, condition or comparison.
In the citing paper
“While deep learning approaches exist for image-based diagnosis10,11, there are limited approaches for phenotype-based diagnosis, and none automatically learn phenotypic and/or genotypic features over patient phenotype terms23–28,44.”
From Few shot learning for phenotype-driven diagnosis of patients with rare genetic diseases (2025) · cites this paper as [25]
Experimental — accuracy not yet measured
Self-check
Percentages, sums and reported differences re-computed from the paper’s own numbers.
The self-check needs the paper’s full text.
Citations
Cites
XGBoost: A Scalable Tree Boosting System
Chen, T., & Guestrin, C. (2016) · Proceedings of the 22nd ACM SIGKDD International Conference on Knowledge Discovery and Data Mining · doi:10.1145/2939672.2939785 · Cited by 54,569
Richards, S., Aziz, N., Bale, S., Bick, D., Das, S., Gastier-Foster, J., Grody, W. W., Hegde, M., Lyon, E., Spector, E., et al. (2015) · Genetics in Medicine · doi:10.1038/gim.2015.30 · Cited by 32,594
Greedy function approximation: A gradient boosting machine
Friedman, J. H. (2001) · The Annals of Statistics · doi:10.1214/aos/1013203451 · Cited by 30,731
Analysis of protein-coding genetic variation in 60,706 humans
Exome Aggregation Consortium, Lek, M., Karczewski, K. J., Minikel, E. V., Samocha, K. E., Banks, E., Fennell, T., O’Donnell-Luria, A. H., Ware, J. S., Hill, A. J., et al. (2016) · Nature · doi:10.1038/nature19057 · Cited by 9,587
Integrative analysis of 111 reference human epigenomes
Roadmap Epigenomics Consortium, Kundaje, A., Meuleman, W., Ernst, J., Bilenky, M., Yen, A., Heravi-Moussavi, A., Kheradpour, P., Zhang, Z., Wang, J., et al. (2015) · Nature · doi:10.1038/nature14248 · Cited by 6,368 · cited 1×
“…noncoding pathogenicity prediction scores (e.g., EIGEN, 31 LINSIGHT 32 ) and integrated regulatory information 33 of gene expression, chromatin accessibility from ENCODE and Roadmap Epige-nomics data 34 could allow better prioritization of all coding and regulatory variants in Mendelian diseases.”
BackgroundA general framework for estimating the relative pathogenicity of human genetic variants
Kircher, M., Witten, D. M., Jain, P., O'Roak, B. J., Cooper, G. M., & Shendure, J. (2014) · Nature Genetics · doi:10.1038/ng.2892 · Cited by 6,183
An Information-Theoretic Definition of Similarity
Lin, D. (1998) · Cited by 3,803
MutationTaster evaluates disease-causing potential of sequence alterations
Schwarz, J. M., Rödelsperger, C., Schuelke, M., & Seelow, D. (2010) · Nature Methods · doi:10.1038/nmeth0810-575 · Cited by 2,975
REVEL: An Ensemble Method for Predicting the Pathogenicity of Rare Missense Variants
Ioannidis, N. M., Rothstein, J. H., Pejaver, V., Middha, S., McDonnell, S. K., Baheti, S., Musolf, A., Li, Q., Holzinger, E., Karyadi, D., et al. (2016) · The American Journal of Human Genetics · doi:10.1016/j.ajhg.2016.08.016 · Cited by 2,908
Self-citationA new method to measure the semantic similarity of GO terms
Wang, J. Z., Du, Z., Payattakool, R., Yu, P. S., & Chen, C.-F. (2007) · Bioinformatics · doi:10.1093/bioinformatics/btm087 · Cited by 1,377
Cited by
Sorted by citations
Khan, A. A., Chaudhari, O., & Chandra, R. (2023) · Expert Systems with Applications · doi:10.1016/j.eswa.2023.122778 · Cited by 677
Role of artificial intelligence in patient safety outcomes: systematic literature review
Choudhury, A., & Asan, O. (2020) · JMIR Medical Informatics · doi:10.2196/18599 · Cited by 440
A guide for the diagnosis of rare and undiagnosed disease: beyond the exome
Marwaha, S., Knowles, J. W., & Ashley, E. A. (2022) · Genome Medicine · doi:10.1186/s13073-022-01026-w · Cited by 400
Artificial intelligence (AI) in rare diseases: is the future brighter?
Brasil, S., Pascoal, C., Francisco, R., dos Reis Ferreira, V., A. Videira, P., & Valadão, G. (2019) · Genes · doi:10.3390/genes10120978 · Cited by 160
Diagnosis support systems for rare diseases: a scoping review
Faviez, C., Chen, X., Garcelon, N., Neuraz, A., Knebelmann, B., Salomon, R., Lyonnet, S., Saunier, S., & Burgun, A. (2020) · Orphanet Journal of Rare Diseases · doi:10.1186/s13023-020-01374-z · Cited by 107
Electronic health records for the diagnosis of rare diseases
Garcelon, N., Burgun, A., Salomon, R., & Neuraz, A. (2020) · Kidney International · doi:10.1016/j.kint.2019.11.037 · Cited by 99
Choudhury, A., Renjilian, E., & Asan, O. (2020) · JAMIA Open · doi:10.1093/jamiaopen/ooaa034 · Cited by 94
Phen2Gene: rapid phenotype-driven gene prioritization for rare diseases
Zhao, M., Havrilla, J. M., Li, F., Chen, Y., Peng, J. J., Liu, C., Wu, C., Sarmady, M., Botas, P., Isla, J., et al. (2020) · NAR Genomics and Bioinformatics · doi:10.1093/nargab/lqaa032 · Cited by 91
Nicora, G., Zucca, S., Limongelli, I., Bellazzi, R., & Magni, P. (2022) · Scientific Reports · doi:10.1038/s41598-022-06547-3 · Cited by 59
Medical-informed machine learning: integrating prior knowledge into medical decision systems
Sirocchi, C., Bogliolo, A., & Montagna, S. (2024) · BMC Medical Informatics and Decision Making · doi:10.1186/s12911-024-02582-4 · Cited by 89
Schmidt, A., Danyel, M., Grundmann, K., Brunet, T., Klinkhammer, H., Hsieh, T., Engels, H., Peters, S., Knaus, A., Moosa, S., et al. (2024) · Nature Genetics · doi:10.1038/s41588-024-01836-1 · Cited by 75
Phenotype‐driven approaches to enhance variant prioritization and diagnosis of rare disease
Jacobsen, J. O. B., Kelly, C., Cipriani, V., Mungall, C., Reese, J., Daniš, D., Robinson, P. N., & Smedley, D. P. (2022) · Human Mutation · doi:10.1002/humu.24380 · Cited by 76
Cipriani, V., Pontikos, N., Arno, G., Sergouniotis, P. I., Lenassi, E., Thawong, P., Daniš, D., Michaelides, M., Webster, A. R., Moore, A. T., et al. (2020) · Genes · doi:10.3390/genes11040460 · Cited by 69
Hasani, N., Farhadi, F., Morris, M. A., Nikpanah, M., Rahmim, A., Xu, Y., Pariser, A., Collins, M. T., Summers, R. M., Jones, E. C., et al. (2021) · PET Clinics · doi:10.1016/j.cpet.2021.09.009 · Cited by 66
Few shot learning for phenotype-driven diagnosis of patients with rare genetic diseases
Alsentzer, E., Li, M. M., Kobren, S. N., Noori, A., Undiagnosed Diseases Network, Kohane, I. S., & Zitnik, M. (2025) · npj Digital Medicine · doi:10.1038/s41746-025-01749-1 · Cited by 54
Evaluation of phenotype-driven gene prioritization methods for Mendelian diseases
Yuan, X. F., Wang, J., Dai, B., Sun, Y., Zhang, K., Chen, F., Peng, Q., Huang, Y., Zhang, X., Chen, J., et al. (2022) · Briefings in Bioinformatics · doi:10.1093/bib/bbac019 · Cited by 54
AI-MARRVEL — A Knowledge-Driven AI System for Diagnosing Mendelian Disorders
Mao, D., Liu, C., Wang, L., AI-Ouran, R., Deisseroth, C., Pasupuleti, S., Kim, S. Y., Li, L., Rosenfeld, J. A., Meng, L., et al. (2024) · NEJM AI · doi:10.1056/aioa2300009 · Cited by 51
Wilhelm, C., Steckelberg, A., & Rebitschek, F. G. (2024) · The Lancet Regional Health - Europe · doi:10.1016/j.lanepe.2024.101145 · Cited by 59
Integrative omics approaches to advance rare disease diagnostics
Smirnov, D., Konstantinovskiy, N., & Prokisch, H. (2023) · Journal of Inherited Metabolic Disease · doi:10.1002/jimd.12663 · Cited by 47
RareBench: Can LLMs Serve as Rare Diseases Specialists?
Chen, X., Mao, X., Guo, Q., Wang, L., Zhang, S., & Chen, T. (2024) · Proceedings of the 30th ACM SIGKDD Conference on Knowledge Discovery and Data Mining · doi:10.1145/3637528.3671576 · Cited by 41
DeepHealth: Review and challenges of artificial intelligence in health informaticsPreprint
Kwak, G. H., & Hui, P. (2019) · arXiv (Cornell University) · doi:10.48550/arxiv.1909.00384 · Cited by 44
Integration of artificial intelligence and multi-omics in kidney diseases
Zhou, S., Zhong, X., & Duan, L. (2022) · Fundamental Research · doi:10.1016/j.fmre.2022.01.037 · Cited by 37
Phenotype-aware prioritisation of rare Mendelian disease variants
Kelly, C., Szabó, A., Pontikos, N., Arno, G., Robinson, P. N., Jacobsen, J. O. B., Smedley, D. P., & Cipriani, V. (2022) · Trends in Genetics · doi:10.1016/j.tig.2022.07.002 · Cited by 37
Mao, X., Huang, Y., Jin, Y., Wang, L., Chen, X., Liu, H., Yang, X., Xu, H., Luan, X., Xiao, Y., et al. (2025) · npj Digital Medicine · doi:10.1038/s41746-025-01452-1 · Cited by 35
Artificial intelligence and database for NGS-based diagnosis in rare disease
Choon, Y. W., Choon, Y. F., Nasarudin, N. A., Jasmi, F. A., Remli, M. A., Alkayali, M. H., & Mohamad, M. S. (2024) · Frontiers in Genetics · doi:10.3389/fgene.2023.1258083 · Cited by 33
Rare disease genomics and precision medicine
Hong, J., Lee, D., Hwang, A., Kim, T., Ryu, H., & Choi, J. (2024) · Genomics & Informatics · doi:10.1186/s44342-024-00032-1 · Cited by 31
Daniali, M., Galer, P. D., Lewis‐Smith, D., Parthasarathy, S., Kim, E., Salvucci, D. D., Miller, J. M., Haag, S., & Helbig, I. (2022) · Artificial Intelligence in Medicine · doi:10.1016/j.artmed.2023.102523 · Cited by 24
Resources and tools for rare disease variant interpretation
Licata, L., Via, A., Turina, P., Babbi, G., Benevenuta, S., Carta, C., Casadio, R., Cicconardi, A., Facchiano, A. M., Fariselli, P., et al. (2023) · Frontiers in Molecular Biosciences · doi:10.3389/fmolb.2023.1169109 · Cited by 23
Tosco‐Herrera, E., Muñoz‐Barrera, A., Jáspez, D., Rubio‐Rodríguez, L. A., Mendoza‐Alvarez, A., Rodriguez‐Perez, H., Jou, J., Iñigo‐Campos, A., Corrales, A., Ciuffreda, L., et al. (2022) · Human Mutation · doi:10.1002/humu.24459 · Cited by 20
Zhai, W., Huang, X., Shen, N., & Zhu, S. (2023) · Briefings in Bioinformatics · doi:10.1093/bib/bbad172 · Cited by 21
Chen, K., Xu, H., Lei, Y., Lió, P., Yuan, L., Guo, H., & Moni, M. A. (2021) · Briefings in Bioinformatics · doi:10.1093/bib/bbab100 · Cited by 17
Bone metabolic biomarker-based diagnosis of type 2 diabetes osteoporosis by support vector machine
Wang, C., Zhang, T., Wang, P., Liu, X., Zheng, L., Miao, L., Zhou, D., Zhang, Y., Hu, Y., Yin, H., et al. (2021) · Annals of Translational Medicine · doi:10.21037/atm-20-3388 · Cited by 17
Current perspectives and challenges of using artificial intelligence in immunodeficiencies
Riviere, J. G., Cantenys-Saba, R., Carot-Sans, G., Piera-Jiménez, J., Butte, M. J., Soler‐Palacín, P., & Peng, X. P. (2025) · Journal of Allergy and Clinical Immunology · doi:10.1016/j.jaci.2025.06.015 · Cited by 17
Ideas in Genomic Selection with the Potential to Transform Plant Molecular Breeding
McGowan, M., Wang, J., Dong, H., Liu, X., Jia, Y., Wang, X., Iwata, H., Li, Y., Lipka, A. E., & Zhang, Z. (2021) · Plant breeding reviews · doi:10.1002/9781119828235.ch7 · Cited by 16
Ideas in Genomic Selection with the Potential to Transform Plant Molecular Breeding: A ReviewPreprint
McGowan, M., Wang, J., Dong, H., Liu, X., Jia, Y., Wang, X., Iwata, H., Li, Y., Lipka, A. E., & Zhang, Z. (2020) · Preprints.org · doi:10.20944/preprints202010.0460.v2 · Cited by 16
Karalidou, V., Kalfakakou, D., Παπαθανασίου, Α., Fostira, F., & Matsopoulos, G. K. (2022) · Biomolecules · doi:10.3390/biom12111552 · Cited by 15
PhenoApt leverages clinical expertise to prioritize candidate genes via machine learning
Chen, Z., Zheng, Y., Yang, Y., Huang, Y., Zhao, S., Zhao, H., Yu, C., Dong, X., Zhang, Y., Wang, L., et al. (2022) · The American Journal of Human Genetics · doi:10.1016/j.ajhg.2021.12.008 · Cited by 16
PheNominal: an EHR-integrated web application for structured deep phenotyping at the point of care
Havrilla, J. M., Singaravelu, A., Driscoll, D. M., Minkovsky, L., Helbig, I., Medne, L., Wang, K., Krantz, I. D., & Desai, B. R. (2022) · BMC Medical Informatics and Decision Making · doi:10.1186/s12911-022-01927-1 · Cited by 15
Yang, J., Shu, L., Han, M., Pan, J., Chen, L., Yuan, T., Tan, L., Shu, Q., Duan, H., & Li, H. (2024) · Computers in Biology and Medicine · doi:10.1016/j.compbiomed.2024.107924 · Cited by 13
Liang, L., Chen, Y., Wang, T., Jiang, D. L., Jin, J., Pang, Y., Qin, N., Liu, Q., Jiang, X., Dai, W., et al. (2024) · medRxiv · doi:10.1101/2024.07.18.24310666 · Cited by 13
Lagorce, D., Lebreton, E., Matalonga, L., Hongnat, O., Chahdil, M., Piscia, D., Paramonov, I., Ellwanger, K., Köhler, S., Robinson, P. N., et al. (2023) · European Journal of Human Genetics · doi:10.1038/s41431-023-01486-7 · Cited by 13
Promise and Peril of a Genotype‐First Approach to Mendelian Cardiovascular Disease
Asatryan, B., Murray, B. A., Tadros, R., Rieder, M., Shah, R. A., Dabbagh, G. S., Landstrom, A. P., Dobner, S., Munroe, P. B., Haggerty, C. M., et al. (2024) · Journal of the American Heart Association · doi:10.1161/jaha.123.033557 · Cited by 12
Asatryan, B., Bleijendaal, H., & Wilde, A. A. M. (2023) · Heart Rhythm · doi:10.1016/j.hrthm.2023.07.001 · Cited by 16
Improving prenatal diagnosis through standards and aggregation
Duyzend, M., Cacheiro, P., Jacobsen, J. O. B., Giordano, J. L., Brand, H., Wapner, R. J., Talkowski, M. E., Robinson, P. N., & Smedley, D. P. (2024) · Prenatal Diagnosis · doi:10.1002/pd.6522 · Cited by 11
Simulation of undiagnosed patients with novel genetic conditions
Alsentzer, E., Finlayson, S. G., Li, M. M., Undiagnosed Diseases Network, Kobren, S. N., & Kohane, I. S. (2023) · Nature Communications · doi:10.1038/s41467-023-41980-6 · Cited by 10
Methods to Improve Molecular Diagnosis in Genomic Cold Cases in Pediatric Neurology
Kadlubowska, M. K., & Schrauwen, I. (2022) · Genes · doi:10.3390/genes13020333 · Cited by 12
Unraveling Complexities in Genetically Elusive Long QT Syndrome
Asatryan, B., Murray, B. A., Gasperetti, A., McClellan, R., & Barth, A. S. (2024) · Circulation Arrhythmia and Electrophysiology · doi:10.1161/circep.123.012356 · Cited by 10
A comprehensive review on the current status of CRISPR based clinical trials for rare diseases
Badwal, A. K., & Singh, S. (2024) · International Journal of Biological Macromolecules · doi:10.1016/j.ijbiomac.2024.134097 · Cited by 10
Artificial Intelligence in the Genetic Diagnosis of Rare Disease
James, K. N., Phadke, S. S., Wong, T. C., & Chowdhury, S. (2023) · Clinics in Laboratory Medicine · doi:10.1016/j.cll.2022.09.023 · Cited by 9
Review of Time Domain Electronic Medical Record Taxonomies in the Application of Machine Learning
Ali, H., Niazi, I. K., Russell, B. K., Crofts, C. A. P., Madanian, S., & White, D. E. (2023) · Electronics · doi:10.3390/electronics12030554 · Cited by 8
Applying Artificial Intelligence for Phenotyping of Inherited Arrhythmia Syndromes
Sigfstead, S., Jiang, R., Avram, R., Davies, B., Krahn, A. D., & Cheung, C. C. (2024) · Canadian Journal of Cardiology · doi:10.1016/j.cjca.2024.04.014 · Cited by 9
Huang, Y., Hsu, C., Chune, Y.-C., Liao, I.-C., Wang, H., Lin, Y., Hwu, W., Lee, N., & Lai, F. (2022) · JMIR Bioinformatics and Biotechnology · doi:10.2196/37701 · Cited by 7
Shen, L., Falk, M. J., & Gai, X. (2024) · Current Protocols · doi:10.1002/cpz1.955 · Cited by 7
The Role of Artificial Intelligence in Identifying NF1 Gene Variants and Improving Diagnosis
Grech, V.-S., Lotsaris, K., Touma, T. E., Kefala, V., & Rallis, E. A. (2025) · Genes · doi:10.3390/genes16050560 · Cited by 7
Andreu, J. L. M., Bernal, L., Skármeta, A., Ryten, M., Álvarez, S., Cisterna‐García, A., & Botía, J. A. (2025) · Artificial Intelligence in Medicine · doi:10.1016/j.artmed.2025.103177 · Cited by 7
A flexible computational pipeline for research analyses of unsolved clinical exome cases
Lassmann, T., Francis, R. W., Weeks, A. L., Tang, D. T. P., Jamieson, S. E., Broley, S., Dawkins, H. J. S., Dreyer, L., Goldblatt, J., Groza, T., et al. (2020) · npj Genomic Medicine · doi:10.1038/s41525-020-00161-w · Cited by 8
Using machine learning to minimize delays caused by prior authorization: A brief report
Choudhury, A., & Perumalla, S. (2021) · Cogent Engineering · doi:10.1080/23311916.2021.1944961 · Cited by 7
Salavati, A., van der Wilt, C. N., Calore, M., van Es, R., Rampazzo, A., van der Harst, P., van Steenbeek, F. G., van Tintelen, J. P., Harakaľová, M., & Riele, A. S. J. M. T. (2024) · Current Heart Failure Reports · doi:10.1007/s11897-024-00688-4 · Cited by 6
Fellner, A., Ruhrman‐Shahar, N., Orenstein, N., Lidzbarsky, G. A., Shuldiner, A. R., Gonzaga-Jauregui, C. G., Brown-Shalev, H., Hagari-Bechar, O., Bazak, L., & Basel‐Salmon, L. (2021) · Genetics in Medicine · doi:10.1038/s41436-020-01085-7 · Cited by 6
Wilhelm, C., Steckelberg, A., & Rebitschek, F. G. (2024) · Systematic Reviews · doi:10.1186/s13643-024-02646-6 · Cited by 5
Groza, T., Marcello, A., Carlisle, T., Lim, W. K., Haendel, M. A., Karnani, N., Robinson, P. N., Graeßner, H., Chong, J. X., Baynam, G. S., et al. (2025) · Human Genetics and Genomics Advances · doi:10.1016/j.xhgg.2025.100558 · Cited by 5
Ding, S., Zhang, S., Hu, X., & Zou, N. (2024) · Journal of Biomedical Informatics · doi:10.1016/j.jbi.2024.104671 · Cited by 7
Rare disease data stewardship in Canada
Bernier, A. (2020) · FACETS · doi:10.1139/facets-2020-0050 · Cited by 5
Gout Staging Diagnosis Method Based on Deep Reinforcement Learning
Ma, C., Pan, C., Ye, Z., Ren, H., Huang, H., & Qu, J. (2023) · Processes · doi:10.3390/pr11082450 · Cited by 5
Refined preferences of prioritizers improve intelligent diagnosis for Mendelian diseases
Yuan, X. F., Su, J., Wang, J., Dai, B., Sun, Y., Zhang, K., Li, Y., Chuan, J., Tang, C., Yu, Y., et al. (2024) · Scientific Reports · doi:10.1038/s41598-024-53461-x · Cited by 5
VUS next in rare diseases? Deciphering genetic determinants of biomolecular condensation
Heredia-Torrejón, M., Montañez, R., González‐Meneses, A., Carcavilla, A., Medina, M. Á., & Lechuga-Sancho, A. M. (2024) · Orphanet Journal of Rare Diseases · doi:10.1186/s13023-024-03307-6 · Cited by 4
Improving variant prioritization in exome analysis by entropy‐weighted ensemble of multiple tools
Fan, Y., Zhou, Y., Liu, H., Luo, X., Xu, T., Sun, Y., Yang, T., Chen, L., Gu, X., & Yu, Y. (2022) · Clinical Genetics · doi:10.1111/cge.14257 · Cited by 4
Zhu, Q., Nguyễn, Ð.-T., Alyea, G., Hanson, K. J., Sid, E., & Pariser, A. (2020) · JMIR Medical Informatics · doi:10.2196/18395 · Cited by 4
diseaseGPS: auxiliary diagnostic system for genetic disorders based on genotype and phenotype
Huang, D., Jiang, J., Zhao, T., Wu, S., Li, P., Lyu, Y., Feng, J., Wei, M., Zhu, Z., Gu, J., et al. (2023) · Bioinformatics · doi:10.1093/bioinformatics/btad517 · Cited by 3
Sonar, A., & Weber, K. (2022) · Franz Steiner Verlag eBooks · doi:10.25162/9783515129770 · Cited by 5
Deep Agentic Variant Prioritisation for Expert Level Genetic DiagnosisPreprint
Kara, M., Gungor, A. F., Kuday, S. E., Ozcelik, O., Ceylaner, S., Devrez, F. D., & Özden, F. (2026) · medRxiv · doi:10.64898/2026.02.17.26346421 · Cited by 3
Tang, Z. (2024) · American Journal of Translational Research · doi:10.62347/ieqe3348 · Cited by 2
Ustach, V. D., Sacoto, M. J. G., McGee, S., Gainullin, V. G., Arvai, K. J., Begtrup, A. H., Facio, F. M., Greenberg, M., Guðbjartsson, H., McWalter, K. M., et al. (2026) · Human Genetics · doi:10.1007/s00439-025-02797-z · Cited by 3
Aitken, S., Firth, H. V., Wright, C. F., Hurles, M. E., FitzPatrick, D. R., & Semple, C. A. M. (2022) · Human Genetics and Genomics Advances · doi:10.1016/j.xhgg.2022.100162 · Cited by 2
Dong, X., Wu, B., Wang, H., Yang, L., Chen, X. '., Ni, Q., Wang, Y., Liu, B., Lu, Y., & Zhou, W. (2021) · medRxiv · doi:10.1101/2021.08.26.21261185 · Cited by 2
Multi-class machine learning-based classification of SCID-related genetic variants
Şahin, A., Sönmez, G., Karaselek, M. A., & Reisli, İ. (2025) · Immunologic Research · doi:10.1007/s12026-025-09685-8 · Cited by 1
Paoli, F. D., Nicora, G., Galanti, K., Gonzales, C. S., Mangili, F., Smedley, D. P., Appuswamy, R., Kawasawa, Y. I., Somers, V. K., Limongelli, I., et al. (2026) · Circulation Genomic and Precision Medicine · doi:10.1161/circgen.125.005447 · Cited by 1
Artificial Intelligence (AI): A Metamorphic Transformation in Healthcare Services
Patnaik, B. C. M., Satpathy, I., & Baral, S. K. (2024) · BENTHAM SCIENCE PUBLISHERS eBooks · doi:10.2174/9789815256659124060018 · Cited by 1
Leveraging clinical intuition to improve accuracy of phenotype-driven prioritization
Beckwith, M. A., Daniš, D., Bridges, Y., Jacobsen, J. O. B., Smedley, D. P., & Robinson, P. N. (2024) · Genetics in Medicine · doi:10.1016/j.gim.2024.101292 · Cited by 1
Nadir Hastalıklarda Tedaviye Erişim: Mevcut Durum, Engeller ve Çözüm Önerileri
Yıldırım, M., & Keskin, H. (2025) · Sağlık Bilimlerinde Değer · doi:10.33631/sabd.1507046 · Cited by 1
RankVar: machine learning-based variant ranking and reinterpretation for rare genetic diseases
Zhang, Y., Ahsan, M. U., Wang, P., Lin, X., Campbell, I. M., Liu, C., Chung, W. K., Weng, C., & Wang, K. (2026) · Genome Medicine · doi:10.1186/s13073-026-01701-2 · Cited by 1
Boceck, D., Laugwitz, L., Sturm, M., Bezdan, D., Gschwind, A., Haack, T. B., & Ossowski, S. (2026) · npj Genomic Medicine · doi:10.1038/s41525-026-00611-x · Cited by 3
Artificial Intelligence in the Genetic Diagnosis of Rare Disease
James, K. N., Phadke, S. S., Wong, T. C., & Chowdhury, S. (2020) · Advances in Molecular Pathology · doi:10.1016/j.yamp.2020.07.013
Wang, Z., Liu, L., Chen, C., Liu, X., Tang, F., Zhang, Y., Chen, Y., Wang, Y., Sun, J., & Peng, Z. (2021) · bioRxiv (Cold Spring Harbor Laboratory) · doi:10.1101/2021.10.13.464308
Wang, C., Zhang, T., Liu, X., Miao, L., Zhou, D., Wang, P., Zhang, Y., Jiang, Q. Y., Hu, Y., Yin, H., et al. (2020) · doi:10.21203/rs.3.rs-17981/v1
Genomics technologies and bioinformatics in allergy and immunology
Ganakammal, S. R., Huang, K. Q., Walkiewicz, M. A., & Xirasagar, S. (2022) · Elsevier eBooks · doi:10.1016/b978-0-323-95061-9.00008-4
Xu, Y., Xu, X., & Xiao, R. (2023) · Research Square · doi:10.21203/rs.3.rs-2974322/v1
Scoping Review: Application of Machine Learning Techniques in Genetic Diagnosis
Faria, B., Ribeiro, M. V., Simões, R., Valente, S., & Rocha, N. P. (2024) · Lecture notes in networks and systems · doi:10.1007/978-3-031-45648-0_41
Computational genomics and bioinformatics
Vestito, L., Cipriani, V., & Smedley, D. P. (2024) · Elsevier eBooks · doi:10.1016/b978-0-323-91799-5.00001-2
Zhang, J., Liu, D., Chen, M., Fang, Y., Dai, K., Zhu, X., Xu, Q., Hou, M., Wang, L., Wang, J., et al. (2025) · Molecular Genetics & Genomic Medicine · doi:10.1002/mgg3.70139
Labory, J., Boulaimen, Y., Singh, J., Ait-El-Mkadem, S., Paquis‐Flucklinger, V., Bannwarth, S., & Bottini, S. (2025) · Briefings in Bioinformatics · doi:10.1093/bib/bbaf612
Large Language Models Enhance Molecular Diagnoses of Mendelian Disorders via A Novel LogicPreprint
Chen, Z., Cai, J., Yang, Y., Zhao, S., Li, G. Z., Xu, K., Li, Q., Hospedales, T. M., Zhao, L., Zhang, Z., et al. (2025) · Research Square · doi:10.21203/rs.3.rs-8387316/v1
Self-citationGarcía-Criado, F., Pérez-García, J., Rojano, E., Ranea, J. A. G., & Seoane, P. (2026) · Lecture notes in computer science · doi:10.1007/978-3-032-10661-2_23
GEN-KnowRD: Reframing AI for Rare Disease RecognitionPreprint
Yan, C., Su, W.-C., Xin, Y., Grabowska, M. E., Kerchberger, V. E., Borza, V. A., Wang, J., Wang, L., Li, R., Lynn, J., et al. (2026) · medRxiv · doi:10.64898/2026.03.02.26347469
Meng, M., Liu, L., Du, Q., Zhou, X., Tian, Y., Sun, K., Li, N., Zhang, P., Lian, X., Fan, N., et al. (2026) · medRxiv · doi:10.64898/2026.04.02.26349929 · Cited by 1
Bonetto, M. C. P., Silva, E. C. S., José, J., Rosa, R. R., & Patané, J. S. L. (2025) · Simpósio Brasileiro de Bioinformática (BSB) · doi:10.5753/bsb.2025.14580
Pérez-García, J., García-Criado, F., Pazos, F., Chagoyen, M., Rojano, E., Seoane, P., & Ranea, J. A. G. (2026) · iScience · doi:10.1016/j.isci.2026.117183
Chang, J.-Y., Li, K.-T., Tsai, Y.-S., Kubal, M., Hamby, A. M., Thomson, N., Sheridan, J., Barfield, S., Rutz, R., Ong, F. S.-C., et al. (2026) · Journal of Advances in Artificial Intelligence and Machine Learning · doi:10.33425/3069-8316.1008
Metadata
- Authors
- Li, Q., Zhao, K., Bustamante, C. D., Ma, X., & Wong, W. H.
- Affiliations
- Stanford University (US)
- Corresponding author
- Ma, Xin
- Wong, Wing H.
- Venue
- Genetics in Medicine
- Publisher
- Elsevier BV
- Published
- 2019-09
- Volume
- 21
- Issue
- 9
- Pages
- 2126-2134
- ISSN
- 1098-3600 (ISSN-L)
- PMC
- PMC6752318
- OpenAlex
- W2911737122
- Cited by
- 106
- References
- 34
- Citations by year
- 2026: 10 · 2025: 13 · 2024: 27 · 2023: 12 · 2022: 21 · 2021: 8 · 2020: 13 · 2019: 2
- FWCI
- 6.63
- Type
- journal article
- Language
- en
- Open access
- hybrid
- doi.org
- Licence
- Locations
- Genetics in Medicine (publishedVersion, cc-by-nc-nd)
- PubMed Central (publishedVersion, cc-by-nc-nd)
- PubMed (publishedVersion)
- Funders
- National Institutes of Health (P50-HG007735)
- National Human Genome Research Institute (P50HG007735, R01HG007834)
- National Cancer Institute (P20CA096470)
- Topics
- Life Sciences › Biochemistry, Genetics and Molecular Biology › Genetics › Genomics and Rare Diseases
- Life Sciences › Biochemistry, Genetics and Molecular Biology › Genetics › Genetic Associations and Epidemiology
- Health Sciences › Medicine › Health Informatics › Artificial Intelligence in Healthcare and Education
- Keywords
- rare disease diagnosis, monogenic disorders, variant prioritization, ACMG guidelines, genetic characteristics, medical genetics
- MeSH terms
- Machine Learning, Genetic Testing, Genotype, Humans, Mutation, Phenotype, Software, Genetic Variation, Computational Biology, Genomics, Rare Diseases, High-Throughput Nucleotide Sequencing, Exome
About these checks
Registry, retraction, Cites and statistics results are computed, not judged, with one exception: a printed reference that no index lists is read once by a model before it counts as a citation error. Claims are extracted by a model and kept only when their quote appears verbatim in the text; each cited source is then checked, with a model’s help, for whether it says what the claim relies on. Those verdicts can be wrong — read the claim’s quote and the cited source before relying on one.
Statistics and arithmetic are recomputed, not judged.
Confidence bands are shown only for fields calibrated on our annotated test set. None is calibrated yet, so no band is shown.
What counts as a claim ›How we measure confidence ›How we check this ›
Are you an author, or do you see a problem with this page? Request a review
