

The DOI matches its Crossref record.
Coriander Genomics Database: a genomic, transcriptomic, and metabolic database for coriander
Abstract
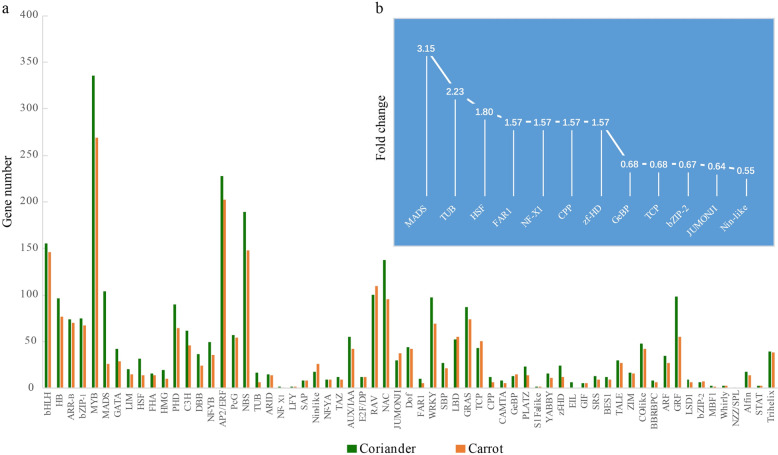
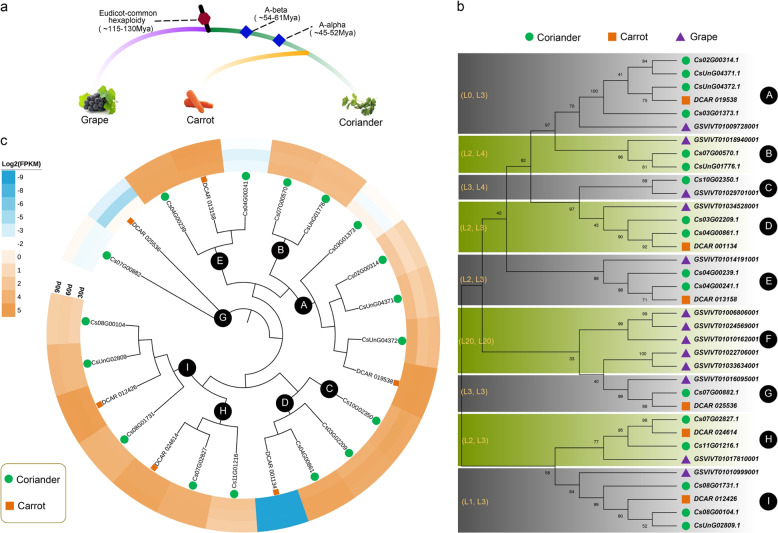
Coriander (Coriandrum sativum L.), also known as cilantro, is a globally important vegetable and spice crop. Its genome and that of carrot are models for studying the evolution of the Apiaceae family. Here, we developed the Coriander Genomics Database (CGDB, http://cgdb.bio2db.com/) to collect, store, and integrate the genomic, transcriptomic, metabolic, functional annotation, and repeat sequence data of coriander and carrot to serve as a central online platform for Apiaceae and other related plants. Using these data sets in the CGDB, we intriguingly found that seven transcription factor (TF) families showed significantly greater numbers of members in the coriander genome than in the carrot genome. The highest ratio of the numbers of MADS TFs between coriander and carrot reached 3.15, followed by those for tubby protein (TUB) and heat shock factors. As a demonstration of CGDB applications, we identified 17 TUB family genes and conducted systematic comparative and evolutionary analyses. RNA-seq data deposited in the CGDB also suggest dose compensation effects of gene expression in coriander. CGDB allows bulk downloading, significance searches, genome browser analyses, and BLAST searches for comparisons between coriander and other plants regarding genomics, gene families, gene collinearity, gene expression, and the metabolome. A detailed user manual and contact information are also available to provide support to the scientific research community and address scientific questions. CGDB will be continuously updated, and new data will be integrated for comparative and functional genomic analysis in Apiaceae and other related plants.
Overview
The claims and statistics of this paper haven’t been checked yet.
Run the check — free, no account needed. It reads the open-access text and checks the sources it cites.
Integrity signals
Registry
Cites
Statistics
Figures
Verification
Claims the paper makes
The claims and statistics of this paper haven’t been checked yet.
Run the check — free, no account needed. It reads the open-access text and checks the sources it cites.
Claims other papers make about this one
Each is checked against this paper’s own text: does it say what the citing paper says it does?
In the citing paper
“To support broader research access, the Coriander Genomics Database was developed as an integrated platform combining genomic, transcriptomic, and metabolic information (Song et al. 2020).”
From Unlocking the Apiaceae: comprehensive advances in agronomy, biotechnology, phytochemistry, and health applications of major seed spices (2025) · cites this paper as Song et al. 2020
Self-check
Percentages, sums and reported differences re-computed from the paper’s own numbers.
The self-check needs the paper’s full text.
Citations
Cites
No references could be resolved yet.
Research works printed but not linked: 18
- Prachayasittikul, V., Prachayasittikul, S., Ruchirawat, S. & Prachayasittikul, V. Coriander (Coriandrum sativum): a promising functional food toward the well-being. Food Res. Int. 105, 305–323 (2018). · DOI
- Eriksson, N. et al. A genetic variant near olfactory receptor genes influences cilantro preference. Flavour 1, 22 (2012). · DOI
- Chen, F. et al. Genome sequences of horticultural plants: past, present, and future. Hortic. Res. 6, 112 (2019). · DOI
- Chen, F. et al. The sequenced angiosperm genomes and genome databases. Front. Plant Sci. 9, 418 (2018).
- Zhu, G. et al. PPIM: a protein-protein interaction database for maize. Plant Physiol. 170, 618–626 (2016). · DOI
- Yu, J. et al. CottonGen: a genomics, genetics and breeding database for cotton research. Nucleic Acids Res. 42, D1229–D1236 (2014). · DOI
- Xu, Z. S., Tan, H. W., Wang, F., Hou, X. L. & Xiong, A. S. CarrotDB: a genomic and transcriptomic database for carrot. Database 2014, 1–8 (2014). · DOI
- Cheng, F. et al. BRAD, the genetics and genomics database for Brassica plants. BMC Plant Biol. 11, 136 (2011). · DOI
- Xu, H. et al. PGD: pineapple genomics database. Hortic. Res. 5, 66 (2018). · DOI
- Hirakawa, H. et al. Dissection of the octoploid strawberry genome by deep sequencing of the genomes of Fragaria species. DNA Res. 21, 169–181 (2014). · DOI
- Iorizzo, M. et al. A high-quality carrot genome assembly provides new insights into carotenoid accumulation and asterid genome evolution. Nat. Genet. 48, 657–666 (2016). · DOI
- Jaillon, O. et al. The grapevine genome sequence suggests ancestral hexaploidization in major angiosperm phyla. Nature 449, 463–467 (2007). · DOI
- Guindon, S. et al. New algorithms and methods to estimate maximum-likelihood phylogenies: assessing the performance of PhyML 3.0. Syst. Biol. 59, 307–321 (2010). · DOI · Paper page
- Wang, Y. et al. MCScanX: a toolkit for detection and evolutionary analysis of gene synteny and collinearity. Nucleic Acids Res. 40, e49 (2012). · DOI · Paper page
- Buels, R. et al. JBrowse: a dynamic web platform for genome visualization and analysis. Genome Biol. 17, 66 (2016). · DOI
- Mun, J. H. et al. Genome-wide comparative analysis of the Brassica rapa gene space reveals genome shrinkage and differential loss of duplicated genes after whole genome triplication. Genome Biol. 10, R111 (2009). · DOI
- De Bodt, S., Maere, S. & Van de Peer, Y. Genome duplication and the origin of angiosperms. Trends Ecol. Evol. 20, 591–597 (2005). · DOI
- Camacho, C. et al. BLAST+: architecture and applications. BMC Bioinforma. 10, 421 (2009). · DOI · Paper page
Cited by
Advances in “Omics” Approaches for improving toxic metals/metalloids tolerance in plants
Raza, A., Tabassum, J., Zahid, Z., Charagh, S., Bashir, S., Barmukh, R., Khan, R. S. A., Barbosa, F., Zhang, C., Chen, H., et al. (2022) · Frontiers in Plant Science · doi:10.3389/fpls.2021.794373 · Cited by 132
Neurotrophic and anti-neuroinflammatory constituents from the aerial parts of Coriandrum sativum
Cha, J. M., Yoon, D., Kim, S. Y., Kim, C. S., & Lee, K. R. (2020) · Bioorganic Chemistry · doi:10.1016/j.bioorg.2020.104443 · Cited by 14
Singh, R., Choudhary, S., Kumari, V., Meena, R. S., Meena, N. K., Y, R., & Verma, A. K. (2025) · Journal of Agriculture and Ecology · doi:10.58628/jae-2521-101
Metadata
- Authors
- Song, X., Nie, F., Chen, W., Ma, X., Gong, K., Yang, Q., Wang, J., Li, N., Sun, P., Pei, Q., Yu, T., Hu, J., Li, X., Wu, T., Feng, S., Li, X.-Q., & Wang, X.
- Venue
- Horticulture Research
- Publisher
- Oxford University Press (OUP)
- Published
- 2020-04-01
- Volume
- 7
- Issue
- 1
- ISSN
- 2662-6810
- 2052-7276
- PMC
- PMC7109041
- Cited by
- 56
- References
- 0
- Language
- en
- Funders
- China-Hebei 100 Scholars Supporting Project to
About these checks
Registry, retraction, Cites and statistics results are computed, not judged, with one exception: a printed reference that no index lists is read once by a model before it counts as a citation error. Claims are extracted by a model and kept only when their quote appears verbatim in the text; each cited source is then checked, with a model’s help, for whether it says what the claim relies on. Those verdicts can be wrong — read the claim’s quote and the cited source before relying on one.
Statistics and arithmetic are recomputed, not judged.
Confidence bands are shown only for fields calibrated on our annotated test set. None is calibrated yet, so no band is shown.
What counts as a claim ›How we measure confidence ›How we check this ›
Are you an author, or do you see a problem with this page? Request a review
Data sources
Bibliographic data: Semantic Scholar, OpenAlex, Crossref.
Contains information from the Semantic Scholar Academic Graph Datasets, made available under the ODC Attribution License (ODC-BY 1.0).
Semantic Scholar’s data is described in: Kinney, R., et al. (2023). The Semantic Scholar Open Data Platform. arXiv:2301.10140.
