

The DOI matches its Crossref record; 32 of the 32 references it cites were found in a registry or an index.
Piezo1 channels sense whole body physical activity to reset cardiovascular homeostasis and enhance performance
Open accessAbstract
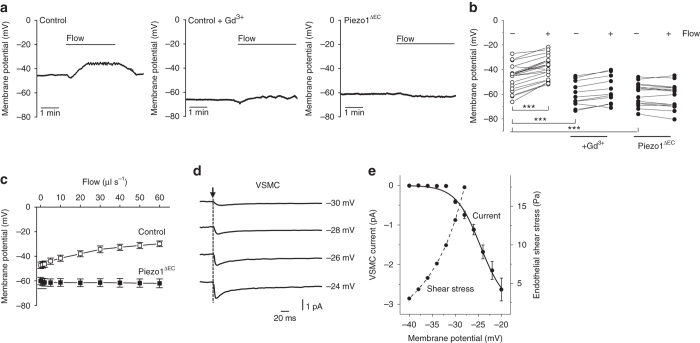
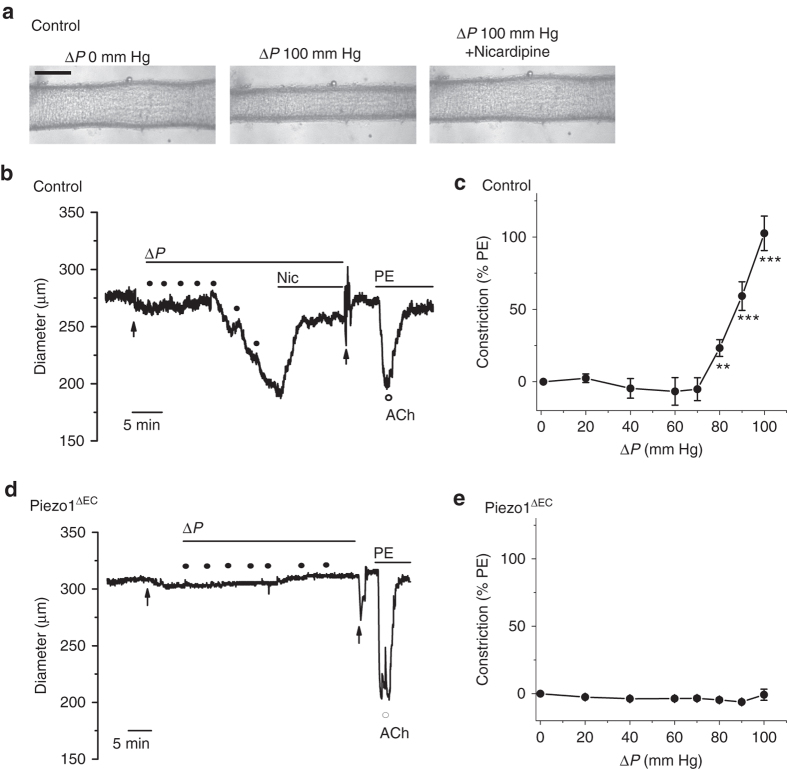
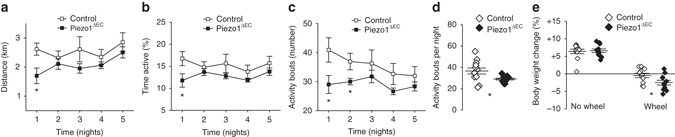
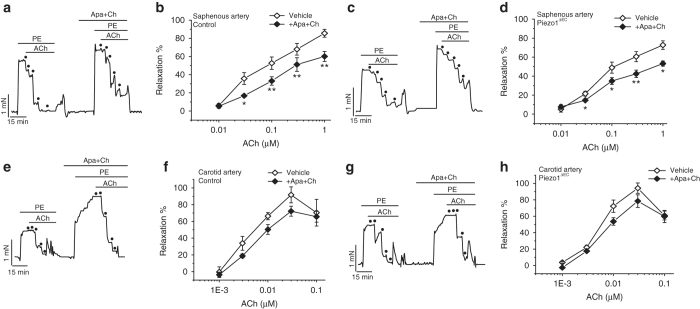
Mammalian biology adapts to physical activity but the molecular mechanisms sensing the activity remain enigmatic. Recent studies have revealed how Piezo1 protein senses mechanical force to enable vascular development. Here, we address Piezo1 in adult endothelium, the major control site in physical activity. Mice without endothelial Piezo1 lack obvious phenotype but close inspection reveals a specific effect on endothelium-dependent relaxation in mesenteric resistance artery. Strikingly, the Piezo1 is required for elevated blood pressure during whole body physical activity but not blood pressure during inactivity. Piezo1 is responsible for flow-sensitive non-inactivating non-selective cationic channels which depolarize the membrane potential. As fluid flow increases, depolarization increases to activate voltage-gated Ca 2+ channels in the adjacent vascular smooth muscle cells, causing vasoconstriction. Physical performance is compromised in mice which lack endothelial Piezo1 and there is weight loss after sustained activity. The data suggest that Piezo1 channels sense physical activity to advantageously reset vascular control.
Overview
The claims and statistics of this paper haven’t been checked yet.
Run the check — free, no account needed. It reads the open-access text and checks the sources it cites.
Integrity signals
Registry
Cites
Statistics
Figures
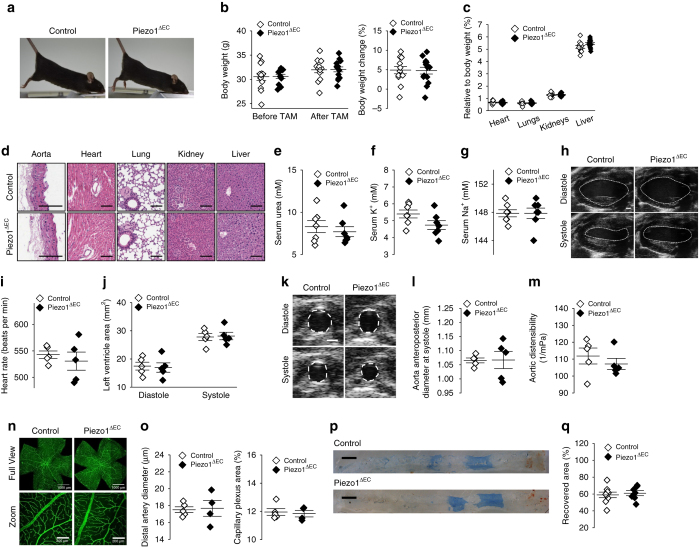
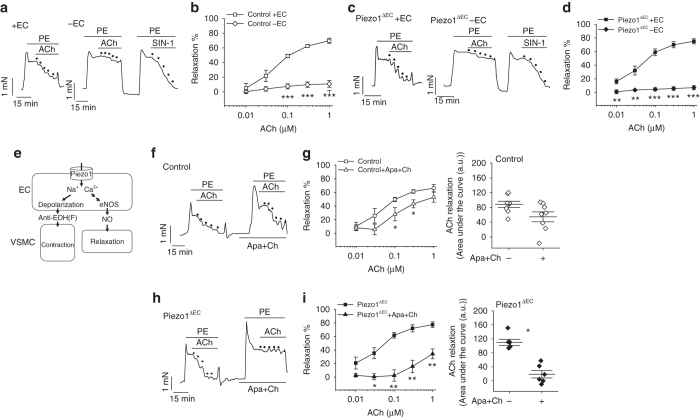
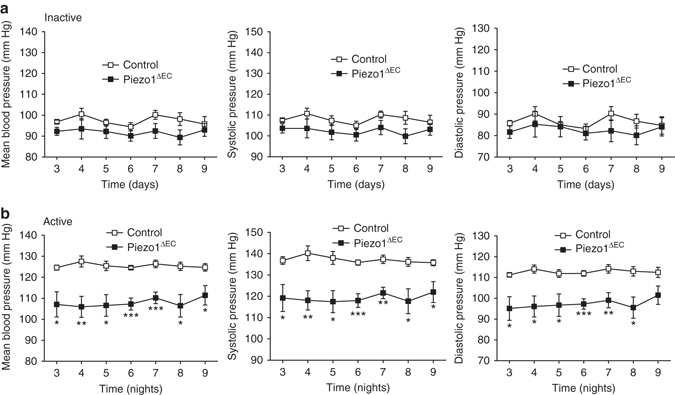
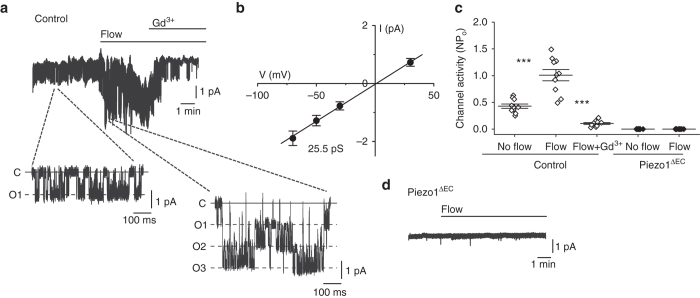
Verification
Claims the paper makes
The claims and statistics of this paper haven’t been checked yet.
Run the check — free, no account needed. It reads the open-access text and checks the sources it cites.
Claims other papers make about this one
Each is checked against this paper’s own text: does it say what the citing paper says it does?
The source backs part of the claim, not all of it — or backs it for a different population, condition or comparison.
In the citing paper
“Recent studies have identified Piezo1 channels in LSECs in both mice and humans,34,43,45,83 which affect vascular stability, including endothelial cell vasodilation, tension, and blood flow regulation.44”
From Mechanosensitive calcium ion channels Piezo1: A therapeutic target in liver disease (2025) · cites this paper as [34]
Experimental — accuracy not yet measuredThe source backs part of the claim, not all of it — or backs it for a different population, condition or comparison.
In the citing paper
“Numerous studies have indicated that most endothelial cells express Piezo1 in the mRNA and protein forms.33,34,82,83,84,85,86”
From Mechanosensitive calcium ion channels Piezo1: A therapeutic target in liver disease (2025) · cites this paper as [34]
Experimental — accuracy not yet measuredThe cited source says what the claim attributes to it.
In the citing paper
“In addition to mechanosensation, Piezo1 channels are vital for numerous physiological processes, including cell migration and differentiation,33 cardiovascular development,34 blood pressure regulation,35 and immune modulation.36”
From Mechanosensitive calcium ion channels Piezo1: A therapeutic target in liver disease (2025) · cites this paper as [34]
The check wasn’t confident either way, so it gives no verdict — never disputed.
In the citing paper
“Several studies have demonstrated that Piezo1 expression in cells follows a multimodal distribution pattern, with varying degrees of expression in the biliary system,39 liver sinusoidal microvasculature, portal vein narrow areas,34,43 and liver parenchyma.”
From Mechanosensitive calcium ion channels Piezo1: A therapeutic target in liver disease (2025) · cites this paper as [34]
Experimental — accuracy not yet measured
Self-check
Percentages, sums and reported differences re-computed from the paper’s own numbers.
The self-check needs the paper’s full text.
Citations
Cites
Piezo1 and Piezo2 Are Essential Components of Distinct Mechanically Activated Cation Channels
Coste, B., Mathur, J., Schmidt, M., Earley, T. J., Ranade, S., Petrus, M. J., Dubin, A. E., & Patapoutian, A. (2010) · Science · doi:10.1126/science.1193270 · Cited by 3,316
CORONARY HEART-DISEASE AND PHYSICAL ACTIVITY OF WORK
Morris, J. N., Heady, J. A., Raffle, P. A. B., Roberts, C., & Parks, J. W. (1953) · The Lancet · doi:10.1016/s0140-6736(53)90665-5 · Cited by 1,699
Piezo1 integration of vascular architecture with physiological force
Li, J., Hou, B., Tumova, S., Muraki, K., Bruns, A. F., Ludlow, M. J., Sedó, A., Hyman, A. J., McKeown, L., Young, R. S., et al. (2014) · Nature · doi:10.1038/nature13701 · Cited by 1,250
Self-citationCalcium channels, potassium channels, and voltage dependence of arterial smooth muscle tone.
Nelson, M., Patlak, J., Worley, J., & Standen, N. (1990) · American Journal of Physiology · doi:10.1152/ajpcell.1990.259.1.c3 · Cited by 1,140
Piezo1, a mechanically activated ion channel, is required for vascular development in mice
Ranade, S. S., Qiu, Z., Woo, S., Hur, S. S., Murthy, S. E., Cahalan, S. M., Xu, J., Mathur, J., Bandell, M., Coste, B., et al. (2014) · Proceedings of the National Academy of Sciences · doi:10.1073/pnas.1409233111 · Cited by 931
Joyner, M. J., & Casey, D. P. (2015) · Physiological Reviews · doi:10.1152/physrev.00035.2013 · Cited by 833
Exercise and the Cardiovascular System: Clinical Science and Cardiovascular Outcomes
Lavie, C. J., Arena, R., Swift, D. L., Johannsen, N. M., Sui, X., Lee, D.-C., Earnest, C. P., Church, T. S., O’Keefe, J. H., Milani, R. V., et al. (2015) · Circulation Research · doi:10.1161/circresaha.117.305205 · Cited by 782
Chemical activation of the mechanotransduction channel Piezo1
Syeda, R., Xu, J., Dubin, A. E., Coste, B., Mathur, J., Huynh, T. T., Matzen, J., Lao, J., Tully, D. C., Engels, I. H., et al. (2015) · eLife · doi:10.7554/elife.07369 · Cited by 747
Endothelial cation channel PIEZO1 controls blood pressure by mediating flow-induced ATP release
Wang, S., Chennupati, R., Kaur, H., Iring, A., Wettschureck, N., & Offermanns, S. (2016) · Journal of Clinical Investigation · doi:10.1172/jci87343 · Cited by 616
Touch, Tension, and Transduction – The Function and Regulation of Piezo Ion Channels
Wu, J. H., Lewis, A. H., & Grandl, J. M. (2016) · Trends in Biochemical Sciences · doi:10.1016/j.tibs.2016.09.004 · Cited by 586
Cited by
Sorted by citations
Items 201–300 of 305
Microfluidic chips for the endothelial biomechanics and mechanobiology of the vascular system
Su, H., LI, K., Liu, X., Du, J. H., WANG, L., Deng, X., & Fan, Y. (2021) · Biocell · doi:10.32604/biocell.2021.014900 · Cited by 8
Differential effects of resveratrol on the dilator responses of femoral arteries, ex vivo
Diaz, M., Parikh, V., Ismail, S., Maxamed, R., Tye, E. S. L., Austin, C., Dew, T. P., Graf, B. A., Vanhees, L., Degens, H., et al. (2019) · Nitric Oxide · doi:10.1016/j.niox.2019.07.008 · Cited by 8
Qin, Y. (2025) · Mechanobiology in Medicine · doi:10.1016/j.mbm.2025.100116 · Cited by 8
Jia, B., Tang, X., Rossmann, M. P., Zon, L. I., Engert, F., & Cohen, A. E. (2025) · Current Biology · doi:10.1016/j.cub.2025.10.053 · Cited by 11
A Pancancer Study of PIEZO1 as a Prognosis and Immune Biomarker of Human Tumors
Wu, Y., Zhang, J., Hou, C., Wang, H., Zhu, M., & Yao, X. (2022) · Journal of Oncology · doi:10.1155/2022/6725570 · Cited by 7
Hart, D. A. (2024) · International Journal of Molecular Sciences · doi:10.3390/ijms25073866 · Cited by 7
Heterogeneous phenotype of Hereditary Xerocytosis in association with PIEZO1 variants
Oliveira, P. D. M., Balan, A., Muto, N. H., Cervato, M. C., Fonsêca, G. H. H., Suganuma, L. M., Gualandro, S. F. M., Pinho, J. R. R., Mohandas, N., Silveira, P. A. A., et al. (2020) · Blood Cells Molecules and Diseases · doi:10.1016/j.bcmd.2020.102413 · Cited by 9
The Rheology of the Carotid Sinus: A Path Toward Bioinspired Intervention
Iskander, A. J., Bilgi, C., Naftalovich, R., Hacihaliloglu, I., Berkman, T., Naftalovich, D., & Pahlevan, N. M. (2021) · Frontiers in Bioengineering and Biotechnology · doi:10.3389/fbioe.2021.678048 · Cited by 9
Pathophysiology and Genetic Associations of Varicose Veins: A Narrative Review
Chen, T., Liu, P., Zhang, C., Jin, S. H., Kong, Y., Feng, Y., & Sun, Z. (2024) · Angiology · doi:10.1177/00033197241227598 · Cited by 10
Recent advances and emerging perspectives in vascular and cardiovascular research: A 2025 update
Kishimoto, S., & Higashi, Y. (2026) · Hypertension Research · doi:10.1038/s41440-025-02540-1 · Cited by 6
Piezo1 channels mediate vasorelaxation of uterine arteries from pseudopregnant rats
Arishe, O. O., McKenzie, J., Justina, V. D., Moraes, R. D. A., Webb, R. C., & Priviero, F. B. M. (2023) · Frontiers in Physiology · doi:10.3389/fphys.2023.1140989 · Cited by 6
Genetic variants of PIEZO1 associate with COVID-19 fatalityPreprint
Cheng, C. W., Deivasikamani, V., Ludlow, M. J., Vecchis, D. D., Kalli, A. C., Beech, D. J., & Sukumar, P. (2020) · medRxiv · doi:10.1101/2020.06.01.20119651 · Cited by 6
Self-citationWang, M. J., Zhu, Y. C., & Shi, J. (2021) · Acta Physiologica · doi:10.1111/apha.13728 · Cited by 6
Self-citationCasso-Chapa, B., González, N. A. V., Le, N., Palaskas, N. L., Nead, K. T., Eutsey, L. P., Samanthapudi, V. S. K., Osborn, A. M., Lee, J., Mejia, G. F., et al. (2025) · Arteriosclerosis Thrombosis and Vascular Biology · doi:10.1161/atvbaha.124.319870 · Cited by 5
Exercise as elixir to combat cardiovascular ageing
Feng, Z., Yuan, X., Yi, W., Gao, F., Sun, Y., & Zhang, X. (2025) · Ageing Research Reviews · doi:10.1016/j.arr.2025.102848 · Cited by 7
Mechanosensor Piezo1‑mediated smooth muscular cell pyroptosis contributes to vascular calcification
Tao, J., You, D., Feng, Z., Li, H., Zhang, Y., Cui, Y., Lin, K., Luo, B., Yin, S., & Tan, H. (2025) · International Journal of Molecular Medicine · doi:10.3892/ijmm.2025.5637 · Cited by 7
Sazdova, I., Gagov, H., Hadzi‐Petrushev, N., Konaktchieva, M. N., Konakchieva, R., & Mladenov, M. I. (2026) · Applied Sciences · doi:10.3390/app16063027 · Cited by 5
Merten, A.-L., Schöler, U., Guo, Y., Linsenmeier, F., Martinac, B., Friedrich, O., & Schürmann, S. (2024) · Cellular and Molecular Life Sciences · doi:10.1007/s00018-024-05159-6 · Cited by 5
Fancher, I. S. (2021) · Current topics in membranes · doi:10.1016/bs.ctm.2021.07.001 · Cited by 6
Piezo1 channel activates ADAM10 sheddase to regulate Notch1 and gene expressionPreprint
Caolo, V., Debant, M., Endesh, N., Futers, T. S., Lichtenstein, L., Parsonage, G., Jones, E. A. V., & Beech, D. J. (2019) · bioRxiv (Cold Spring Harbor Laboratory) · doi:10.1101/732370 · Cited by 5
Self-citationAn inter-channel cooperative mechanism mediates PIEZO1’s exquisite mechanosensitivityPreprint
Wijerathne, T. D., Özkan, A. D., Jiang, W., Luo, Y., & Lacroix, J. J. (2021) · bioRxiv (Cold Spring Harbor Laboratory) · doi:10.1101/2021.04.16.440217 · Cited by 5
Force of change: How biomechanical cues drive endothelial plasticity and morphogenesis
Bornhorst, D., Mortazavi, N., & Gunawan, F. (2025) · Seminars in Cell and Developmental Biology · doi:10.1016/j.semcdb.2025.103623 · Cited by 4
Duan, X., Liu, R., Zhao, Y., Geng, Y., Xi, Y., & Tian, Z. (2025) · Basic Research in Cardiology · doi:10.1007/s00395-025-01155-4 · Cited by 4
PIEZO1 channel mechanosensing in hepatobiliary physiology and disease
Konstantinou, C., Patel, S. D., Lalor, P. F., Moore, J. B., Roberts, L. D., Endesh, N., Wah, T. M., Samson, A., Hakeem, A. R., Prasad, K. R., et al. (2025) · American Journal of Physiology-Cell Physiology · doi:10.1152/ajpcell.00782.2025 · Cited by 4
Self-citationPhysical exercise protects cardiovascular fitness in long-term spaceflight: what have we learned?
Zhang, Z., Xing, W., Wu, G., Zhang, X., Li, J., YingXian, L. I., & Gao, F. (2026) · Science China Life Sciences · doi:10.1007/s11427-025-3139-9 · Cited by 4
Self-citationMechanotransduction and dynamic outflow regulation in trabecular meshwork requires Piezo1 channelsPreprint
Yarishkin, O. V., Phuong, T. T. T., Baumann, J. M., Ieso, M. L. D., Vázquez-Chona, F., Rudzitis, C. N., Sundberg, C. A., Lakk, M., Stamer, W. D., & Križaj, D. (2020) · bioRxiv (Cold Spring Harbor Laboratory) · doi:10.1101/2020.06.30.180653 · Cited by 4
Ludlow, M. J., Povstyan, O. V., Linley, D. M., Martin‐Almedina, S., Revill, C., Cuthbertson, K., Smith, K. A., Fay, E., Fotiou, E., Bush, A., et al. (2023) · medRxiv · doi:10.1101/2023.08.01.23292554 · Cited by 4
Self-citationLi, Z., Jiang, F., Chen, Y., Li, Z., Wu, Y., He, Z., Wu, D., & Xiang, H. (2026) · MedComm · doi:10.1002/mco2.70537 · Cited by 5
Zhao, X., Shen, H., Liu, Z., Wu, Y., Chen, B., Yao, J., Zheng, L., (13940), R. Z., Lin, M., Zhang, H., et al. (2026) · Research · doi:10.34133/research.1212 · Cited by 4
Mhalhel, K., Cavallaro, M., Pansera, L., Franco, G. A., Montalbano, G., Laurà, R., Abbate, F., Germanà, A., Levanti, M. B., & Aragona, M. (2025) · International Journal of Molecular Sciences · doi:10.3390/ijms26094388 · Cited by 3
Zhou, Z. (2019) · Journal of Biosciences and Medicines · doi:10.4236/jbm.2019.712012 · Cited by 3
Biological sensing of fluid flow—lessons from PIEZO1
Beech, D. J., Fagnen, C., & Kalli, A. C. (2024) · Biophysical Reviews · doi:10.1007/s12551-024-01246-x · Cited by 4
Self-citationGupta, T., Singh, T. G., & Singh, R. (2025) · Molecular Biology Reports · doi:10.1007/s11033-025-11114-w · Cited by 4
Electrophysiological Recordings of Single-cell Ion Currents Under Well-defined Shear Stress
Fancher, I. S., & Levitan, I. (2019) · Journal of Visualized Experiments · doi:10.3791/59776 · Cited by 3
Deletion of PIEZO1 in adult cardiomyocytes accelerates cardiac aging and causes premature deathPreprint
Yu, Z., Guo, Y., Kesteven, S. H., Cheng, D., Lei, H., Wu, J., Nadar, E. I., Macdonald, P. S., Xaymardan, M., Cox, C. D., et al. (2025) · bioRxiv (Cold Spring Harbor Laboratory) · doi:10.1101/2025.01.20.633994 · Cited by 3
Jia, B., Tang, X., Rossmann, M. P., Zon, L. I., Engert, F., & Cohen, A. E. (2025) · bioRxiv (Cold Spring Harbor Laboratory) · doi:10.1101/2025.02.05.636757 · Cited by 3
Mensah, E. A., Daneshtalab, N., & Tabrizchi, R. (2024) · Pharmacology Research & Perspectives · doi:10.1002/prp2.1227 · Cited by 2
The Role of miRNAs in Mechanotransduction Regulation and Cancer Development
Vela-Alcántara, A. M., HernáNdez-SáNchez, D. J., & Tamaríz, E. (2025) · Biocell · doi:10.32604/biocell.2025.066201 · Cited by 3
Maufroy, E., Baeyens, N., & Deboeck, G. (2026) · Cellular and Molecular Life Sciences · doi:10.1007/s00018-026-06140-1 · Cited by 2
Myeloid Piezo1 Drives Cardiac Repair Through Orai1–Rac1-Dependent Efferocytosis
Liu, S., Xu, H., Deng, B., Jiang, J., He, Y., Fang, C., Zhang, Z., Pan, X., Luo, S., Wan, R., et al. (2026) · Circulation Research · doi:10.1161/circresaha.125.328012 · Cited by 2
Self-citationThe Physiological Aspects of Exercise-Induced Adaptation in the Cardiovascular System
Ahmad, A. A. (2024) · Al- Anbar Medical Journal · doi:10.33091/amj.2024.150002.1729 · Cited by 1
Pillai, J., Sridhar, A., Sung, K., Shi, L., & Wu, C. (2026) · Biochemistry and Biophysics Reports · doi:10.1016/j.bbrep.2026.102480 · Cited by 2
Prohibited Olympic Medalist with PIEZO1 VUS Who Claims Innocence
Sonkodi, B., Kováts, T., Gálik, B., Tompa, M., Urban, P. P., Nagy, Z. F., Ács, P., Tóth, M., & Gyenesei, A. (2024) · International Journal of Molecular Sciences · doi:10.3390/ijms252111842 · Cited by 2
The mechanosensitive Piezo1 orchestrating angiogenesis is essential in bone fracture repairPreprint
Chen, P., Zhang, G., Jiang, S., Ning, Y., Deng, B., Pan, X., Liu, S., He, Y., Zhang, L., Wan, R., et al. (2019) · bioRxiv (Cold Spring Harbor Laboratory) · doi:10.1101/2019.12.23.887661 · Cited by 2
Self-citationPiezo mechanosensory channels regulate centrosome integrityPreprint
David, L., Martinez, L., Xi, Q. J., Fan, X., Kooshesh, K. A., Zhang, Y., Shah, J. V., Lu, W., Maas, R. L., & Wu, H. (2022) · bioRxiv (Cold Spring Harbor Laboratory) · doi:10.1101/2022.04.12.488050 · Cited by 2
Fluid shear stress facilitates prostate cancer metastasis through Piezo1-Src-YAP axisPreprint
Kim, O., Choi, Y. W., Hong, S. A., Hong, M. E., Chang, I. H., & Lee, H. J. (2022) · Research Square · doi:10.21203/rs.3.rs-1678497/v1 · Cited by 3
Miglis, M. G., Larsen, N. W., & Muppidi, S. (2022) · Clinical Autonomic Research · doi:10.1007/s10286-022-00871-4 · Cited by 3
Javed, A., Stubb, A., Villeneuve, C., Peters, F., Rübsam, M., Niessen, C. M., Biggs, L. C., & Wickström, S. A. (2024) · bioRxiv (Cold Spring Harbor Laboratory) · doi:10.1101/2024.11.20.624378 · Cited by 2
Bell, B., Jaramillo-Granada, Á. M., Orlin, D. J., Weng, W.-H., Wen, H., Sotomayor, M. M., Chesler, A. T., Baker, M. L., Cordero-Morales, J. F., & Vásquez, V. (2025) · Cell Reports · doi:10.1016/j.celrep.2025.116878 · Cited by 2
Uchida, K., & Iwase, M. (2026) · Cells · doi:10.3390/cells15030293 · Cited by 1
Jieensi, M., Huang, K., Fan, X., Wen, S., Wang, F., Jiang, R., Pang, L., Li, H., Wang, Y., & Sun, X. (2026) · Discover Applied Sciences · doi:10.1007/s42452-026-08291-z · Cited by 1
The Potential Role of Calcium Channels in Pulmonary Hypertension
Wu, P., Zhong, D., He, X., Li, Y. X., & Zhang, H. (2026) · BioMed Research International · doi:10.1155/bmri/4121036 · Cited by 1
Sensing of shear stress in vascular endothelial cells – from physiology to pathology
Chuntharpursat‐Bon, E., Serbanovic‐Canic, J., Alfaidi, M., Jones, E. A. V., Cheng, C., White, S. J., Hsiai, T. K., Jo, H., Baeyens, N., Fang, Y., et al. (2026) · Journal of Cell Science · doi:10.1242/jcs.264456 · Cited by 2
Polu, P. R., Mishra, S., & Gupta, J. (2026) · Regenerative Engineering and Translational Medicine · doi:10.1007/s40883-026-00606-1 · Cited by 2
A Novel Triple-gate Model for Mechanosensitive Ion Channel Piezo1
Zhang, Y., & Zou, Q. (2022) · International Conference on Bioinformatics and Computational Biology (ICBCB) · doi:10.1109/icbcb55259.2022.9802499 · Cited by 1
Bellut-Staeck, U. M. (2023) · Journal of Biosciences and Medicines · doi:10.4236/jbm.2023.116003 · Cited by 1
Piezo1-mediated mechanical signaling in cardiovascular regulation
Lou, J. J., Feng, G. A. O., & ZHANG, X. (2024) · Scientia Sinica Vitae · doi:10.1360/ssv-2024-0129 · Cited by 1
Triskelion channels might bring Star Wars to the global problem of hypertension
Beech, D. J. (2018) · Cell Calcium · doi:10.1016/j.ceca.2018.12.005 · Cited by 1
Self-citationVE-PTP inhibition: a novel therapeutic target for hypertension in diabetic patients
Arishe, O. O., & Webb, R. C. (2021) · Cardiovascular Research · doi:10.1093/cvr/cvab143 · Cited by 1
Fluid Shear Stress Facilitates Prostate Cancer Metastasis Through Piezo1-Src-YAP AxisPreprint
Kim, O., Choi, Y. W., Hong, S. A., Hong, M. E., Chang, I. H., & Lee, H. J. (2022) · SSRN Electronic Journal · doi:10.2139/ssrn.4134175 · Cited by 1
McErlain, T., Glass, M. J., McCulla, E. C., Madden, C. A., Hillers‐Ziemer, L. E., Overdahl, K. E., Jarmusch, A. K., Kruhlak, M. J., Chesler, A. T., Yang, H. H., et al. (2025) · bioRxiv (Cold Spring Harbor Laboratory) · doi:10.1101/2025.02.15.638347 · Cited by 1
Contractile functions of Piezo1 channels in murine arteries
Endesh, N. (2018) · White Rose eTheses Online (University of Leeds, The University of Sheffield, University of York)
Self-citationStudy on the cellular and molecular responses to a shock wave in the rat brain
Inaba, M., Kawauchi, S., Adachi, T. K., Sato, S., & Nishidate, I. (2019) · Neural Imaging and Sensing · doi:10.1117/12.2509235
Blythe, N. M. (2019) · White Rose eTheses Online (University of Leeds, The University of Sheffield, University of York)
Biomechanics in Small Artery Remodeling
Bakker, E. N. T. P., & VanBavel, E. (2021) · Cardiac and vascular biology · doi:10.1007/978-3-030-63164-2_3
Storch, U., Gudermann, T. W., & y Schnitzler, M. M. (2021) · Cardiac and vascular biology · doi:10.1007/978-3-030-63164-2_5
Baradaran‐Heravi, A., Bauer, C. C., Pickles, I. B., Hosseini-Farahabadi, S., Balgi, A. D., Choi, K., Linley, D. M., Beech, D. J., Roberge, M., & Bon, R. S. (2021) · bioRxiv (Cold Spring Harbor Laboratory) · doi:10.1101/2021.04.07.438788
Self-citationQuantum Dots of Halide Perovskite
Zhang, Y., Wu, G., & Shen, Q. (2021) · doi:10.1002/9783527826391.ch11
Faculty Opinions recommendation of GPR68 senses flow and is essential for vascular physiology.
Liberles, S. D. (2018) · Faculty Opinions – Post-Publication Peer Review of the Biomedical Literature · doi:10.3410/f.733073878.793545393
Lipscombe, D., & Toro, C. P. (2021) · Wiley eBooks · doi:10.1002/9780470015902.a0029276
Sangachin, A. R., Abdi, A., & Barari, A. (2022) · Jorjani Biomedicine Journal · doi:10.52547/jorjanibiomedj.10.1.26
PIEZO1 force sensing controls global lipid homeostasisPreprint
Lichtenstein, L., Cheng, C. W., Evans, E. L., Gaunt, H. J., Bartoli, F., Chuntharpursat‐Bon, E., Patel, S. D., Konstantinou, C., Futers, T. S., Reay, M., et al. (2023) · bioRxiv (Cold Spring Harbor Laboratory) · doi:10.1101/2023.07.23.550198
Self-citationNuanxinkang (NXK) ameliorates Piezo1-mediated pyroptosis post-myocardial infarction
Liu, S., Fang, C., Luo, S., He, Y., Zhang, Z., Jiang, J., Chen, Y., Wan, R., Xu, H., Xian, S., et al. (2023) · Pharmacological Research - Modern Chinese Medicine · doi:10.1016/j.prmcm.2023.100299
Self-citationThe Role of Stem Cells in Exercise-Enhanced Organogenesis and Regeneration
Liu, C., Wu, X., Chatterjee, E., Li, G., & Xiao, J. (2023) · Springer eBooks · doi:10.1007/978-981-99-0846-2_46-1
Mensah, E., Daneshtalab, N., & Tabrizchi, R. (2023) · doi:10.22541/au.169338613.38682670/v1
The Role of Stem Cells in Exercise-Enhanced Organogenesis and Regeneration
Liu, C., Wu, X., Chatterjee, E., Li, G., & Xiao, J. (2024) · Springer eBooks · doi:10.1007/978-981-99-7119-0_46
The effects of soleus push up on glucose tolerance among individuals with prediabetesPreprint
Elek, D., Tóth, M., Sonkodi, B., Ács, P., Kovács, G. L., & Melczer, C. (2024) · bioRxiv (Cold Spring Harbor Laboratory) · doi:10.1101/2024.11.14.623602
Endothelial Piezo1 regulates muscle AKT abundance and mechanically induced muscle hypertrophyPreprint
Bartoli, F., Tickle, P. G., Gallagher, H., Debant, M., Cheng, C. W., Futers, T. S., Daou, H. N., Yuldasheva, N. Y., Beech, D. J., & Bowen, T. S. (2025) · bioRxiv (Cold Spring Harbor Laboratory) · doi:10.1101/2025.09.02.673617
Self-citationXiong, H., Yang, J., Guo, J., Ma, A., Wang, B., & Kang, Y. (2022) · Figshare · doi:10.6084/m9.figshare.20408481
Zhang, X., Leng, S., Liu, X., Hu, X., Liu, Y., Li, X., Feng, Q., Guo, W., Li, N., Sheng, Z., et al. (2024) · Figshare · doi:10.6084/m9.figshare.26715751
Zhang, X., Leng, S., Liu, X., Hu, X., Liu, Y., Li, X., Feng, Q., Guo, W., Li, N., Sheng, Z., et al. (2024) · Figshare · doi:10.6084/m9.figshare.25749960
Zhang, X., Leng, S., Liu, X., Hu, X., Liu, Y., Li, X., Feng, Q., Guo, W., Li, N., Sheng, Z., et al. (2024) · Figshare · doi:10.6084/m9.figshare.25750129
Caulier, A. (2020) · theses.fr (ABES) · doi:10.70675/be1fe49bz54d1z42eaz98acze40f1fd3fc55
Otenabant is a Selective Antagonist of Human PIEZO1Preprint
Jaquet, V., Penttinen, R., Rodríguez-Urquirizar, G., Castelbou, C., Cambet, Y., Rosa, N., Bourdin, M., Asghariastanehei, B., de Lima, F., Martin, M., et al. (2026) · bioRxiv (Cold Spring Harbor Laboratory) · doi:10.64898/2026.04.28.720360
Wnts are endothelial cell-derived PKD1/PKD2-dependent autocrine/paracrine vasodilators
Mbiakop, U. C., Mackay, C., Mata‐Daboin, A., Pontes, R. B., Leo, M. D., & Jaggar, J. H. (2026) · Physiology · doi:10.1152/physiol.2026.41.s1.2294878
Wang, Z., Chen, F., & Li, Z. (2026) · Journal of Inflammation Research · doi:10.2147/jir.s609340
Infrasound affects vasomotion via PIEZO1 dysregulation
Dastan, M., Bellut-Staeck, U. M., Zhou, J., & Lehmann, C. (2026) · Medical Hypotheses · doi:10.1016/j.mehy.2026.112055
Guinamard, R., Kerevel, C., Darengosse, A., Platel, V., Sallé, L., & Simard, C. (2026) · Cell Calcium · doi:10.1016/j.ceca.2026.103163
Flow-Induced Yap/Taz Signaling Balances Endothelial and Hematopoietic Stem Cell FatesPreprint
Sugden, W. W., George, S., LeBlanc, Z. C., Walcheck, M. T., Meader, E., Goldstein, J., Molnar, E., Zhu, W., Mout, R., Li, C., et al. (2026) · bioRxiv (Cold Spring Harbor Laboratory) · doi:10.64898/2026.06.20.733393
The Role of Piezo Ion Channels in Pulmonary Hypertension
Chen, K., Li, L., Huang, Y., Ye, L., Wang, Y., Zhang, Z., Hang, C., Li, Q., Cao, Q., & Du, L. (2026) · Pulmonary Circulation · doi:10.1002/pul2.70360
Li, B., Kang, H.-M., Pan, W., & Li, Y. (2026) · Mechanobiology in Medicine · doi:10.1016/j.mbm.2026.100207
Chen, X., Yang, S., Zhu, C., Yu, X., Wang, Y., Tian, Y., Liu, T., & Wang, S. (2026) · Redox Biology · doi:10.1016/j.redox.2026.104321 · Cited by 1
Piezo1-mitochondrial calcium coupling in mechanotransduction, mitochondrial stress, and cell fate
Shi, P., Zhao, X., Li, M., Wu, X., Li, Y., & Qiming, Z. (2026) · Cell Calcium · doi:10.1016/j.ceca.2026.103181
Piezo1 channel: structure, mechanogating mechanism, functions, diseases and therapeutic strategy
Wu, Q., Hu, Y., Wang, Y., Zhu, F., Xu, Q., Xu, L., Xu, J., & Xu, T. (2026) · Molecular Biomedicine · doi:10.1186/s43556-026-00549-7 · Cited by 1
Shin, J. (2026) · Mechanobiology · doi:10.1177/29780241261479992
PIEZO Channels in Metabolism and Metabolic Diseases: Research Advances and Therapeutic Strategies
Feng, Z., Huang, J., He, J., Luo, P., Yu, Y., Li, L., & Yu, R. (2026) · Current Obesity Reports · doi:10.1007/s13679-026-00754-z
Exercise-altered fluid shear stress regulates vascular endothelial inflammation via Piezo1
Yang, S., & Wang, S. (2026) · Frontiers in Physiology · doi:10.3389/fphys.2026.1875135
Karim, A. M. (2026) · Micromachines · doi:10.3390/mi17091086
Davis, M. J., Kim, H. J., Li, M., Castorena‐Gonzalez, J. A., Schulz, M. E., Pea, G., Pal, S., Domeier, T. L., Scallan, J. P., Earley, S., et al. (2026) · eLife · doi:10.7554/elife.109466.2
Lou, J., Yang, M., Hu, Y., Liu, X., Li, H., Feng, Z., Xi, Y., Xing, C., Yuan, L., Li, J., et al. (2026) · Journal of Extracellular Vesicles · doi:10.1002/jev2.70375
Self-citation
Metadata
- Authors
- Rode, B., Shi, J., Endesh, N., Drinkhill, M. J., Webster, P. J., Lotteau, S. J., Bailey, M. A., Yuldasheva, N. Y., Ludlow, M. J., Cubbon, R. M., Li, J., Futers, T. S., Morley, L., Gaunt, H. J., Marszalek, K., Viswambharan, H., Cuthbertson, K., Baxter, P. D., Foster, R., Sukumar, P., Weightman, A., Calaghan, S. C., Wheatcroft, S. B., Kearney, M. T., & Beech, D. J.
- Affiliations
- University of Leeds (GB)
- University of Manchester (GB)
- Corresponding author
- Beech, David J.
- ORCID
- Shi, Jian
- Endesh, Naima
- Drinkhill, Mark J.
- Lotteau, Sabine J.
- Bailey, Marc A.
- Yuldasheva, Nadira Y.
- Ludlow, Melanie J.
- Cubbon, Richard M.
- Li, Jing
- Futers, T. Simon
- Morley, Lara
- Marszalek, Katarzyna
- Viswambharan, Hema
- Cuthbertson, Kevin
- Baxter, Paul D.
- Foster, Richard
- Sukumar, Piruthivi
- Weightman, Andrew
- Calaghan, Sarah C.
- Wheatcroft, Stephen B.
- Kearney, Mark T.
- Beech, David J.
- Venue
- Nature Communications
- Published
- 2017-08-24
- Volume
- 8
- Issue
- 1
- Pages
- 350-350
- ISSN
- 2041-1723 (ISSN-L)
- PMC
- PMC5571199
- OpenAlex
- W2747918806
- Cited by
- 305
- References
- 32
- Citations by year
- 2026: 37 · 2025: 31 · 2024: 44 · 2023: 32 · 2022: 49 · 2021: 40 · 2020: 18 · 2019: 31 · 2018: 20 · 2017: 3
- FWCI
- 12.32
- Type
- journal article
- Language
- en
- Open access
- gold
- doi.org
- Locations
- Nature Communications (publishedVersion, cc-by)
- Europe PMC (PubMed Central) (publishedVersion, cc-by)
- PubMed Central (publishedVersion, cc-by)
- PubMed (publishedVersion)
- White Rose Research Online (University of Leeds, The University of Sheffield, University of York) (acceptedVersion)
- RePEc: Research Papers in Economics (submittedVersion)
- DOAJ (DOAJ: Directory of Open Access Journals) (submittedVersion, cc-by-sa)
- Research Explorer (The University of Manchester) (submittedVersion, cc-by)
- Funders
- Wellcome Trust (110044/Z/15/Z)
- National Institute for Health and Care Research (ACF-2014-02-003)
- British Heart Foundation (RG/15/7/31521, PG/12/88/29951, FS/12/80/29821, FS/14/22/30734, FS/17/2/32559)
- Medical Research Council (MR/L019051/1, MR/P002099/1)
- Topics
- Life Sciences › Neuroscience › Sensory Systems › Ion Channels and Receptors
- Health Sciences › Medicine › Physiology (medical) › Erythrocyte Function and Pathophysiology
- Life Sciences › Biochemistry, Genetics and Molecular Biology › Molecular Biology › Ion channel regulation and function
- Keywords
- Piezo1, mechanical force sensing, endothelium-dependent relaxation, mesenteric resistance arteries, blood pressure, vasoconstriction, voltage-gated calcium channels, vascular smooth muscle, physical performance, weight loss, cardiovascular homeostasis
- MeSH terms
- Animals, Blood Pressure, Cells, Cultured, Homeostasis, Humans, Ion Channels, Male, Physical Conditioning, Animal, Vasoconstriction, Patch-Clamp Techniques, Calcium Signaling, Myocytes, Smooth Muscle, Endothelial Cells, Mice, HEK293 Cells
About these checks
Registry, retraction, Cites and statistics results are computed, not judged, with one exception: a printed reference that no index lists is read once by a model before it counts as a citation error. Claims are extracted by a model and kept only when their quote appears verbatim in the text; each cited source is then checked, with a model’s help, for whether it says what the claim relies on. Those verdicts can be wrong — read the claim’s quote and the cited source before relying on one.
Statistics and arithmetic are recomputed, not judged.
Confidence bands are shown only for fields calibrated on our annotated test set. None is calibrated yet, so no band is shown.
What counts as a claim ›How we measure confidence ›How we check this ›
Are you an author, or do you see a problem with this page? Request a review
