

The DOI matches its Crossref record; 64 of the 65 references it cites were found in a registry or an index; 3 of the 85 sources its claims cite were checked for support.
The gut microbiome in atherosclerotic cardiovascular disease
Open accessAbstract
The gut microbiota has been linked to cardiovascular diseases. However, the composition and functional capacity of the gut microbiome in relation to cardiovascular diseases have not been systematically examined. Here, we perform a metagenome-wide association study on stools from 218 individuals with atherosclerotic cardiovascular disease (ACVD) and 187 healthy controls. The ACVD gut microbiome deviates from the healthy status by increased abundance of Enterobacteriaceae and Streptococcus spp. and, functionally, in the potential for metabolism or transport of several molecules important for cardiovascular health. Although drug treatment represents a confounding factor, ACVD status, and not current drug use, is the major distinguishing feature in this cohort. We identify common themes by comparison with gut microbiome data associated with other cardiometabolic diseases (obesity and type 2 diabetes), with liver cirrhosis, and rheumatoid arthritis. Our data represent a comprehensive resource for further investigations on the role of the gut microbiome in promoting or preventing ACVD as well as other related diseases.
Overview
AI snapshot
Written from the paper’s full text.
TL;DR
In a metagenome-wide association study of 405 Chinese fecal samples, atherosclerotic cardiovascular disease (ACVD) was associated with altered gut microbiome composition and function, including increased Enterobacteriaceae and Streptococcus and reduced butyrate-producing bacteria. A microbiome-based classifier distinguished ACVD from controls with an AUC of 0.86, and cross-disease comparisons linked cardiometabolic diseases and cirrhosis to a less fermentative, more inflammatory gut environment.
Key findings
- ACVD samples differed from controls in multivariate analyses (PERMANOVA P < 10⁻⁶ with or without medication adjustment), with increased Enterobacteriaceae, Streptococcus spp., Ruminococcus gnavus, and Eggerthella lenta, and depletion of butyrate producers such as Roseburia intestinalis and Faecalibacterium cf. prausnitzii.
- Of 2,982 metagenomic linkage groups (MLGs) with >100 genes, 536 differed significantly between ACVD and controls (Wilcoxon rank-sum, BH q < 0.05), with 320 more abundant in ACVD; these represented on average 56.5% of relative abundance across all MLGs.
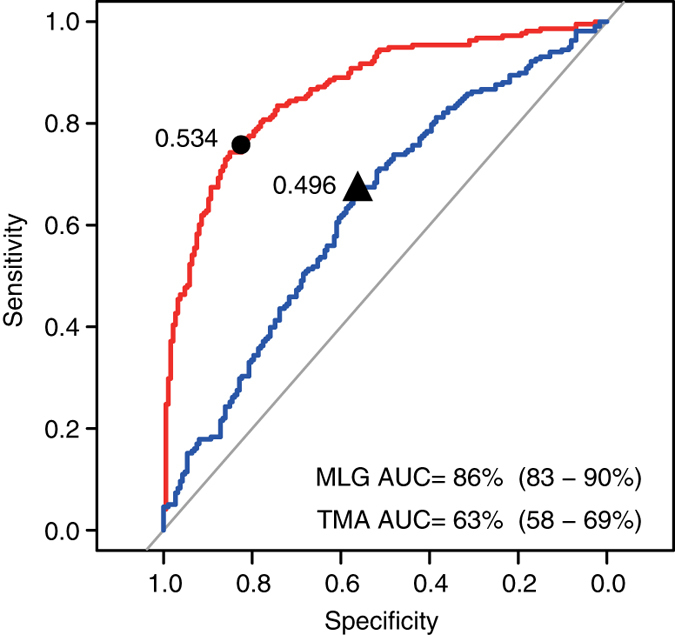
- A random forest classifier using 47 MLGs achieved an AUC of 0.86 for ACVD, whereas TMA lyases alone gave an AUC of 0.63; ACVD-enriched bacteria encoded choline-TMA lyase (CutC) and/or the promiscuous TMA lyase YeaW/X.
- Functionally, ACVD microbiomes showed higher potential for simple sugar and amino acid transport, O-antigen LPS synthesis, glycerolipid metabolism, fatty acid degradation, and TMA production, but lower potential for most vitamin biosynthesis, tetrahydrofolate synthesis, glycan degradation, and butyrate/propionate synthesis.
Methods
- Metagenomic shotgun sequencing was performed on 405 fecal samples from 218 ACVD patients (≥50% stenosis in one or more vessels) and 187 healthy controls; after filtering, 2.2 Tb of high-quality reads (average 55.2 million reads/sample) were mapped to a 9.9-million-gene reference catalog, with average mapping of 80.0 ± 3.5%.
- Genes were clustered into 2,982 MLGs (>100 genes) based on co-abundance; differential abundance used Wilcoxon rank-sum tests with BH q < 0.05, and analyses included PCA, dbRDA, PERMANOVA, random forest cross-validation, group LASSO, MaAsLin, KEGG reporter scores, and PanPhlAn.
- Cross-disease comparisons mapped published Chinese metagenomic data to the same catalog and pipeline: liver cirrhosis (120 cases/111 controls), obesity (72/79), type 2 diabetes (171/174), and rheumatoid arthritis (95/74), totaling 1,250 samples across diseases.
Limitations
- The paper states that drug treatment may affect gut microbiota composition and constitutes a confounding factor, although ACVD status, not current drug use, was the major distinguishing feature; effects of different drugs remain to be explored in intervention trials in larger cohorts.
- The paper states that validation of the identified markers would require independent and much larger cohorts.
- Evident from the text: this is a cross-sectional case–control study, so it cannot establish causality; additionally, only Chinese cohorts were used because of substantial population differences in the gut microbiome, limiting generalizability.
Model-written summary. Check it against the paper before relying on it.
Integrity signals
Registry
Cites
Statistics
Figures
Verification
Claims the paper makes
59 Not checked yet · 18 Own result · 9 Own interpretation · 4 Own method · 2 No basis given · 1 Partly supported · accuracy not yet measured
The cited sources support only part of this claim — read each source’s verdict below.
In the paper
“Previous studies have shown that the gut microbiota metabolizes choline, phosphatidylcholine, and l-carnitine to produce trimethylamine (TMA), which is oxidized in the liver into the proatherogenic metabolite, trimethylamine-N-oxide (TMAO)11–13.”
§ The gut microbiome in atherosclerotic cardiovascular disease > Introduction
What the sources say
- Partly supportedcites [11] Wang, Z. et al. Gut flora metabolism of phosphatidylcholine promotes cardiovascular disease. Nature 472, 57–63 (2011). sourceExperimental — accuracy not yet measured
The Results section describes gut-microbiota-dependent conversion of phosphatidylcholine and choline to TMA, followed by oxidation to TMAO; the Discussion identifies hepatic FMO enzymes and calls TMAO pro-atherogenic. Our copy does not establish l-carnitine as a precursor (searched for “l-carnitine” and “carnitine”), so that part of the claim is not supported by this source. (LLM, conf=0.90)
- Partly supportedcites [12] Tang, W. H. et al. Intestinal microbial metabolism of phosphatidylcholine and cardiovascular risk. N. Engl. J. Med. 368, 1575–1584 (2013). sourceExperimental — accuracy not yet measured
The Discussion states that intestinal microbiota convert the choline moiety of dietary phosphatidylcholine to TMA, which hepatic enzymes convert to TMAO; it also calls TMAO proatherogenic. Our copy does not support the claim’s inclusion of l-carnitine as a precursor. (LLM, conf=0.90)
- Supportedcites [13] Koeth, R. A. et al. Intestinal microbiota metabolism of L-carnitine, a nutrient in red meat, promotes atherosclerosis. Nat. Med. 19, 576–585 (2013). source
The Introduction states that gut microbiota convert choline, the head group of phosphatidylcholine, to TMA, which hepatic enzymes oxidize to proatherogenic TMAO. The Abstract and Discussion also report microbiota-dependent TMA/TMAO production from l-carnitine. (LLM, conf=0.93)
plaindirect- Asserted: passes — The authors put it forward as true.
- Checkable: passes — It can be checked against evidence.
- Load-bearing: passes — The paper’s conclusions depend on it.
- Based: passes — The paper gives a reason why it holds.
- Partly supported
In the paper
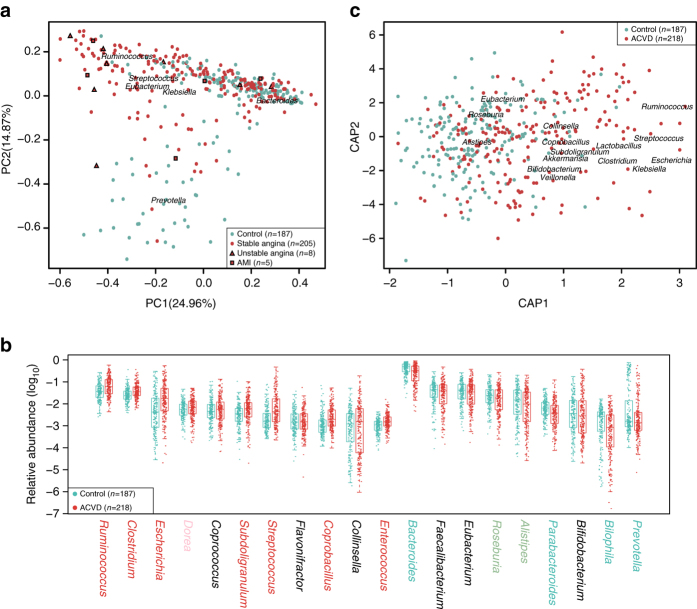
“The ACVD and control samples also showed separation in PCA (principal component analysis) and dbRDA (distance-based redundancy analysis) plots (Fig. 1)”
§ The gut microbiome in atherosclerotic cardiovascular disease > Results > Composition of the ACVD gut microbiome
What the sources say
- Not checked yetcites Fig. 1
plaincorrelationaln = 218- Asserted: passes — The authors put it forward as true.
- Checkable: passes — It can be checked against evidence.
- Load-bearing: passes — The paper’s conclusions depend on it.
- Based: passes — The paper gives a reason why it holds.
A result the paper reports from its own data — it cites no other source for it, so there is none to check. The quote shows it is in the paper.
In the paper
“and, functionally, in the potential for metabolism or transport of several molecules important for cardiovascular health.”
§ The gut microbiome in atherosclerotic cardiovascular disease > Abstract
plaincorrelationaln = 218- Asserted: passes — The authors put it forward as true.
- Checkable: passes — It can be checked against evidence.
- Load-bearing: passes — The paper’s conclusions depend on it.
- Based: passes — The paper gives a reason why it holds.
- The authors state this as an assumption: Stool samples are representative of the gut microbiome.
- Rests on an assumption: The functional potential inferred from metagenomic gene content reflects actual metabolic activity of the gut microbiome.
A result the paper reports from its own data — it cites no other source for it, so there is none to check. The quote shows it is in the paper.
In the paper
“The ACVD gut microbiome deviates from the healthy status by increased abundance of Enterobacteriaceae and Streptococcus spp.”
§ The gut microbiome in atherosclerotic cardiovascular disease > Abstract
plaincorrelationaln = 218- Asserted: passes — The authors put it forward as true.
- Checkable: passes — It can be checked against evidence.
- Load-bearing: passes — The paper’s conclusions depend on it.
- Based: passes — The paper gives a reason why it holds.
- The authors state this as an assumption: Stool samples are representative of the gut microbiome.
In the paper
“The ACVD and control samples were significantly different in multivariate analyses. ACVD status showed a P-value <10−6 in permutational multivariate analysis of variance (PERMANOVA), with or without adjustment for medication (Supplementary Table 1).”
§ The gut microbiome in atherosclerotic cardiovascular disease > Results > Composition of the ACVD gut microbiome
What the sources say
- Not checked yetcites Supplementary Table 1
plaincorrelationaln = 218- Asserted: passes — The authors put it forward as true.
- Checkable: passes — It can be checked against evidence.
- Load-bearing: passes — The paper’s conclusions depend on it.
- Based: passes — The paper gives a reason why it holds.
- The authors state this as an assumption: Stool samples are representative of the gut microbiome.
None of the sources cited for this claim have been checked yet.
In the paper
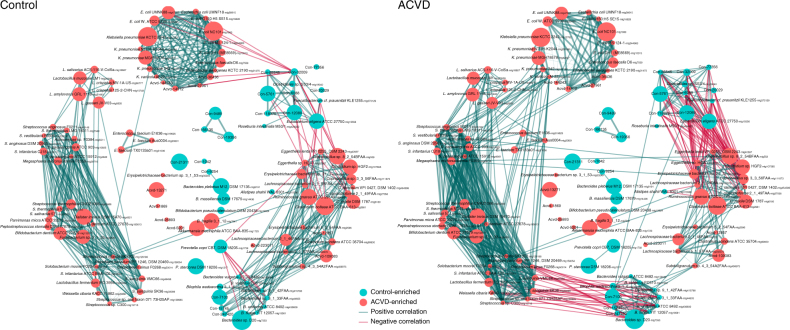
“The abundance of Ruminococcus gnavus, a bacterium previously associated with inflammatory bowel diseases and low gut microbial richness8, 20–22 was higher in ACVD samples than in control samples (q-value <0.05, Fig. 2, Supplementary Data 3).”
§ The gut microbiome in atherosclerotic cardiovascular disease > Results > Microbial strains associated with ACVD
What the sources say
- Not checked yetcites Fig. 2
- Not checked yetcites Supplementary Data 3
plaincorrelational- Asserted: passes — The authors put it forward as true.
- Checkable: passes — It can be checked against evidence.
- Load-bearing: passes — The paper’s conclusions depend on it.
- Based: passes — The paper gives a reason why it holds.
In the paper
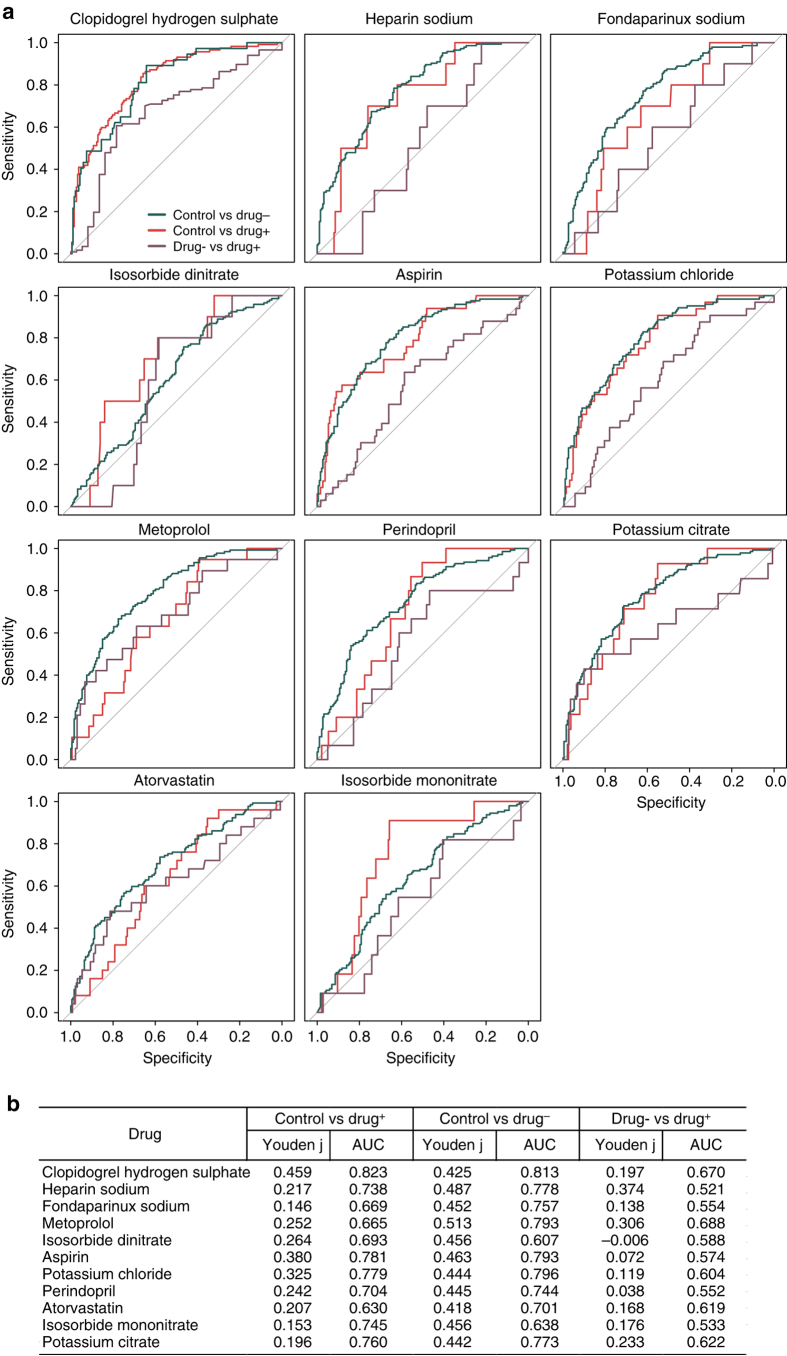
“When two drugs were analyzed together instead of single drug analysis, random-forest classifiers again reached a higher AUC for distinguishing between ACVD patients with no drug treatment and healthy controls, than between ACVD with and without the drugs (Supplementary Data 4).”
§ The gut microbiome in atherosclerotic cardiovascular disease > Results > Influence of drugs on the gut microbiota
What the sources say
- Not checked yetcites Supplementary Data 4
plaincorrelational- Asserted: passes — The authors put it forward as true.
- Checkable: passes — It can be checked against evidence.
- Load-bearing: passes — The paper’s conclusions depend on it.
- Based: passes — The paper gives a reason why it holds.
None of the sources cited for this claim have been checked yet.
In the paper
“Consistent with the genera results (Fig. 1), common members of the gut microbiome such as Bacteroides spp., Prevotella copri, and Alistipes shahii were also relatively depleted in ACVD (q-value <0.05, Fig. 2, Supplementary Data 3).”
§ The gut microbiome in atherosclerotic cardiovascular disease > Results > Microbial strains associated with ACVD
What the sources say
- Not checked yetcites Fig. 2
- Not checked yetcites Supplementary Data 3
plaincorrelational- Asserted: passes — The authors put it forward as true.
- Checkable: passes — It can be checked against evidence.
- Load-bearing: passes — The paper’s conclusions depend on it.
- Based: passes — The paper gives a reason why it holds.
In the paper
“Among the 47 MLGs selected by the ACVD classifier, the MLGs most important for the classifier belonged to Streptococcus vestibularis, E. lenta, A. parvulum, R. gnavus, L. salivarius, E. coli, Lachnospiraceae, and Clostridium nexile (Supplementary Data 3).”
§ The gut microbiome in atherosclerotic cardiovascular disease > Results > Links between the gut microbiome and clinical features of ACVD
What the sources say
- Not checked yetcites Supplementary Data 3
plaincorrelationaln = 405- Asserted: passes — The authors put it forward as true.
- Checkable: passes — It can be checked against evidence.
- Load-bearing: unclear — It is unclear whether the paper’s conclusions depend on it.
- Based: passes — The paper gives a reason why it holds.
None of the sources cited for this claim have been checked yet.
In the paper
“According to further analysis using the reference-genome based method PanPhlAn26, ACVD-enriched bacteria encoding choline-TMA lyase (CutC) included an unclassified Erysipelotrichaceae bacterium, C. nexile, and S. anginosus (Fig. 2, Supplementary Fig. 2a).”
§ The gut microbiome in atherosclerotic cardiovascular disease > Results > Links between the gut microbiome and clinical features of ACVD
What the sources say
- Not checked yetcites Fig. 2
- Not checked yetcites Supplementary Fig. 2a
plaincorrelational- Asserted: passes — The authors put it forward as true.
- Checkable: passes — It can be checked against evidence.
- Load-bearing: unclear — It is unclear whether the paper’s conclusions depend on it.
- Based: passes — The paper gives a reason why it holds.
- It may state two separate claims as one. 28
- Probably not a substantial claim. 13
In the paper
“which was corroborated by abundance differences between the two groups in major genera of the gut microbiome, such as a relative reduction in Bacteroides and Prevotella, and enrichment in Streptococcus and Escherichia in ACVD (Fig. 1b).”
§ The gut microbiome in atherosclerotic cardiovascular disease > Results > Composition of the ACVD gut microbiome
What the sources say
- Not checked yetcites Fig. 1b
plaincorrelationaln = 218- Asserted: passes — The authors put it forward as true.
- Checkable: passes — It can be checked against evidence.
- Load-bearing: passes — The paper’s conclusions depend on it.
- Based: passes — The paper gives a reason why it holds.
It may state two separate claims as one.
In the paper
“For combinations such as either acarbose or atorvastatin, the AUC was lower between ACVD patients treated with the drugs and healthy controls than between ACVD patients without the drugs and healthy controls (Supplementary Data 4), i.e., the medication weakened the disease signal, meaning an even more significant difference would be expected if the cohort was free of medication.”
§ The gut microbiome in atherosclerotic cardiovascular disease > Results > Influence of drugs on the gut microbiota
What the sources say
- Not checked yetcites Supplementary Data 4
plaindirect- Asserted: passes — The authors put it forward as true.
- Checkable: passes — It can be checked against evidence.
- Load-bearing: passes — The paper’s conclusions depend on it.
- Based: passes — The paper gives a reason why it holds.
It may state two separate claims as one.
In the paper
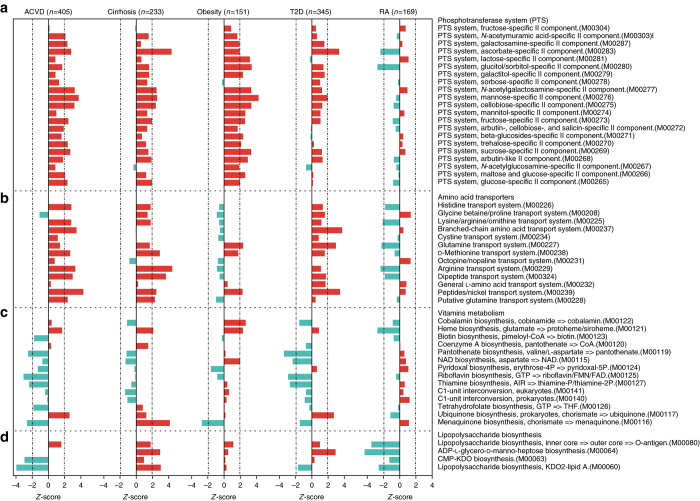
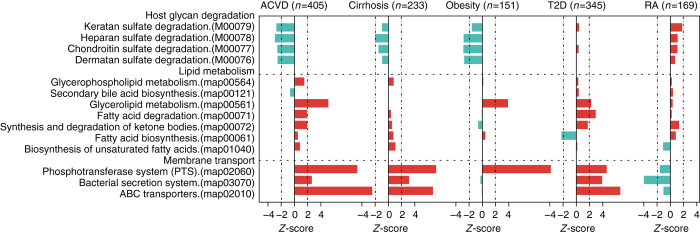
“Consistent with the enrichment of Enterobacteriaceae in ACVD (Figs. 1 and 2), the module comprising genes required for the synthesis of the O-antigen of lipopolysaccharides (LPS) was enriched in ACVD samples, whereas the lipid A synthesis module was relatively depleted, most likely due to a lower level of the otherwise abundant Gram-negative genus Bacteroides (Figs. 1 and 6).”
§ The gut microbiome in atherosclerotic cardiovascular disease > Results > Functional alterations in the ACVD gut microbiome
What the sources say
- Not checked yetcites Figs. 1 and 6
plaincorrelational- Asserted: passes — The authors put it forward as true.
- Checkable: passes — It can be checked against evidence.
- Load-bearing: unclear — It is unclear whether the paper’s conclusions depend on it.
- Based: passes — The paper gives a reason why it holds.
It may state two separate claims as one.
- Rests on an assumption: The functional potential inferred from metagenomic gene content reflects actual metabolic activity of the gut microbiome.
In the paper
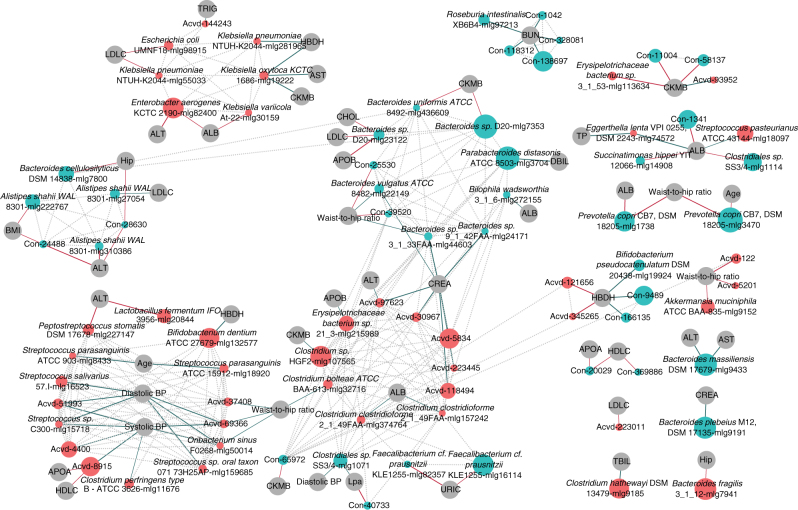
“K. oxytoca that showed increased abundance in ACVD patients, correlated positively with serum levels of aspartate transaminase (AST, a marker for acute myocardial infarction as well as other conditions), α-hydroxybutyrate dehydrogenase (HBDH), and creatine kinase (CKMB).”
§ The gut microbiome in atherosclerotic cardiovascular disease > Results > Links between the gut microbiome and clinical features of ACVD
What the sources say
- Not checked yetcites Fig. 4
plaincorrelational- Asserted: passes — The authors put it forward as true.
- Checkable: passes — It can be checked against evidence.
- Load-bearing: unclear — It is unclear whether the paper’s conclusions depend on it.
- Based: passes — The paper gives a reason why it holds.
It may state two separate claims as one.
None of the sources cited for this claim have been checked yet.
In the paper
“The relative abundances of three MLGs positively correlated with metoprolol use and two MLGs positively correlated with atorvastatin, but none of the MLGs fulfilled the criteria for species annotation (Supplementary Fig. 3, Supplementary Data 3).”
§ The gut microbiome in atherosclerotic cardiovascular disease > Results > Influence of drugs on the gut microbiota
What the sources say
- Not checked yetcites Supplementary Fig. 3
- Not checked yetcites Supplementary Data 3
plaincorrelational- Asserted: passes — The authors put it forward as true.
- Checkable: passes — It can be checked against evidence.
- Load-bearing: passes — The paper’s conclusions depend on it.
- Based: passes — The paper gives a reason why it holds.
It may state two separate claims as one.
None of the sources cited for this claim have been checked yet.
In the paper
“A total of 536 of the MLGs differed significantly in abundance between ACVD and control samples (Wilcoxon-rank sum test, Benjamin–Hochberg q-value <0.05), with 320 of these being more abundant in ACVD samples (Fig. 2, Supplementary Data 3).”
§ The gut microbiome in atherosclerotic cardiovascular disease > Results > Microbial strains associated with ACVD
What the sources say
- Not checked yetcites Fig. 2
- Not checked yetcites Supplementary Data 3
plaincorrelationaln = 405- Asserted: passes — The authors put it forward as true.
- Checkable: passes — It can be checked against evidence.
- Load-bearing: passes — The paper’s conclusions depend on it.
- Based: passes — The paper gives a reason why it holds.
It may state two separate claims as one.
- The authors state this as an assumption: Stool samples are representative of the gut microbiome.
In the paper
“we observed no significant difference between the ACVD and control samples in either gene richness or diversity (Supplementary Fig. 1).”
§ The gut microbiome in atherosclerotic cardiovascular disease > Results > Composition of the ACVD gut microbiome
What the sources say
- Not checked yetcites Supplementary Fig. 1
plainn = 218- Asserted: passes — The authors put it forward as true.
- Checkable: passes — It can be checked against evidence.
- Load-bearing: unclear — It is unclear whether the paper’s conclusions depend on it.
- Based: passes — The paper gives a reason why it holds.
It may state two separate claims as one.
None of the sources cited for this claim have been checked yet.
In the paper
“we observed a reduced potential for the synthesis of tetrahydrofolate and altered potential for homocysteine metabolism in the gut microbiome of ACVD patients compared with controls (Fig. 6, Supplementary Fig. 4a and b).”
§ The gut microbiome in atherosclerotic cardiovascular disease > Results > Functional alterations in the ACVD gut microbiome
What the sources say
- Not checked yetcites Fig. 6
- Not checked yetcites Supplementary Fig. 4a and b
plaincorrelational- Asserted: passes — The authors put it forward as true.
- Checkable: passes — It can be checked against evidence.
- Load-bearing: passes — The paper’s conclusions depend on it.
- Based: passes — The paper gives a reason why it holds.
It may state two separate claims as one.
- Rests on an assumption: The functional potential inferred from metagenomic gene content reflects actual metabolic activity of the gut microbiome.
None of the sources cited for this claim have been checked yet.
In the paper
“The samples from ACVD patients displayed higher potential for transport of simple sugars (phosphotransferase systems (PTS)) and amino acids, whereas the potential for biosynthesis of most vitamins was lower (Figs. 6 and 7, Supplementary Data 6 and 7).”
§ The gut microbiome in atherosclerotic cardiovascular disease > Results > Functional alterations in the ACVD gut microbiome
What the sources say
- Not checked yetcites Figs. 6 and 7
- Not checked yetcites Supplementary Data 6 and 7
plaincorrelational- Asserted: passes — The authors put it forward as true.
- Checkable: passes — It can be checked against evidence.
- Load-bearing: passes — The paper’s conclusions depend on it.
- Based: passes — The paper gives a reason why it holds.
It may state two separate claims as one.
- Rests on an assumption: The functional potential inferred from metagenomic gene content reflects actual metabolic activity of the gut microbiome.
A result the paper reports from its own data — it cites no other source for it, so there is none to check. The quote shows it is in the paper.
In the paper
“Besides the common denominators identified to characterize the gut microbiome in patients with CMDs and cirrhosis, the gut microbiome of each disease also exhibited unique features in functional capacity, and in species and gene compositions.”
§ The gut microbiome in atherosclerotic cardiovascular disease > Discussion
plaincorrelational- Asserted: passes — The authors put it forward as true.
- Checkable: passes — It can be checked against evidence.
- Load-bearing: passes — The paper’s conclusions depend on it.
- Based: passes — The paper gives a reason why it holds.
It may state two separate claims as one.
A result the paper reports from its own data — it cites no other source for it, so there is none to check. The quote shows it is in the paper.
In the paper
“Among the top 50 determining species, the ACVD-enriched MLGs such as S. anginosis, S. vestibularis, and L. salivarius were identified to be most important for the model, while ACVD-depleted MLGs such as F. cf. prausnitzii, Bacteroides cellulosilyticus, R.intestinalis, and MLGs not significantly different in the ACVD cohort were also selected as important features (Supplementary Fig. 9a).”
§ The gut microbiome in atherosclerotic cardiovascular disease > Results > Microbiome-based identification of CMDs and cirrhosis
plaincorrelational- Asserted: passes — The authors put it forward as true.
- Checkable: passes — It can be checked against evidence.
- Load-bearing: passes — The paper’s conclusions depend on it.
- Based: passes — The paper gives a reason why it holds.
It may state two separate claims as one.
In the paper
“In addition to bacteria and archaea, a number of bacteriophages were more abundant or less abundant in the gut microbiome of individuals with ACVD compared to healthy controls (Supplementary Fig. 6), and several of these were also highly enriched in cirrhosis patients.”
§ The gut microbiome in atherosclerotic cardiovascular disease > Results > Functional alterations in the ACVD gut microbiome
What the sources say
- Not checked yetcites Supplementary Fig. 6
plaincorrelational- Asserted: passes — The authors put it forward as true.
- Checkable: passes — It can be checked against evidence.
- Load-bearing: unclear — It is unclear whether the paper’s conclusions depend on it.
- Based: passes — The paper gives a reason why it holds.
It may state two separate claims as one.
In the paper
“The ACVD-based classifier (Fig. 3) contained features such as Streptococcus spp. that were also abundant in the cirrhosis patients, however, a number of Eggerthella MLGs were not enriched in the individuals with cirrhosis (Supplementary Fig. 5).”
§ The gut microbiome in atherosclerotic cardiovascular disease > Results > Functional alterations in the ACVD gut microbiome
What the sources say
- Not checked yetcites Supplementary Fig. 5
plain- Asserted: passes — The authors put it forward as true.
- Checkable: passes — It can be checked against evidence.
- Load-bearing: unclear — It is unclear whether the paper’s conclusions depend on it.
- Based: passes — The paper gives a reason why it holds.
It may state two separate claims as one.
None of the sources cited for this claim have been checked yet.
In the paper
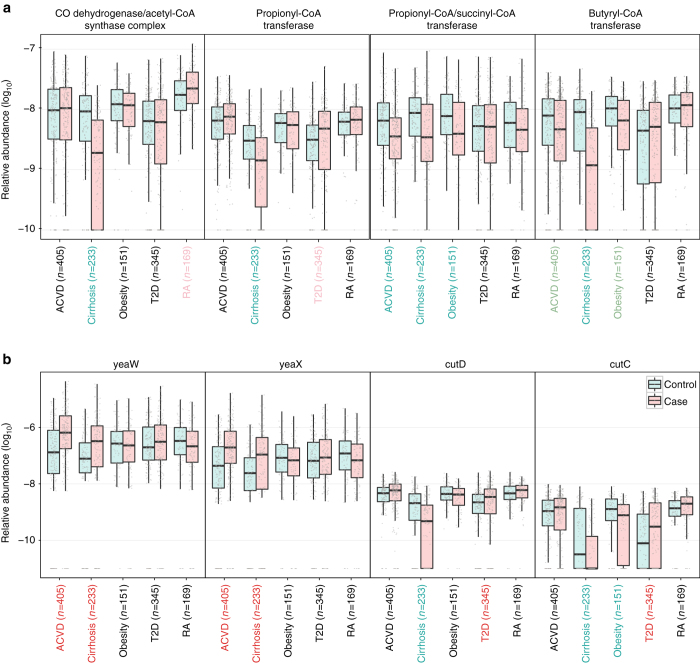
“The potential for the metabolism of glycerolipids and degradation of fatty acids was elevated in ACVD (Fig. 7), whereas the potential for synthesis of the anti-inflammatory short-chain fatty acid (SCFA) butyrate was lower (Fig. 8a).”
§ The gut microbiome in atherosclerotic cardiovascular disease > Results > Functional alterations in the ACVD gut microbiome
What the sources say
- Not checked yetcites Fig. 7
- Not checked yetcites Fig. 8a
plaincorrelational- Asserted: passes — The authors put it forward as true.
- Checkable: passes — It can be checked against evidence.
- Load-bearing: passes — The paper’s conclusions depend on it.
- Based: passes — The paper gives a reason why it holds.
It may state two separate claims as one.
- Rests on an assumption: The functional potential inferred from metagenomic gene content reflects actual metabolic activity of the gut microbiome.
A result the paper reports from its own data — it cites no other source for it, so there is none to check. The quote shows it is in the paper.
In the paper
“By contrast, in patients with RA, we did not observe the striking enrichment of many modules of the PTS, instead only a few modules were enriched in controls compared to cases.”
§ The gut microbiome in atherosclerotic cardiovascular disease > Results > Functional alterations in the ACVD gut microbiome
plainn = 95- Asserted: passes — The authors put it forward as true.
- Checkable: passes — It can be checked against evidence.
- Load-bearing: unclear — It is unclear whether the paper’s conclusions depend on it.
- Based: passes — The paper gives a reason why it holds.
It may state two separate claims as one.
- Rests on an assumption: The functional potential inferred from metagenomic gene content reflects actual metabolic activity of the gut microbiome.
A result the paper reports from its own data — it cites no other source for it, so there is none to check. The quote shows it is in the paper.
In the paper
“We observed that the gut microbiome collectively is less fermentative and more inflammatory in patients with CMDs and liver cirrhosis, in contrast to that of patients with the autoimmune disease RA, suggesting that the restoration of a few members of the healthy gut microbiome might alleviate or at least reduce the risk for multiple CMDs and possibly liver cirrhosis.”
§ The gut microbiome in atherosclerotic cardiovascular disease > Discussion
plaincorrelational- Asserted: passes — The authors put it forward as true.
- Checkable: passes — It can be checked against evidence.
- Load-bearing: passes — The paper’s conclusions depend on it.
- Based: passes — The paper gives a reason why it holds.
It may state two separate claims as one.
In the paper
“Moreover, the majority of E. coli MLGs enriched in individuals with ACVD did not show significant differences between cases and controls within the other diseases (Supplementary Fig. 5), indicating that both common and unique features of the gut microbiome could be identified in ACVD.”
§ The gut microbiome in atherosclerotic cardiovascular disease > Results > Functional alterations in the ACVD gut microbiome
What the sources say
- Not checked yetcites Supplementary Fig. 5
hedged- Asserted: passes — The authors put it forward as true.
- Checkable: passes — It can be checked against evidence.
- Load-bearing: passes — The paper’s conclusions depend on it.
- Based: passes — The paper gives a reason why it holds.
It may state two separate claims as one.
A result the paper reports from its own data — it cites no other source for it, so there is none to check. The quote shows it is in the paper.
In the paper
“A model could also be constructed based on KEGG Orthology (KO) modules using cross-validated group LASSO (Supplementary Fig. 9b).”
§ The gut microbiome in atherosclerotic cardiovascular disease > Results > Microbiome-based identification of CMDs and cirrhosis
hedged- Asserted: passes — The authors put it forward as true.
- Checkable: passes — It can be checked against evidence.
- Load-bearing: fails — The paper’s conclusions may not depend on it.
- Based: passes — The paper gives a reason why it holds.
Probably not a substantial claim. The paper’s conclusions may not depend on it.
None of the sources cited for this claim have been checked yet.
In the paper
“Further, in RA patients modules involved in glutamine and arginine transport and modules involved in LPS biosynthesis were enriched in controls compared to cases, in contrast, modules for host glycan degradation were enriched in RA patients (Figs. 6 and 7, Supplementary Data 6).”
§ The gut microbiome in atherosclerotic cardiovascular disease > Results > Functional alterations in the ACVD gut microbiome
What the sources say
- Not checked yetcites Figs. 6 and 7
- Not checked yetcites Supplementary Data 6
plaincorrelationaln = 95- Asserted: passes — The authors put it forward as true.
- Checkable: passes — It can be checked against evidence.
- Load-bearing: unclear — It is unclear whether the paper’s conclusions depend on it.
- Based: passes — The paper gives a reason why it holds.
It may state two separate claims as one.
- Rests on an assumption: The functional potential inferred from metagenomic gene content reflects actual metabolic activity of the gut microbiome.
None of the sources cited for this claim have been checked yet.
In the paper
“Bacterial DNA has also been detected in atherosclerotic plaques15–17.”
§ The gut microbiome in atherosclerotic cardiovascular disease > Introduction
What the sources say
- Not checked yetcites [15] Ott, S. J. et al. Detection of diverse bacterial signatures in atherosclerotic lesions of patients with coronary heart disease. Circulation 113, 929–937 (2006). source
- Not checked yetcites [16] Koren, O. et al. Human oral, gut, and plaque microbiota in patients with atherosclerosis. Proc. Natl Acad. Sci. USA 108, 4592–4598 (2011). source
- Not checked yetcites [17] Lanter, B. B., Sauer, K. & Davies, D. G. Bacteria present in carotid arterial plaques are found as biofilm deposits which may contribute to enhanced risk of plaque rupture. MBio 5, e01206–e01214 (2014). source
plain- Asserted: passes — The authors put it forward as true.
- Checkable: passes — It can be checked against evidence.
- Load-bearing: fails — The paper’s conclusions may not depend on it.
- Based: passes — The paper gives a reason why it holds.
Probably not a substantial claim. The paper’s conclusions may not depend on it.
A conclusion the paper draws from its own results — it cites no other source for it, so there is none to check. The quote shows it is in the paper.
In the paper
“Although drug treatment represents a confounding factor, ACVD status, and not current drug use, is the major distinguishing feature in this cohort.”
- Also stated in: § Influence of drugs on the gut microbiota · hedged
“Thus, these results suggest that ACVD status, and not current drug use, is the major distinguishing feature in this cohort.”
§ The gut microbiome in atherosclerotic cardiovascular disease > Abstract
plaincorrelational- Asserted: passes — The authors put it forward as true.
- Checkable: passes — It can be checked against evidence.
- Load-bearing: passes — The paper’s conclusions depend on it.
- Based: passes — The paper gives a reason why it holds.
It may state two separate claims as one.
- Also stated in: § Influence of drugs on the gut microbiota · hedged
In the paper
“Folate is known to play a role in cardiovascular disease due to its function in homocysteine metabolism40”
§ The gut microbiome in atherosclerotic cardiovascular disease > Results > Functional alterations in the ACVD gut microbiome
What the sources say
- Not checked yetcites [40] Loria, C. M., Ingram, D. D., Feldman, J. J., Wright, J. D. & Madans, J. H. Serum folate and cardiovascular disease mortality among US men and women. Arch. Intern. Med. 160, 3258–3262 (2000). source
boosteddirect- Asserted: passes — The authors put it forward as true.
- Checkable: passes — It can be checked against evidence.
- Load-bearing: fails — The paper’s conclusions may not depend on it.
- Based: passes — The paper gives a reason why it holds.
Probably not a substantial claim. The paper’s conclusions may not depend on it.
In the paper
“Concomitantly, we noted that the MLG-based classifier had an AUC that was larger than the AUC of 0.63 using TMA lyases only (CutC/D and YeaW/X, Fig. 3), indicating that factors in addition to TMAO are implicated in ACVD.”
§ The gut microbiome in atherosclerotic cardiovascular disease > Results > Links between the gut microbiome and clinical features of ACVD
What the sources say
- Not checked yetcites Fig. 3
hedgedcorrelationaln = 405- Asserted: passes — The authors put it forward as true.
- Checkable: passes — It can be checked against evidence.
- Load-bearing: passes — The paper’s conclusions depend on it.
- Based: passes — The paper gives a reason why it holds.
It may state two separate claims as one.
None of the sources cited for this claim have been checked yet.
In the paper
“Studies comparing individuals with T2D treated or not with metformin identified a higher level of E. coli and a lower level of Intestinibacter in the metformin-treated individuals, while confirming reduced levels of butyrate-producing bacteria such as Roseburia spp., F. prausnitzii, and unnamed Clostridiales in the untreated individuals compared to healthy controls5, 6, 34, 35.”
§ The gut microbiome in atherosclerotic cardiovascular disease > Results > Influence of drugs on the gut microbiota
What the sources say
- Not checked yetcites [5] Karlsson, F. H. et al. Gut metagenome in European women with normal, impaired and diabetic glucose control. Nature 498, 99–103 (2013). source
- Not checked yetcites [6] Forslund, K. et al. Disentangling type 2 diabetes and metformin treatment signatures in the human gut microbiota. Nature 528, 262–266 (2015). source
- Not checked yetcites [34] Zhernakova, A. et al. Population-based metagenomics analysis reveals markers for gut microbiome composition and diversity. Science 352, 565–569 (2016). source
- Not checked yetcites [35] Wu, H. et al. Metformin alters the gut microbiome of individuals with treatment-naive type 2 diabetes, contributing to the therapeutic effects of the drug. Nat. Med. 23, 850–858 (2017). source
plaincorrelational- Asserted: passes — The authors put it forward as true.
- Checkable: passes — It can be checked against evidence.
- Load-bearing: unclear — It is unclear whether the paper’s conclusions depend on it.
- Based: passes — The paper gives a reason why it holds.
It may state two separate claims as one.
A conclusion the paper draws from its own results — it cites no other source for it, so there is none to check. The quote shows it is in the paper.
In the paper
“These results demonstrated profound imbalances in the composition and inter-species relationship in the gut microbiome of ACVD patients as compared to healthy controls.”
§ The gut microbiome in atherosclerotic cardiovascular disease > Results > Microbial strains associated with ACVD
boostedcorrelational- Asserted: passes — The authors put it forward as true.
- Checkable: passes — It can be checked against evidence.
- Load-bearing: passes — The paper’s conclusions depend on it.
- Based: passes — The paper gives a reason why it holds.
It may state two separate claims as one.
A conclusion the paper draws from its own results — it cites no other source for it, so there is none to check. The quote shows it is in the paper.
In the paper
“Still, drug treatment may to varying extent affect the composition of the gut microbiota and thus constitute a confounding factor.”
§ The gut microbiome in atherosclerotic cardiovascular disease > Results > Influence of drugs on the gut microbiota
hedgedconditional- Asserted: passes — The authors put it forward as true.
- Checkable: passes — It can be checked against evidence.
- Load-bearing: fails — The paper’s conclusions may not depend on it.
- Based: fails — The paper may give no reason why it holds.
Probably not a substantial claim. The paper’s conclusions may not depend on it. The paper may give no reason why it holds.
What the paper did — it cites no source for this, so there is none to check. The quote shows it is in the paper.
In the paper
“Fivefold cross-validation was performed on a random forest model (R 3.3.0, randomForest 4.6-12 package) using the MLG abundance profile of the samples.”
§ The gut microbiome in atherosclerotic cardiovascular disease > Methods > Feature selection using RFCV or group LASSO
plain- Asserted: passes — The authors put it forward as true.
- Checkable: passes — It can be checked against evidence.
- Load-bearing: passes — The paper’s conclusions depend on it.
- Based: passes — The paper gives a reason why it holds.
Probably not a substantial claim.
None of the sources cited for this claim have been checked yet.
In the paper
“The 2982 MLG that contained over 100 genes were tested for enrichment or depletion in individuals with ACVD (218 ACVD cases and 187 controls) according to the non-parametric method, Wilcoxon rank-sum test, and controlled for multiple testing (q-value <0.05)55, 60.”
§ The gut microbiome in atherosclerotic cardiovascular disease > Methods > Metagenome-wide association study
What the sources say
- Not checked yetcites [55] Benjamini, Y. & Hochberg, Y. Controlling the false discovery rate: a practical and powerful approach to multiple testing. J. R. Stat. Soc. Series B 57, 289–300 (1995). source
- Not checked yetcites [60] Storey, J. D. A direct approach to false discovery rates. J. R. Stat. Soc. Series B Stat. Methodol. 64, 479–498 (2002). source
plainn = 218- Asserted: passes — The authors put it forward as true.
- Checkable: passes — It can be checked against evidence.
- Load-bearing: passes — The paper’s conclusions depend on it.
- Based: passes — The paper gives a reason why it holds.
Probably not a substantial claim.
A conclusion the paper draws from its own results — it cites no other source for it, so there is none to check. The quote shows it is in the paper.
In the paper
“We observed that the gut microbiome collectively is less fermentative and more inflammatory in patients with CMDs and liver cirrhosis, in contrast to that of patients with the autoimmune disease RA, suggesting that the restoration of a few members of the healthy gut microbiome might alleviate or at least reduce the risk for multiple CMDs and possibly liver cirrhosis.”
§ The gut microbiome in atherosclerotic cardiovascular disease > Discussion
hedgedconditional- Asserted: passes — The authors put it forward as true.
- Checkable: passes — It can be checked against evidence.
- Load-bearing: passes — The paper’s conclusions depend on it.
- Based: passes — The paper gives a reason why it holds.
It may state two separate claims as one.
What the paper did — it cites no source for this, so there is none to check. The quote shows it is in the paper.
In the paper
“CMD/cirrhosis-specific MLGs were also selected by a random forest model, with downsampling to account for the unequal sample size across diseases.”
§ The gut microbiome in atherosclerotic cardiovascular disease > Methods > Feature selection using RFCV or group LASSO
plain- Asserted: passes — The authors put it forward as true.
- Checkable: passes — It can be checked against evidence.
- Load-bearing: fails — The paper’s conclusions may not depend on it.
- Based: passes — The paper gives a reason why it holds.
Probably not a substantial claim. The paper’s conclusions may not depend on it.
In the paper
“Although the gut microbiome of liver cirrhosis, colorectal cancer, RA, and ACVD patients have all showed an increase in the abundance of oral bacteria3, the set of oral bacterial species were, however, observed to differ, and only RA and ACVD have been epidemiologically associated with periodontitis.”
§ The gut microbiome in atherosclerotic cardiovascular disease > Discussion
What the sources say
- Not checked yetcites [3] Wang, J. & Jia, H. Metagenome-wide association studies: fine-mining the microbiome. Nat. Rev. Microbiol. 14, 508–522 (2016). source
plaincorrelational- Asserted: passes — The authors put it forward as true.
- Checkable: passes — It can be checked against evidence.
- Load-bearing: unclear — It is unclear whether the paper’s conclusions depend on it.
- Based: passes — The paper gives a reason why it holds.
It may state two separate claims as one.
In the paper
“All 1250 samples were analyzed in the same manner, eliminating technical biases in MWAS between studies3.”
§ The gut microbiome in atherosclerotic cardiovascular disease > Discussion
What the sources say
- Not checked yetcites [3] Wang, J. & Jia, H. Metagenome-wide association studies: fine-mining the microbiome. Nat. Rev. Microbiol. 14, 508–522 (2016). source
plaindirectn = 1,250- Asserted: passes — The authors put it forward as true.
- Checkable: passes — It can be checked against evidence.
- Load-bearing: passes — The paper’s conclusions depend on it.
- Based: passes — The paper gives a reason why it holds.
It may state two separate claims as one.
What the paper did — it cites no source for this, so there is none to check. The quote shows it is in the paper.
In the paper
“The study was approved by the Medical Ethical Review Committee of the Guangdong General Hospital and the Institutional Review Board at BGI-Shenzhen. Informed consent was obtained from all participants.”
§ The gut microbiome in atherosclerotic cardiovascular disease > Methods > Cohorts and clinical biomarkers for ACVD
plain- Asserted: passes — The authors put it forward as true.
- Checkable: passes — It can be checked against evidence.
- Load-bearing: fails — The paper’s conclusions may not depend on it.
- Based: passes — The paper gives a reason why it holds.
Probably not a substantial claim. The paper’s conclusions may not depend on it. It may state two separate claims as one.
In the paper
“The top-ranked module for the CMDs and liver cirrhosis was the ACVD-microbiome depleted DegS-DegU two component system, which can trigger biofilm formation in response to impeded flagellar rotation49.”
§ The gut microbiome in atherosclerotic cardiovascular disease > Results > Microbiome-based identification of CMDs and cirrhosis
What the sources say
- Not checked yetcites [49] Cairns, L. S., Marlow, V. L., Bissett, E., Ostrowski, A. & Stanley-Wall, N. R. A mechanical signal transmitted by the flagellum controls signalling in Bacillus subtilis. Mol. Microbiol. 90, 6–21 (2013). source
plaindirect- Asserted: passes — The authors put it forward as true.
- Checkable: passes — It can be checked against evidence.
- Load-bearing: fails — The paper’s conclusions may not depend on it.
- Based: passes — The paper gives a reason why it holds.
Probably not a substantial claim. The paper’s conclusions may not depend on it.
In the paper
“PERMANOVA39 was performed on the MLG abundance profile of all samples to assess impact from each of the factors listed (Supplementary Table 2).”
§ The gut microbiome in atherosclerotic cardiovascular disease > Methods > Assessing potential influences of medication
What the sources say
- Not checked yetcites [39] McArdle, B. H. & Anderson, M. J. Fitting multivariate models to community data: a comment on distance-based redundancy analysis. Ecology 82, 290–297 (2001). source
plaincorrelational- Asserted: passes — The authors put it forward as true.
- Checkable: passes — It can be checked against evidence.
- Load-bearing: fails — The paper’s conclusions may not depend on it.
- Based: passes — The paper gives a reason why it holds.
Probably not a substantial claim. The paper’s conclusions may not depend on it.
What the paper did — it cites no source for this, so there is none to check. The quote shows it is in the paper.
In the paper
“Potential influences of medication on the ACVD-associated gut microbiome were analyzed by three complementing methods.”
§ The gut microbiome in atherosclerotic cardiovascular disease > Methods > Assessing potential influences of medication
plain- Asserted: passes — The authors put it forward as true.
- Checkable: passes — It can be checked against evidence.
- Load-bearing: fails — The paper’s conclusions may not depend on it.
- Based: passes — The paper gives a reason why it holds.
Probably not a substantial claim. The paper’s conclusions may not depend on it.
A conclusion the paper draws from its own results — it cites no other source for it, so there is none to check. The quote shows it is in the paper.
In the paper
“Alternatively, the altered microbiome of CMD patients might be a read-out of the systemic inflammatory component of CMDs and cirrhosis, hence illustrating an ongoing interaction between the gut microbiome composition and the inflammatory status of these diseases that is detectable as a CMD/cirrhosis-specific gut microbiome signature.”
§ The gut microbiome in atherosclerotic cardiovascular disease > Discussion
hedgedcorrelational- Asserted: passes — The authors put it forward as true.
- Checkable: passes — It can be checked against evidence.
- Load-bearing: fails — The paper’s conclusions may not depend on it.
- Based: passes — The paper gives a reason why it holds.
Probably not a substantial claim. The paper’s conclusions may not depend on it. It may state two separate claims as one.
A conclusion the paper draws from its own results — it cites no other source for it, so there is none to check. The quote shows it is in the paper.
In the paper
“If so, then the restoration toward a healthy microbiome might involve concomitant anti-inflammatory treatments.”
§ The gut microbiome in atherosclerotic cardiovascular disease > Discussion
hedgedconditional- Asserted: passes — The authors put it forward as true.
- Checkable: fails — It may be too vague to check against evidence.
- Load-bearing: fails — The paper’s conclusions may not depend on it.
- Based: passes — The paper gives a reason why it holds.
Probably not a substantial claim. It may be too vague to check against evidence. The paper’s conclusions may not depend on it. It may state two separate claims as one.
The authors state this as an assumption.
Stool samples are representative of the gut microbiome.
“we sequenced stool samples, representative of the gut microbiome, from 218 individuals with atherosclerotic cardiovascular disease (ACVD) and 187 healthy controls”
The paper relies on this without support.
The functional potential inferred from metagenomic gene content reflects actual metabolic activity of the gut microbiome.
“functionally, in the potential for metabolism or transport of several molecules important for cardiovascular health”
The paper relies on this without support.
Only RA and ACVD have been epidemiologically associated with periodontitis.
“Although the gut microbiome of liver cirrhosis, colorectal cancer, RA, and ACVD patients have all showed an increase in the abundance of oral bacteria3, the set of oral bacterial species were, however, observed to differ, and only RA and ACVD have been epidemiologically associated with periodontitis.”
The paper relies on this without support.
Taurine is important for cardiometabolic health.
“The ACVD-microbiome depleted taurine transport system was also important for this classifier (Supplementary Figs. 2c and 9b, Supplementary Data 6), consistent with the importance of taurine for cardiometabolic health.”
Claims other papers make about this one
Each is checked against this paper’s own text: does it say what the citing paper says it does?
In the citing paper
“The metagenome-wide association study showed that gut microbial enzymes producing TMA were enriched in patients with CAD compared with healthy controls.5”
From Bacteroides vulgatus and Bacteroides dorei Reduce Gut Microbial Lipopolysaccharide Production and Inhibit Atherosclerosis (2018) · cites this paper as [5]
Citations
Cites
Controlling the False Discovery Rate: A Practical and Powerful Approach to Multiple Testing
Benjamini, Y., & Hochberg, Y. (1995) · Journal of the Royal Statistical Society Series B: Statistical Methodology · doi:10.1111/j.2517-6161.1995.tb02031.x · Cited by 109,482
Human gut microbiome viewed across age and geography
Yatsunenko, T., Rey, F. E., Manary, M. J., Trehan, I., Dominguez-Bello, M. G., Contreras, M., Magris, M., Hidalgo, G., Baldassano, R. N., Anokhin, A. P., et al. (2012) · Nature · doi:10.1038/nature11053 · Cited by 7,815
Changes of Intestinal Functions in Liver Cirrhosis
Fukui, H., & Wiest, R. (2016) · Inflammatory Intestinal Diseases · doi:10.1159/000444436 · Cited by 6,820
A metagenome-wide association study of gut microbiota in type 2 diabetes
Qin, J., Li, Y., Cai, Z., Li, S., Zhu, J., Zhang, F., Liang, S., Zhang, W., Guan, Y., Shen, D., et al. (2012) · Nature · doi:10.1038/nature11450 · Cited by 6,762
Self-citationA Direct Approach to False Discovery Rates
Storey, J. D. (2002) · Journal of the Royal Statistical Society Series B: Statistical Methodology · doi:10.1111/1467-9868.00346 · Cited by 5,603
Gut flora metabolism of phosphatidylcholine promotes cardiovascular disease
Wang, Z., Klipfell, E., Bennett, B. J., Koeth, R., Levison, B. S., DuGar, B., Feldstein, A. E., Britt, E. B., Fu, X., Chung, Y.-M., et al. (2011) · Nature · doi:10.1038/nature09922 · Cited by 5,597
KEGG for integration and interpretation of large-scale molecular data sets
Kanehisa, M., Goto, S., Sato, Y., Furumichi, M., & Tanabe, M. (2012) · Nucleic Acids Research · doi:10.1093/nar/gkr988 · Cited by 4,848
Richness of human gut microbiome correlates with metabolic markers
Le Chatelier, E., Nielsen, T., Qin, J., Prifti, E., Hildebrand, F., Falony, G., Almeida, M., Arumugam, M., Batto, J.-M., Kennedy, S., et al. (2013) · Nature · doi:10.1038/nature12506 · Cited by 4,662
Self-citationIntestinal microbiota metabolism of l-carnitine, a nutrient in red meat, promotes atherosclerosis
Koeth, R. A., Wang, Z., Levison, B. S., Buffa, J. A., Org, E., Sheehy, B. T., Britt, E. B., Fu, X., Wu, Y., Li, L., et al. (2013) · Nature Medicine · doi:10.1038/nm.3145 · Cited by 4,386
Self-citationFITTING MULTIVARIATE MODELS TO COMMUNITY DATA: A COMMENT ON DISTANCE-BASED REDUNDANCY ANALYSIS
McArdle, B. H., & Anderson, M. J. (2001) · Ecology · doi:10.1890/0012-9658(2001)082[0290:fmmtcd]2.0.co;2 · Cited by 4,001
Cited by
Sorted by citations
Items 801–900 of 999
Sierra, J. A., Escobar, J. S., Corrales-Agudelo, V., Lara-Guzmán, O. J., Velásquez-Mejía, E. P., Henao‐Rojas, J. C., Caro‐Quintero, A., Vaillant, F. E., & Muñoz-Durango, K. (2022) · Food Research International · doi:10.1016/j.foodres.2022.111949 · Cited by 13
Chen, F., Zuo, K., Fu, Y., Zhu, X., Li, J., Zhong, J., Xu, L., & Yang, X. (2022) · Biomolecules · doi:10.3390/biom12101445 · Cited by 14
Self-citationJia, X., Wu, B., Chen, B.-D., Li, K., Liu, Y., Xu, Y., Wang, J., & Zhang, X. (2022) · Journal of Autoimmunity · doi:10.1016/j.jaut.2022.102958 · Cited by 13
Self-citationChen, X., Cheng, Y., Tian, X., Li, J., Ying, X., Zhao, Q., Wang, M., Liu, Y., Qiu, Y., Yan, X., et al. (2023) · Ecotoxicology and Environmental Safety · doi:10.1016/j.ecoenv.2023.115010 · Cited by 13
Self-citationLei, C., Zhang, X., Chen, E., Lin, L., Zhou, Z., Wang, Z., Liu, T., & Liu, Z. (2023) · Annals of Translational Medicine · doi:10.21037/atm-22-3521 · Cited by 13
Self-citationHuman Gut Microbiota in Heart Failure: Trying to Unmask an Emerging Organ
PARASKEVAIDIS, I. A., Xanthopoulos, A. V., Tsougos, E., & Triposkiadis, F. K. (2023) · Biomedicines · doi:10.3390/biomedicines11092574 · Cited by 13
Gut Microbiota, Atherosclerosis, and Therapeutic Targets
Mantziaris, V., & Kolios, G. C. (2019) · Critical Pathways in Cardiology A Journal of Evidence-Based Medicine · doi:10.1097/hpc.0000000000000187 · Cited by 13
Chen, J., Wang, Q., Hao, Z., Li, Z., Sahu, S. K., Liu, H., & Xiao, L. (2019) · Applied and Environmental Microbiology · doi:10.1128/aem.02465-19 · Cited by 14
Self-citationChen, Z., Wang, X.-K., Hou, X., Ding, F., Kang, Y., Zhang, P., & You, T. (2020) · Journal of Cardiovascular Translational Research · doi:10.1007/s12265-020-10016-5 · Cited by 13
RetractedYu, B., Jin, L., Chen, Z., Nie, W., Chen, L., Ma, Y., Chen, H., Wu, Y., Ma, Y., Chen, J., et al. (2021) · Annals of Translational Medicine · doi:10.21037/atm-21-1315 · Cited by 13
Self-citationLiang, X., Zhang, Z., Lv, Y., Lü, H., Liu, T., Yi, H., Zhao, M., Zhang, L., & Gong, P. (2021) · Foods · doi:10.3390/foods10102374 · Cited by 13
Self-citationArterial Stiffness and Adult Onset Vasculitis: A Systematic Review
Gullo, A. L., Giuffrida, C., Morace, C., Squadrito, G., Lio, P. M. S., Ricciardi, L., Salvarani, C., & Mandraffino, G. (2022) · Frontiers in Medicine · doi:10.3389/fmed.2022.824630 · Cited by 13
Branched-chain amino acids and atherosclerosis: friends or foes?
Grajeda‐Iglesias, C., Rom, O., & Aviram, M. (2018) · Current Opinion in Lipidology · doi:10.1097/mol.0000000000000494 · Cited by 13
The human microbiota is associated with cardiometabolic risk across the epidemiologic transitionPreprint
Fei, N., Bernabé, B. P., Lie, L., Baghdan, D., Bedu-Addo, K., Plange‐Rhule, J., Forrester, T., Lambert, E. V., Bovet, P., Gottel, N., et al. (2019) · bioRxiv (Cold Spring Harbor Laboratory) · doi:10.1101/595934 · Cited by 13
Microbial Metabolites and Cardiovascular Dysfunction: A New Era of Diagnostics and Therapy
Kumar, J. (2025) · Cells · doi:10.3390/cells14161237 · Cited by 14
Chen, Y., Guo, J., Xue, S.-L., Ding, L.-L., Wei, B., & Wen, S. (2025) · Journal of Agricultural and Food Chemistry · doi:10.1021/acs.jafc.5c09903 · Cited by 12
Implications of Gut Microbiota-Derived Metabolites in Neurological Disorders
Dalal, N., Jaiswal, J., Kushwaha, M., Verma, H., Rana, P., Gupta, S., Panwar, R., Janmeda, P., Jain, P., Singh, A. K., et al. (2025) · ACS Chemical Neuroscience · doi:10.1021/acschemneuro.5c00414 · Cited by 12
Cedó, L., Madeira, A., & Caro, P. (2025) · Seminars in Cancer Biology · doi:10.1016/j.semcancer.2025.10.007 · Cited by 14
Gut Microbiota and Atherosclerosis: Integrative Multi-Omics and Mechanistic Insights
He, J. H., Wang, H., Qiu, E., Qi, Q., & Wang, Z. (2025) · Current Atherosclerosis Reports · doi:10.1007/s11883-025-01371-2 · Cited by 14
Strain-level genetic heterogeneity and colonization dynamics drive microbiome therapeutic efficacy
Chen, K., Liu, Y., Rong, J., Dai, N., Xu, C., Li, H., Zhong, L., Wang, B., Ji, Z., Xie, S., et al. (2026) · Cell Host & Microbe · doi:10.1016/j.chom.2026.02.002 · Cited by 12
Self-citationLiu, T., Lu, X., Gao, W., Zhai, Y., Li, H., Li, S., Yang, L., Ma, F., Zhan, Y., & Mao, H. (2022) · Biomedicine & Pharmacotherapy · doi:10.1016/j.biopha.2022.113159 · Cited by 15
Self-citationLiang, X., Chou, O. H. I., & Cheung, B. M. Y. (2023) · Frontiers in Cardiovascular Medicine · doi:10.3389/fcvm.2022.1000478 · Cited by 12
Li, Y., Jiang, X., Chen, J., Hu, Y., Bai, Y., Wang, X., He, L., Wang, Y., Chen, C., & Chen, J. (2023) · Frontiers in Microbiology · doi:10.3389/fmicb.2023.1119959 · Cited by 12
Self-citationMicrobial signature of plaque and gut in acute coronary syndrome
Pisano, E., Bugli, F., Severino, A., Pedicino, D., Sterbini, F. P., Martini, C., Maio, F. D., Vinci, R., Sacconi, A., Canonico, F., et al. (2023) · Scientific Reports · doi:10.1038/s41598-023-41867-y · Cited by 15
Bulygin, I., Shatov, V. M., Rykachevsky, A., Raiko, A., Bernstein, A., Burnaev, E. V., & Gelfand, M. S. (2023) · PeerJ · doi:10.7717/peerj.15838 · Cited by 15
Targeted curation of the gut microbial gene content modulating human cardiovascular disease
Borton, M., Shaffer, M., Hoyt, D. W., Jiang, R., Ellenbogen, J., Purvine, S. O., Nicora, C., Eder, E., Wong, A. R., Smulian, A. G., et al. (2023) · mBio · doi:10.1128/mbio.01511-23 · Cited by 12
Brasino, D. S. K., Speese, S. D., Schilling, K. J., Schutt, C. E., & Barton, M. C. (2024) · Advanced Science · doi:10.1002/advs.202309220 · Cited by 12
Duttaroy, A. K. (2024) · Nutrients · doi:10.3390/nu16213717 · Cited by 14
Microbes in Health and Disease: Human Gut Microbiota
Hu, C., & Shen, H. (2024) · Applied Sciences · doi:10.3390/app142311354 · Cited by 17
Zhang, L., Yin, Y., & Jin, S. (2024) · Microbiological Research · doi:10.1016/j.micres.2024.128037 · Cited by 14
Akhi, R., Lavrinienko, A., Hakula, M., Tjäderhane, L., Hindström, R., Nissinen, A. E. T., Wang, C., AUVINEN, J. P., Kullaa, A. M., Ylöstalo, P., et al. (2025) · Communications Medicine · doi:10.1038/s43856-025-00773-2 · Cited by 12
The Critical Role of Faecalibacterium prausnitzii in Cardiovascular Diseases
Zheng, T., Meng, C., Lv, Z., Wu, C., Zhou, X., & Mao, W. (2025) · Reviews in Cardiovascular Medicine · doi:10.31083/rcm26740 · Cited by 15
Keller, C., Wei, P., Wancewicz, B., Cross, T.-W., Rey, F. E., & Li, L. (2020) · Journal of Mass Spectrometry · doi:10.1002/jms.4625 · Cited by 12
Xu, J., Zhang, Y., Wang, X., Ren, X., & Liu, Y. (2020) · PubMed Central · Cited by 12
Linking gut microbiome to bone mineral density: a shotgun metagenomic dataset from 361 elderly women
Wang, Q., Sun, Q., Li, X., Wang, Z., Zheng, H., Ju, Y., Guo, R., Peng, S., & Jia, H. (2021) · Gigabyte · doi:10.46471/gigabyte.12 · Cited by 12
Self-citationSu, J., Zhao, Q., Zhao, A., Jia, W. P., Zhu, W., Lu, J., & Ma, X. (2021) · Acta Diabetologica · doi:10.1007/s00592-021-01717-7 · Cited by 12
Chen, H., Li, D. H., Jiang, A., Li, X. G., Wu, S. J., Chen, J., Qu, M. J., Qi, X. Q., Dai, J., Zhao, R., et al. (2022) · Marine Life Science & Technology · doi:10.1007/s42995-021-00121-y · Cited by 12
Self-citationDong, S., Wu, C., He, W., Zhong, R., Deng, J., Tao, Y., Zha, F.-R., Liao, Z., Fang, X., & Wei, H. (2022) · Frontiers in Nutrition · doi:10.3389/fnut.2022.934294 · Cited by 13
The first taxonomic and functional characterization of human CAVD-associated microbiota
Curini, L., Alushi, B., Christopher, M. R., Baldi, S., Gloria, L. D., Stefàno, P., Laganà, A., Iannone, L., Grubitzsch, H., Landmesser, U., et al. (2023) · Microbial Cell · doi:10.15698/mic2023.02.791 · Cited by 13
Bamba, H., Singh, G., John, J., Inban, P., Prajjwal, P., Alhussain, H. M., & Marsool, M. D. M. (2024) · Current Problems in Cardiology · doi:10.1016/j.cpcardiol.2024.102470 · Cited by 12
Role of the Endocannabinoidome in Human and Mouse Atherosclerosis
Piscitelli, F., & Silvestri, C. (2019) · Current Pharmaceutical Design · doi:10.2174/1381612825666190826162735 · Cited by 13
Kv, C. R. (2021) · Medicine in Microecology · doi:10.1016/j.medmic.2021.100033 · Cited by 13
Microbiome of Acute Otitis Externa
Kim, S. K., Han, S. J., Hong, S. J., & Hong, S. M. (2022) · Journal of Clinical Medicine · doi:10.3390/jcm11237074 · Cited by 11
Microbiome Classification for Heart Disease Detection
Hodzic, A., & Oudah, M. (2022) · IEEE International Conference on Bioinformatics and Bioengineering (BIBE) · doi:10.1109/bibe55377.2022.00057 · Cited by 11
Gao, K., Yu, X. L., Li, F., Huang, Y., Liu, J., Liu, S., Lu, L., Yang, R., & Wang, C. (2023) · Frontiers in Microbiology · doi:10.3389/fmicb.2023.1202768 · Cited by 12
Self-citationGut microbiota in adults with moyamoya disease: characteristics and biomarker identification
Yu, X., Ge, P., Zhai, Y., Liu, W., Zhang, Q., Ye, X., Liu, X., Wang, R., Zhang, Y., Zhao, J., et al. (2023) · Frontiers in Cellular and Infection Microbiology · doi:10.3389/fcimb.2023.1252681 · Cited by 11
Self-citationHost-microbe tryptophan partitioning in cardiovascular diseases
Russo, M. A., Garaci, E., Frustaci, A., Fini, M., Costantini, C., Oikonomou, V., Nunzi, E., Puccetti, P., & Romani, L. R. (2023) · Pharmacological Research · doi:10.1016/j.phrs.2023.106994 · Cited by 12
Choi, S. I., Kim, N., Choi, Y., Nam, R. H., Jang, J. Y., & Cho, S. (2024) · Journal of Neurogastroenterology and Motility · doi:10.5056/jnm23096 · Cited by 13
Exploring the virome: An integral part of human health and disease
Gholamzad, A., Khakpour, N., Hashemi, S. M. A., Goudarzi, Y., Ahmadi, P., Gholamzad, M., Mohammadi, M., & Gholamzad, M. (2024) · Pathology - Research and Practice · doi:10.1016/j.prp.2024.155466 · Cited by 13
Yang, L., Wu, Y., Yang, J., Li, Y., Zhao, X., Liang, T., Li, L., Jiang, T., Zhang, T., Zhang, J., et al. (2024) · Nutrients · doi:10.3390/nu16172945 · Cited by 11
Self-citationJiang, Y., Wang, Y., Che, L., Yang, S., Zhang, X., Lin, Y., Shi, Y., Zou, N., Wang, S., Zhang, Y., et al. (2024) · Nucleic Acids Research · doi:10.1093/nar/gkae1007 · Cited by 11
Self-citationSex Differences in Gut Microbiota and Their Relation to Arterial Stiffness (MIVAS Study)
Salvado, R., Lugones‐Sánchez, C., Santos‐Mínguez, S., González‐Sánchez, S., Quesada, J. A., Benito, R., Rodríguez‐Sánchez, E., Gómez-Marcos, M. Á., Cunha, P., Hernández‐Rivas, J. M., et al. (2024) · Nutrients · doi:10.3390/nu17010053 · Cited by 12
The association between the gut microbiome and 24-h blood pressure measurements in the SCAPIS study
Lin, Y., Sayols-Baixeras, S., Baldanzi, G., Dekkers, K. F., Hammar, U., Nguyen, D. T., Nielsen, N., Eklund, A. C., Varotsis, G., Holm, J. B., et al. (2025) · Communications Medicine · doi:10.1038/s43856-025-00980-x · Cited by 12
Non-pharmacological Strategies Against Systemic Inflammation: Molecular Basis and Clinical Evidence
Pinto, R. D., Pietropaoli, D., Monaco, A., Desideri, G., Ferri, C., & Grassi, D. (2020) · Current Pharmaceutical Design · doi:10.2174/1381612826666200403122600 · Cited by 11
Thomas, A. M., Asnicar, F., Kroemer, G., & Segata, N. (2021) · Applied and Environmental Microbiology · doi:10.1128/aem.00471-21 · Cited by 11
Dietary Patterns, Gut Microbiota Remodeling, and Cardiometabolic Disease
Guiducci, L., Nicolini, G., & Forini, F. (2023) · Metabolites · doi:10.3390/metabo13060760 · Cited by 15
Systems biology in inflammatory bowel diseases: on the way to precision medicine
Dovrolis, N. (2019) · Annals of Gastroenterology · doi:10.20524/aog.2019.0373 · Cited by 11
Probiotics alleviate cognitive dysfunction associated with neuroinflammation in cardiac surgery.
Yu, W., Gao, D., Wang, Z., Wen, J., Peng, X., Zhao, A., Li, C., & Qi, S. (2019) · Europe PMC (PubMed Central) · Cited by 12
Soybean Oil Modulates the Gut Microbiota Associated with Atherogenic Biomarkers
Korach-Rechtman, H., Rom, O., Mazouz, L., Freilich, S., Jeries, H., Hayek, T., Aviram, M., & Kashi, Y. (2020) · Microorganisms · doi:10.3390/microorganisms8040486 · Cited by 10
Mehmood, K., Moin, A., Hussain, T., Rizvi, S. M. D., Gowda, D., Shakil, S., & Kamal, M. (2021) · Folia Microbiologica · doi:10.1007/s12223-021-00926-5 · Cited by 11
Unlocking the Gut-Cardiac Axis: A Paradigm Shift in Cardiovascular Health
Akshay, A., Gasim, R. W., Ali, T. E., Kumar, Y. S., & Hassan, A. (2023) · Cureus · doi:10.7759/cureus.51039 · Cited by 10
Chen, H., Zhang, L., Li, Y., Meng, X., Chi, Y., & Liu, M. (2024) · Aging and Disease · doi:10.14336/ad.2024.0538 · Cited by 11
Gao, C., Wei, J., Lu, C., Wang, L., Dong, D. F., & Sun, M. (2024) · Gut Microbes · doi:10.1080/19490976.2024.2404141 · Cited by 11
Wang, T., Wu, H., Shi, X., Dai, M., & Liu, Y. (2024) · The International Journal of Biochemistry & Cell Biology · doi:10.1016/j.biocel.2024.106678 · Cited by 10
Wu, Y., Li, Z., Shi, L., Zhu, Y., Wang, Y., Yan, N., Yang, Y., He, S., & Li, J. (2024) · Ecotoxicology and Environmental Safety · doi:10.1016/j.ecoenv.2024.117383 · Cited by 10
Self-citationOneNet—One network to rule them all: Consensus network inference from microbiome data
Champion, C., Momal, R., Chatelier, E. L., Sola, M., Mariadassou, M., & Berland, M. (2024) · PLoS Computational Biology · doi:10.1371/journal.pcbi.1012627 · Cited by 14
Nai, S., Song, J., Su, W., & Liu, X. (2025) · Genes · doi:10.3390/genes16020208 · Cited by 12
Self-citationAssociation of gut microbiota and immunometabolic profiles with ischemic stroke severity
Pilon, C. R. S., Guadagnini, D., Assalin, H. B., Magro, D. O., Oliveira, E. S., Alborghetti, M. R., Sforça, M. L., Rocco, S. A., Sartoratto, A., Santos, A., et al. (2025) · Scientific Reports · doi:10.1038/s41598-025-97432-2 · Cited by 11
Yin, G., Yu, T. Y., Lian, C., Li, Y., Liu, D., Li, H., Zhou, H., Yin, P., & Yao, S. (2025) · Advanced Healthcare Materials · doi:10.1002/adhm.202404993 · Cited by 10
Bulut, S. D., Döndaş, H. A., Çelebioğlu, H. U., Sansano, J. M., & Döndaş, N. Y. (2025) · Probiotics and Antimicrobial Proteins · doi:10.1007/s12602-025-10613-3 · Cited by 13
Integrating metagenomics and cultivation unveils oral phage diversity and potential impact on hosts
Jie, Z., Liang, H., Meng, Y., Zhang, J., Zhang, T., Li, W., Lin, X., Hu, T., Han, M., Liang, W., et al. (2025) · npj Biofilms and Microbiomes · doi:10.1038/s41522-025-00773-z · Cited by 12
Self-citationJiménez-Arroyo, C., Molinero, N., & Moreno-Arribas, M. V. (2025) · Advances in Nutrition · doi:10.1016/j.advnut.2025.100520 · Cited by 10
Atherosclerosis and trimethylamine-N-oxide — the gut microbiota potential
Григорьева, И. Н. (2022) · Russian Journal of Cardiology · doi:10.15829/1560-4071-2022-5038 · Cited by 12
Lewis, C., Sellak, H., Sawan, M. A., Joseph, G., Darby, T. M., VanInsberghe, D., Naudin, C. R., Archer, D. R., Jones, R. M., & Taylor, W. R. (2023) · FASEB BioAdvances · doi:10.1096/fba.2022-00121 · Cited by 10
Chen, G., Wang, Z., Song, W., Liao, Y., Wang, X., Chen, C., Ming, J., Cui, J., & Xu, K. (2023) · European Journal of Pharmacology · doi:10.1016/j.ejphar.2023.175800 · Cited by 10
Ahmad, A. F., Caparros-Martin, J. A., Gray, N., Lodge, S., Wist, J., Lee, S., O’Gara, F., Dwivedi, G., & Ward, N. C. (2023) · Physiological Genomics · doi:10.1152/physiolgenomics.00072.2023 · Cited by 11
Characterizing the Native Microbiome Using Next-Generation Sequencing of Bilateral ‘Aseptic’ Knees
Borsinger, T. M., Torchia, M. T., Malskis, B. S., Levy, B. A., Werth, P. M., & Moschetti, W. E. (2023) · The Journal of Arthroplasty · doi:10.1016/j.arth.2023.11.002 · Cited by 10
Emerging tools for uncovering genetic and transcriptomic heterogeneities in bacteria
Liao, Y. H. (2024) · Biophysical Reviews · doi:10.1007/s12551-023-01178-y · Cited by 9
Oynotkinova, O. S., Nikonov, E. L., Demidova, T. Y., Baranov, A. P., Kryukov, E. V., Иванович, Д. Е., & Karavashkina, E. A. (2020) · Terapevticheskii arkhiv · doi:10.26442/00403660.2020.09.000784 · Cited by 14
Gut microbiota and hypertension
Kotrova, A., Shishkin, A. N., Ермоленко, Е. И., Александровна, С. Д., & Воловникова, В. А. (2021) · Arterial’naya Gipertenziya (Arterial Hypertension) · doi:10.18705/1607-419x-2020-26-6-620-628 · Cited by 10
Stott, K. J., Phillips, B., Parry, L., & May, S. (2021) · Bioscience Reports · doi:10.1042/bsr20204113 · Cited by 10
Microbiome of Unilateral Chronic Rhinosinusitis: A Controlled Paired Analysis
Park, S. C., Park, I., Lee, J. S., Park, S. M., Kang, S. H., Hong, S.-M., Byun, S., Jung, Y. G., & Hong, S. J. (2021) · International Journal of Environmental Research and Public Health · doi:10.3390/ijerph18189878 · Cited by 9
History of Diverticulitis and Risk of Incident Cardiovascular Disease in Men: A Cohort Study
Tam, I., Liu, P., Ma, W., Cao, Y., Jovani, M., Wu, K., Rimm, E. B., Strate, L. L., Giovannucci, E. L., & Chan, A. T. (2021) · Digestive Diseases and Sciences · doi:10.1007/s10620-021-06949-9 · Cited by 9
Giménez, V. M. M., Mikusic, N. L. R., Lee, H. J., Menéndez, S. G., Choi, M. R., & Manucha, W. A. (2022) · Biochemical Pharmacology · doi:10.1016/j.bcp.2022.115213 · Cited by 10
Li, J., Huang, P., Cheng, W., & Niu, Q. (2022) · Food Science & Nutrition · doi:10.1002/fsn3.3046 · Cited by 10
Self-citationSzabó, H., Piroska, M., Hernyes, A., Zoldi, L., Juhász, J., Ligeti, B., Makra, N., Szabó, D., Bikov, A., Kunos, L., et al. (2022) · Applied Sciences · doi:10.3390/app122211484 · Cited by 10
Hidi, L., Kovács, G. I., Szabó, D., Makra, N., Pénzes, K., Juhász, J., Sótonyi, P., & Ostorházi, E. (2022) · Frontiers in Cellular and Infection Microbiology · doi:10.3389/fcimb.2022.1056319 · Cited by 10
Evolving Technologies in Gastrointestinal Microbiome Era and Their Potential Clinical Applications
Ajayi, A., Jolaiya, T. F., & Smith, S. I. (2020) · Journal of Clinical Medicine · doi:10.3390/jcm9082565 · Cited by 10
Subclinical Vascular Damage: Current Insights and Future Potential
Mattioli, A. V., Coppi, F., Manenti, A., & Farinetti, A. (2021) · Vascular Health and Risk Management · doi:10.2147/vhrm.s242636 · Cited by 10
Gut microbiome metabolites as key actors in atherosclerosis co-depression disease
Liao, X.-X., Wu, X., Zhou, Y.-L., Li, J., Wen, Y.-L., & Zhou, J. (2022) · Frontiers in Microbiology · doi:10.3389/fmicb.2022.988643 · Cited by 10
Self-citationXu, M., Lu, C. C., Hu, Y., Zhang, M., Shen, J., Liu, C., Lü, Q., & Liu, R. (2023) · Food Science and Human Wellness · doi:10.26599/fshw.2022.9250230 · Cited by 10
Mateu-Fabregat, J., Mostafa, H. M. A., Sánchez-Giménez, R., Peiró, Ó. M., Bonet, G., Carrasquer, A., Fragkiadakis, G. A., Bardajı́, A., Bulló, M., & Papandreou, C. (2024) · Nutrients · doi:10.3390/nu16071062 · Cited by 9
Masiá, M., García, J. A., García‐Abellán, J., Padilla, S., Fernández‐González, M., Agulló, V., Gosalbes, M. J., Ruíz-Pérez, S., Mascarell, P., Botella, Á., et al. (2024) · The Journal of Infectious Diseases · doi:10.1093/infdis/jiae243 · Cited by 9
Metagenomic analysis reveals altered gut virome and diagnostic potential in pancreatic cancer
Zhang, P., Shi, H., Guo, R., Li, L., Guo, X., Yang, H., Chang, D., Cheng, Y., Zhao, G., Li, S., et al. (2024) · Journal of Medical Virology · doi:10.1002/jmv.29809 · Cited by 9
Self-citationLiu, H., Feng, S., Tang, M., Tian, R., & Zhang, S. (2024) · Reviews in Cardiovascular Medicine · doi:10.31083/j.rcm2511395 · Cited by 9
Su, G., Huang, P., Liu, D., Xing, G., Guo, R., Li, S., Fan, S., Cheng, L., Yan, Q., & Yang, W. (2024) · Microbiology Spectrum · doi:10.1128/spectrum.02182-24 · Cited by 11
Self-citationLin, Z., Li, T.-Z., Huang, F., Wu, M., Zhu, L., Zhou, Y., Ming, Y., Lu, Z., Peng, W., Gao, F., et al. (2025) · MedComm · doi:10.1002/mco2.70044 · Cited by 9
Gut microbiota and atrial cardiomyopathy
Sun, T., Song, B., & Li, B. (2025) · Frontiers in Cardiovascular Medicine · doi:10.3389/fcvm.2025.1541278 · Cited by 10
Jiang, R., Kountz, D. J., Zhang, L., & Krzycki, J. A. (2025) · Journal of Biological Chemistry · doi:10.1016/j.jbc.2025.108524 · Cited by 9
Liu, Y., Wu, Q., Shao, J., Mei, Y., Zhang, J., Xu, Q., & Mao, L. (2025) · Frontiers in Immunology · doi:10.3389/fimmu.2025.1568722 · Cited by 9
Metadata
- Authors
- Jie, Z., Xia, H., Zhong, S.-L., Feng, Q., Li, S., Liang, S., Zhong, H., Liu, Z., Gao, Y., Zhao, H., Zhang, D., Su, Z., Fang, Z., Lan, Z., Li, J., Xiao, L., Li, J., Li, R., Li, X., Li, F., Ren, H., Huang, Y., Peng, Y., Li, G., Wen, B., Dong, B., Chen, J.-Y., Geng, Q.-S., Zhang, Z.-W., Yang, H., Wang, J., Wang, J., Zhang, X., Madsen, L., Brix, S., Ning, G., Xu, X., Liu, X., Hou, Y., Jia, H., He, K., & Kristiansen, K.
- Affiliations
- BGI Group (China) (CN)
- Chinese PLA General Hospital (CN)
- Chinese Academy of Medical Sciences & Peking Union Medical College (CN)
- Technical University of Denmark (DK)
- Shanghai Jiao Tong University (CN)
- Corresponding author
- Jia, Huijue
- He, Kunlun
- Kristiansen, Karsten
- ORCID
- Jie, Zhuye
- Feng, Qiang
- Li, Shenghui
- Liang, Suisha
- Zhong, Huanzi
- Liu, Zhipeng
- Zhao, Hui
- Zhang, Dongya
- Su, Zheng
- Fang, Zhiwei
- Li, Junhua
- Xiao, Liang
- Li, Jun
- Li, Ruijun
- Li, Xiaoping
- Ren, Huahui
- Huang, Yan
- Peng, Yangqing
- Li, Guanglei
- Wen, Bo
- Dong, Bo
- Yang, Huanming
- Wang, Jian
- Wang, Jun
- Zhang, Xuan
- Madsen, Lise
- Brix, Susanne
- Ning, Guang
- Xu, Xun
- Liu, Xin
- Hou, Yong
- Jia, Huijue
- He, Kunlun
- Kristiansen, Karsten
- Venue
- Nature Communications
- Published
- 2017-10-10
- Volume
- 8
- Issue
- 1
- Pages
- 845-845
- ISSN
- 2041-1723 (ISSN-L)
- PMC
- PMC5635030
- OpenAlex
- W2761865284
- Semantic Scholar
- bbbdec858cf2aa4e8dc28515da9ceed20fc5f668
- Cited by
- 1,638
- References
- 65
- Citations by year
- 2026: 134 · 2025: 197 · 2024: 252 · 2023: 202 · 2022: 232 · 2021: 235 · 2020: 193 · 2019: 125 · 2018: 57 · 2017: 4
- FWCI
- 42.76
- Type
- journal article
- Language
- en
- Open access
- gold
- doi.org
- Locations
- Nature Communications (publishedVersion, cc-by)
- Europe PMC (PubMed Central) (publishedVersion, cc-by)
- PubMed Central (publishedVersion, cc-by)
- PubMed (publishedVersion)
- Research at the University of Copenhagen (University of Copenhagen) (publishedVersion, cc-by)
- Digital Commons@Becker (Washington University School of Medicine) (submittedVersion)
- RePEc: Research Papers in Economics (submittedVersion)
- DOAJ (DOAJ: Directory of Open Access Journals) (submittedVersion, cc-by-sa)
- DOAJ (DOAJ: Directory of Open Access Journals) (submittedVersion)
- Technical University of Denmark, DTU Orbit (Technical University of Denmark, DTU) (submittedVersion, cc-by)
- Funders
- National Natural Science Foundation of China (81373486, 81673514)
- Government of Jiangxi Province
- Fundo para o Desenvolvimento das Ciências e da Tecnologia
- National Key Research and Development Program of China
- Topics
- Life Sciences › Biochemistry, Genetics and Molecular Biology › Molecular Biology › Gut microbiota and health
- Health Sciences › Dentistry › Periodontics › Oral microbiology and periodontitis research
- Health Sciences › Medicine › Public Health, Environmental and Occupational Health › Nutritional Studies and Diet
- Keywords
- gut microbiota, atherosclerotic cardiovascular disease, Enterobacteriaceae, Streptococcus, metagenome-wide association study, stool microbiome, cardiovascular health, cardiometabolic disease, obesity, type 2 diabetes, liver cirrhosis, rheumatoid arthritis, microbial metabolism
- MeSH terms
- Gastrointestinal Microbiome, Fermentation, Humans, Inflammation, Liver Cirrhosis, Case-Control Studies, Atherosclerosis, Metagenome, Genome-Wide Association Study, Metagenomics
About these checks
Registry, retraction, Cites and statistics results are computed, not judged, with one exception: a printed reference that no index lists is read once by a model before it counts as a citation error. Claims are extracted by a model and kept only when their quote appears verbatim in the text; each cited source is then checked, with a model’s help, for whether it says what the claim relies on. Those verdicts can be wrong — read the claim’s quote and the cited source before relying on one.
A language model drew the claims from the paper on 2026-10-10, under version 3 of the claim definition (model deepseek-v4.1-flash, prompt extract-v3).
A second model labelled each claim on 2026-10-10 (model jev-1.13-20260917, definition revision gold-guideline-v0.2).
Cited sources are checked with a language model’s help (gpt-6-sol).
Statistics and arithmetic are recomputed, not judged.
Confidence bands are shown only for fields calibrated on our annotated test set. None is calibrated yet, so no band is shown.
What counts as a claim ›How we measure confidence ›How we check this ›
Are you an author, or do you see a problem with this page? Request a review
