

The DOI matches its Crossref record; 37 of the 37 references it cites were found in a registry or an index.
Super-radiance reveals infinite-range dipole interactions through a nanofiber
Open accessAbstract
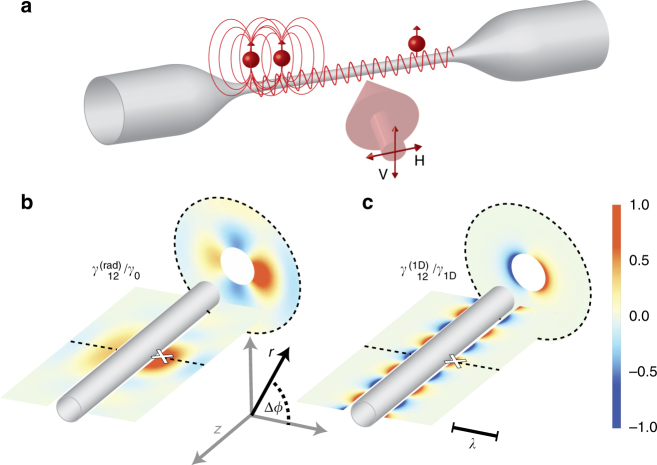
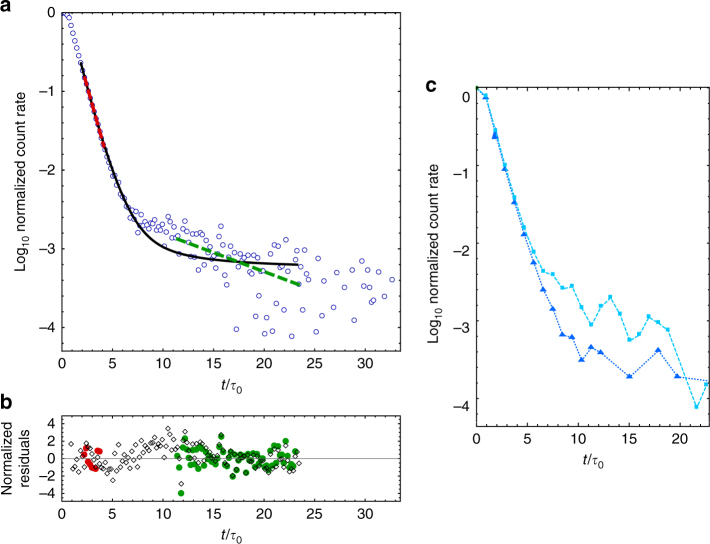
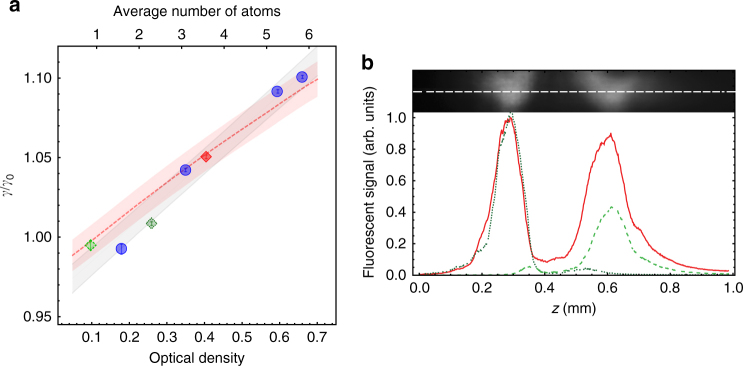
Abstract Atoms interact with each other through the electromagnetic field, creating collective states that can radiate faster or slower than a single atom, i.e., super- and sub-radiance. When the field is confined to one dimension it enables infinite-range atom–atom interactions. Here we present the first report of infinite-range interactions between macroscopically separated atomic dipoles mediated by an optical waveguide. We use cold 87 Rb atoms in the vicinity of a single-mode optical nanofiber (ONF) that coherently exchange evanescently coupled photons through the ONF mode. In particular, we observe super-radiance of a few atoms separated by hundreds of resonant wavelengths. The same platform allows us to measure sub-radiance, a rarely observed effect, presenting a unique tool for quantum optics. This result constitutes a proof of principle for collective behavior of macroscopically delocalized atomic states, a crucial element for new proposals in quantum information and many-body physics.
Overview
The claims and statistics of this paper haven’t been checked yet.
Run the check — free, no account needed. It reads the open-access text and checks the sources it cites.
Integrity signals
Registry
Cites
Statistics
Figures
Verification
Claims the paper makes
The claims and statistics of this paper haven’t been checked yet.
Run the check — free, no account needed. It reads the open-access text and checks the sources it cites.
Claims other papers make about this one
Each is checked against this paper’s own text: does it say what the citing paper says it does?
In the citing paper
“Those authors cited theoretical work (Solano et al., 2017) in support of the “tantalizing possibility” that the physiological arrangement of MTs in axons could magnify the collective interaction “to an extremely long range.””
From Microtubule-stabilizer epothilone B delays anesthetic-induced unconsciousness in rats (2024) · cites this paper as Solano et al., 2017
Self-check
Percentages, sums and reported differences re-computed from the paper’s own numbers.
The self-check needs the paper’s full text.
Citations
Cites
Coherence in Spontaneous Radiation Processes
Dicke, R. H. (1954) · Physical Review · doi:10.1103/physrev.93.99 · Cited by 7,445
Kimble, H. J. (2008) · Nature · doi:10.1038/nature07127 · Cited by 6,023
Lodahl, P., Mahmoodian, S., Stobbe, S., Rauschenbeutel, A., Schneeweiß, P., Volz, J., Pichler, H., & Zoller, P. (2017) · Nature · doi:10.1038/nature21037 · Cited by 1,643
Dicke quantum phase transition with a superfluid gas in an optical cavity
Baumann, K., Guerlin, C., Brennecke, F., & Esslinger, T. (2010) · Nature · doi:10.1038/nature09009 · Cited by 1,530
Non-local propagation of correlations in quantum systems with long-range interactions
Richerme, P., Gong, Z., Lee, A., Senko, C., Smith, J., Foss‐Feig, M., Michalakis, S., Gorshkov, A. V., & Monroe, C. R. (2014) · Nature · doi:10.1038/nature13450 · Cited by 764
Nanophotonic quantum phase switch with a single atom
Tiecke, T. G., Thompson, J. D., de Leon, N. P., Liu, L. R., Vuletić, V., & Lukin, M. D. (2014) · Nature · doi:10.1038/nature13188 · Cited by 562
Quantum spin dynamics and entanglement generation with hundreds of trapped ions
Bohnet, J. G., Sawyer, B. C., Britton, J. W., Wall, M. L., Rey, A. M., Foss-Feig, M., & Bollinger, J. J. (2016) · Science · doi:10.1126/science.aad9958 · Cited by 546
Superradiance for Atoms Trapped along a Photonic Crystal Waveguide
Goban, A., Hung, C.-L., Hood, J. D., Yu, S., Muniz, J. A., Painter, O. J., & Kimble, H. J. (2015) · Physical Review Letters · doi:10.1103/physrevlett.115.063601 · Cited by 540
Photon-Mediated Interactions Between Distant Artificial Atoms
van Loo, A. F., Fedorov, A., Lalumière, K., Sanders, B. C., Blais, A., & Wallraff, A. J. (2013) · Science · doi:10.1126/science.1244324 · Cited by 536
A steady-state superradiant laser with less than one intracavity photon
Bohnet, J., Chen, Z., Weiner, J. M., Meiser, D., Holland, M., & Thompson, J. K. (2012) · Nature · doi:10.1038/nature10920 · Cited by 530
Research works printed but not linked: 3
- Solano, P. et al. in Advances In Atomic, Molecular, and Optical Physics Vol. 66 (eds Arimondo, E., Lin, C. C. & Yelin, S. F.) 439–505 (Academic Press, New York, 2017).
- Asenjo-Garcia, A., Moreno-Cardoner, M., Albrecht, A., Kimble, H. J. & Chang, D. E. Exponential improvement in photon storage fidelities using subradiance and selective radiance in atomic arrays. Phys. Rev. X 7, 031024 (2017).
- O’Connor, D. & Phillips, D. Time-Correlated Single Photon Counting (Academic Press, London, 1984).
Cited by
Sorted by citations
Items 101–200 of 247
Light Harvesting Enhanced by Quantum Ratchet States
Werren, N., Brown, W. J., & Gauger, E. M. (2023) · PRX Energy · doi:10.1103/prxenergy.2.013002 · Cited by 15
Dissimilar collective decay and directional emission from two quantum emitters
Solano, P., Barberis-Blostein, P., & Sinha, K. (2023) · Physical Review A · doi:10.1103/physreva.107.023723 · Cited by 15
Aamir, M. A., Castillo-Moreno, C., Sundelin, S., Biznárová, J., Scigliuzzo, M., Patel, K. E., Osman, A., Lozano, D. P., Strandberg, I., & Gasparinetti, S. (2022) · Physical Review Letters · doi:10.1103/physrevlett.129.123604 · Cited by 14
Collective quantum beats from distant multilevel emitters
Lee, A., Han, H. S., Fatemi, F. K., Rolston, S. L., & Sinha, K. (2023) · Physical Review A · doi:10.1103/physreva.107.013701 · Cited by 14
Elfving, V. E., Das, S., & Sørensen, A. S. (2019) · Physical Review A · doi:10.1103/physreva.100.053843 · Cited by 14
Olmos, B., Buonaiuto, G., Schneeweiß, P., & Lesanovsky, I. (2020) · Physical Review A · doi:10.1103/physreva.102.043711 · Cited by 14
Efficiently coupled microring circuit for on-chip cavity QED with trapped atoms
Chang, T.-H., Zhou, X., Zhu, M. Y., Fields, B. M., & Hung, C.-L. (2020) · Applied Physics Letters · doi:10.1063/5.0023464 · Cited by 15
Quantum Mpemba Effect from Non-Normal Dynamics
Longhi, S. (2025) · Entropy · doi:10.3390/e27060581 · Cited by 13
Atom-light interactions using optical nanofibres—a perspective
Li, W., Brown, D., Vylegzhanin, A., Shahrabifarahani, Z., Raj, A., Du, J., & Chormaic, S. N. (2024) · Journal of Physics Photonics · doi:10.1088/2515-7647/ad3d19 · Cited by 13
Comparison of three approaches to light scattering by dilute cold atomic ensembles
Sokolov, I. M., & Guerin, W. (2019) · Journal of the Optical Society of America B · doi:10.1364/josab.36.002030 · Cited by 13
Creation of nonclassical states of light in a chiral waveguide
Kleinbeck, K., Busche, H., Stiesdal, N., Hofferberth, S., Mølmer, K., & Büchler, H. P. (2023) · Physical Review A · doi:10.1103/physreva.107.013717 · Cited by 13
Photon-induced atom recoil in collectively interacting planar arrays
Suresh, D. A., & Robicheaux, F. (2021) · Physical Review A · doi:10.1103/physreva.103.043722 · Cited by 11
Spectral asymmetry of atoms in the van der Waals potential of an optical nanofiber
Patterson, B. D., Solano, P., Julienne, P. S., Orozco, L. A., & Rolston, S. L. (2018) · Physical Review A · doi:10.1103/physreva.97.032509 · Cited by 12
Stimulated Emission of Superradiant Atoms in Waveguide Quantum Electrodynamics
Asaoka, R., Gea-Banacloche, J. R., Tokunaga, Y., & Koshino, K. (2022) · Physical Review Applied · doi:10.1103/physrevapplied.18.064006 · Cited by 11
Bound states in the continuum in subwavelength emitter arrays
de Paz, M. B., & Huidobro, P. A. (2023) · Physical Review Research · doi:10.1103/physrevresearch.5.033108 · Cited by 11
Qubit-photon corner states in all dimensions
Feiguin, A. E., García‐Ripoll, J. J., & González-Tudela, A. (2020) · Physical Review Research · doi:10.1103/physrevresearch.2.023082 · Cited by 12
Bragg condition for scattering into a guided optical mode
Olmos, B., Liedl, C., Lesanovsky, I., & Schneeweiß, P. (2021) · Physical Review A · doi:10.1103/physreva.104.043517 · Cited by 11
Wang, X., Zhu, Y., Jin, T., Ou, W., Ou, X., & Zhang, J. (2022) · Chip · doi:10.1016/j.chip.2022.100018 · Cited by 11
Concentrated subradiant modes in a one-dimensional atomic array coupled with chiral waveguides
Yang, M., Wang, L., Wu, X., Xiao, H., Yu, D., Yuan, L., & Chen, X. (2022) · Physical Review A · doi:10.1103/physreva.106.043717 · Cited by 10
Quantum Brain Dynamics: Optical and Acoustic Super-Radiance via a Microtubule
Nishiyama, A., Tanaka, S., & Tuszyński, J. A. (2024) · Foundations · doi:10.3390/foundations4020019 · Cited by 12
Cavity-mediated collective emission from steady-state subradiance
Kim, K.-Y., Lee, J., Jeon, W. B., Park, D. H., Park, S. I., Song, J. D., Lee, C., & Kim, J. (2025) · Nature Communications · doi:10.1038/s41467-025-61629-w · Cited by 10
Jen, H. H. (2025) · Quantum Science and Technology · doi:10.1088/2058-9565/adbb86 · Cited by 11
Waveguide Quantum Electrodynamics: Tryptophans Entangled with Water as Data Qubits in a Microtubule
Nishiyama, A., Tanaka, S., & Tuszyński, J. A. (2025) · Dynamics · doi:10.3390/dynamics5010007 · Cited by 10
Fayard, N., Ferrier-Barbut, I., Browaeys, A., & Greffet, J. (2023) · Physical Review A · doi:10.1103/physreva.108.023116 · Cited by 10
Wu, C.-C., Lin, K.-T., Handayana, I. G. N. Y., Chien, C.-H., Goswami, S., Lin, G.-D., Chen, Y.-C., & Jen, H. H. (2024) · Physical Review Research · doi:10.1103/physrevresearch.6.013159 · Cited by 10
Nanotrappy: An open-source versatile package for cold-atom trapping close to nanostructures
Berroir, J., Bouscal, A., Urvoy, A., Ray, T., & Laurat, J. (2022) · Physical Review Research · doi:10.1103/physrevresearch.4.013079 · Cited by 11
Repulsive vacuum-induced forces on a magnetic particle
Sinha, K. (2018) · Physical Review A · doi:10.1103/physreva.97.032513 · Cited by 10
Chuang, Y.-T., & Hsu, L. (2024) · The Journal of Chemical Physics · doi:10.1063/5.0192704 · Cited by 9
Carollo, F., & Lesanovsky, I. (2024) · Physical Review Letters · doi:10.1103/physrevlett.133.150401 · Cited by 9
Super- and subradiant dynamics of quantum emitters mediated by atomic matter waves
Kim, Y., Lanuza, A., & Schneble, D. (2024) · Nature Physics · doi:10.1038/s41567-024-02676-w · Cited by 10
Magic-wavelength nanofiber-based two-color dipole trap with sub- λ / 2 spacing
Pache, L., Cordier, M., Letellier, H., Schemmer, M., Schneeweiß, P., Volz, J., & Rauschenbeutel, A. (2025) · Physical Review A · doi:10.1103/89l1-dys4 · Cited by 9
Qi, X., Jau, Y., & Deutsch, I. (2018) · Physical Review A · doi:10.1103/physreva.97.033829 · Cited by 10
Optical interpretation of linear-optics superradiance and subradiance
Asselie, S., Cipris, A., & Guerin, W. (2022) · Physical Review A · doi:10.1103/physreva.106.063712 · Cited by 9
Parallel fabrication of silica optical microfibers and nanofibers
Fang, H., Xie, Y., Yuan, Z., Cai, D., Zhang, J., Guo, X., & Tong, L. (2024) · Light Advanced Manufacturing · doi:10.37188/lam.2024.020 · Cited by 9
Weakly invasive metrology: quantum advantage and physical implementations
Perarnau-Llobet, M., Malz, D., & Cirac, J. I. (2021) · Quantum · doi:10.22331/q-2021-04-28-446 · Cited by 9
Lokesh, M., Nalupurackal, G., Roy, S., Chakraborty, S., Goswami, J., Gunaseelan, M., Chowdhury, I. U., Bhallamudi, V. P., Mahapatra, P. S., & Roy, B. (2023) · Optics Express · doi:10.1364/oe.481722 · Cited by 9
Tunable photon scattering by an atom dimer coupled to a band edge of a photonic crystal waveguide
Song, G., Wang, L.-X., Zhang, J.-X., & Wei, H. (2025) · Physical Review A · doi:10.1103/physreva.111.023707 · Cited by 8
Shlesinger, I., Senellart, P., Lanco, L., & Greffet, J. (2020) · Optica · doi:10.1364/optica.396223 · Cited by 8
Asymmetric comb waveguide for strong interactions between atoms and light
Fayard, N., Bouscal, A., Berroir, J., Urvoy, A., Ray, T., Mahapatra, S., Kemiche, M., Levenson, J. A., Greffet, J., Bencheikh, K., et al. (2022) · Optics Express · doi:10.1364/oe.475162 · Cited by 9
Generating scalable graph states in an atom-nanophotonic interface
Chien, C.-H., Goswami, S., Wu, C.-C., Hiew, W. S., Chen, Y.-C., & Jen, H. H. (2024) · Quantum Science and Technology · doi:10.1088/2058-9565/ad33ad · Cited by 8
Delay-induced spontaneous dark-state generation from two distant excited atoms
Alvarez-Giron, W., Solano, P., Sinha, K., & Barberis-Blostein, P. (2024) · Physical Review Research · doi:10.1103/physrevresearch.6.023213 · Cited by 12
Jain, K., Ruks, L., Kien, F. L., & Busch, T. (2024) · Physical Review Research · doi:10.1103/physrevresearch.6.033311 · Cited by 8
Probing Surface-Bound Atoms with Quantum Nanophotonics
Hümmer, D., Romero‐Isart, O., Rauschenbeutel, A., & Schneeweiß, P. (2021) · Physical Review Letters · doi:10.1103/physrevlett.126.163601 · Cited by 8
Super- and sub-radiance from two-dimensional resonant dipole-dipole interactions
Jen, H. H. (2019) · Scientific Reports · doi:10.1038/s41598-019-42285-9 · Cited by 9
Su, D., Liu, R., Ji, Z., Qi, X., Song, Z., Zhao, Y., Xiao, L., & Jia, S. (2019) · New Journal of Physics · doi:10.1088/1367-2630/ab172e · Cited by 8
Bustamante, C. M., Gadea, E. D., Todorov, T. N., & Scherlis, D. A. (2022) · The Journal of Physical Chemistry Letters · doi:10.1021/acs.jpclett.2c02795 · Cited by 7
Atomic excitation trapping in dissimilar chirally coupled atomic arrays
Handayana, I. G. N. Y., Wu, C.-C., Goswami, S., Chen, Y.-C., & Jen, H. H. (2024) · Physical Review Research · doi:10.1103/physrevresearch.6.013320 · Cited by 7
Superradiant phase transition in a large interacting driven atomic ensemble in free space
Ruostekoski, J. (2024) · Optica Quantum · doi:10.1364/opticaq.537927 · Cited by 7
Dimer chains in waveguide quantum electrodynamics
Mirza, I. M., Hoskins, J. G., & Schotland, J. C. (2020) · Optics Communications · doi:10.1016/j.optcom.2020.125427 · Cited by 8
Collective single excitation dynamics in a chirally coupled atomic chain
Jen, H. H. (2020) · Journal of Physics B Atomic Molecular and Optical Physics · doi:10.1088/1361-6455/aba9ae · Cited by 7
Strong and long-range radiative interaction between resonant transitions
Ying, L., Mattei, M. S., Liu, B., Zhu, S.-Y., Goldsmith, R. H., & Yu, Z. (2022) · Physical Review Research · doi:10.1103/physrevresearch.4.013118 · Cited by 7
Measurement and simulation of atomic motion in nanoscale optical trapping potentials
Markussen, S. B., Appel, J., Østfeldt, C., Béguin, J.-B., Polzik, E. S., & Müller, J. H. (2020) · Applied Physics B · doi:10.1007/s00340-020-07424-5 · Cited by 6
Crossover from a delocalized to localized atomic excitation in an atom–waveguide interface
Jen, H. H., & You, J.-S. (2021) · Journal of Physics B Atomic Molecular and Optical Physics · doi:10.1088/1361-6455/abf6b7 · Cited by 7
Samimi, S., & Golshan, M. M. (2022) · Physical Review A · doi:10.1103/physreva.105.053702 · Cited by 7
Optical Properties of Concentric Nanorings of Quantum Emitters
Scheil, V., Holzinger, R., Moreno-Cardoner, M., & Ritsch, H. (2023) · Nanomaterials · doi:10.3390/nano13050851 · Cited by 7
Correlated dephasing noise in single-photon scattering
Ramos, T., & García‐Ripoll, J. J. (2018) · New Journal of Physics · doi:10.1088/1367-2630/aae73b · Cited by 8
Giant Superbunching Emission from Mesoscopic Perovskite Emitter Clusters
Qiang, G., Cai, H., Rasmita, A., He, R., Zhou, L., Ru, S., Cai, X., Liu, X., & Gao, W. (2023) · Advanced Optical Materials · doi:10.1002/adom.202302038 · Cited by 6
Dynamical beats of short pulses in waveguide QED
Su, D., Jiang, Y. H., Cardenas-Lopez, S., Asenjo-Garcı́a, A., Solano, P., Orozco, L. A., & Zhao, Y. (2023) · Physical Review Research · doi:10.1103/physrevresearch.5.l042041 · Cited by 6
Phonon superradiance with time delays from collective giant atoms
Guo, A.-L., Zhu, L.-T., Guo, G., Lin, Z., Li, C., & Tu, T. (2024) · Physical Review A · doi:10.1103/physreva.109.033711 · Cited by 6
Lesanovsky, I., Olmos, B., Guerin, W., & Kaiser, R. (2019) · Physical Review A · doi:10.1103/physreva.100.021401 · Cited by 6
High-efficiency coupling of single quantum emitters into hole-tailored nanofibers
Wang, X., Zhang, P., Li, G., & Zhang, T. (2021) · Optics Express · doi:10.1364/oe.420243 · Cited by 5
Three-dimensional programming of nanolaser arrays through a single optical microfiber
Song, D. I., Yu, A., Samutpraphoot, P., Lee, J., Kim, M., Park, B. J., Sipahigil, A., & Kim, M. (2022) · Optica · doi:10.1364/optica.471715 · Cited by 6
Coherent perfect absorption accompanying subnatural narrowing by vacuum-induced coupling
Wu, Z., Li, J., & Wu, Y. (2024) · Physical Review A · doi:10.1103/physreva.110.033722 · Cited by 5
Frontiers in Quantum Antennas: Theoretical Foundations, Practical Applications, and Future Outlook
Abohmra, A., Zubair, M. F., Rehman, M. U., Abbas, H. T., Imran, M. A., & Abbasi, Q. H. (2025) · IEEE Open Journal of Antennas and Propagation · doi:10.1109/ojap.2025.3545596 · Cited by 5
N scaling of large-sample collective decay in inhomogeneous ensembles
Stryzhenko, S., Bruns, A., & Peters, T. (2024) · Physical Review Research · doi:10.1103/physrevresearch.6.013091 · Cited by 5
Modified dipole-dipole interactions in the presence of a nanophotonic waveguide
Svendsen, M. B. M., & Olmos, B. (2023) · Quantum · doi:10.22331/q-2023-08-22-1091 · Cited by 5
Green's functions of and emission into discrete anisotropic and hyperbolic baths
Ruks, L., & Busch, T. (2022) · Physical Review Research · doi:10.1103/physrevresearch.4.023044 · Cited by 5
Chiral-coupling-assisted refrigeration in trapped ions
Chen, C., Wang, Y.-C., Wang, C.-C., & Jen, H. H. (2023) · Journal of Physics B Atomic Molecular and Optical Physics · doi:10.1088/1361-6455/acc709 · Cited by 5
Composite Picosecond Control of Atomic States through a Nanofiber Interface
Ma, Y., Liu, R., Ji, L., Qiu, L., Su, D., Zhao, Y., Yao, N., Fang, W., & Wu, S. (2023) · Physical Review Applied · doi:10.1103/physrevapplied.20.024041 · Cited by 5
Asselie, S., Nazon, J.-M., Caldani, R., Roux-Spitz, C., & Guerin, W. (2025) · Physical Review A · doi:10.1103/lcx8-k7b7 · Cited by 4
Zhang, L., Yang, F., Mølmer, K., & Pohl, T. (2025) · Optica Quantum · doi:10.1364/opticaq.545710 · Cited by 4
Selective Collective Emission from a Dense Atomic Ensemble Coupled to a Nanophotonic Resonator
Zhou, X., Suresh, D. A., Robicheaux, F., & Hung, C.-L. (2025) · Physical Review Letters · doi:10.1103/cdd5-r7h4 · Cited by 4
The atomic damping basis and the collective decay of interacting two-level atoms
Alvarez-Giron, W., & Barberis-Blostein, P. (2020) · Journal of Physics A Mathematical and Theoretical · doi:10.1088/1751-8121/abb1e2 · Cited by 4
Optical precursors in waveguide quantum electrodynamics
Cardenas-Lopez, S., Solano, P., Orozco, L. A., & Asenjo-Garcı́a, A. (2023) · Physical Review Research · doi:10.1103/physrevresearch.5.013133 · Cited by 4
Asgarnezhad-Zorgabad, S. (2021) · Scientific Reports · doi:10.1038/s41598-021-82909-7 · Cited by 4
Javanainen, J. (2020) · Optik · doi:10.1016/j.ijleo.2020.164792 · Cited by 4
Photon-induced correlations of quantum systems via an excitation exchange operator
Shuker, R., & Koganov, G. A. (2021) · Laser Physics Letters · doi:10.1088/1612-202x/abf242 · Cited by 4
Decoherence and collective effects of quantum emitters near a medium at criticality
D'Angelis, F. M., Pinheiro, F. A., & Impens, F. (2019) · Physical review. B./Physical review. B · doi:10.1103/physrevb.99.195451 · Cited by 4
Suppression of quantum correlations in a clean-disordered atom-nanophotonic interface
Handayana, I. G. N. Y., Tsao, Y.-L., & Jen, H. H. (2025) · Physical Review Research · doi:10.1103/7ywr-kd8y · Cited by 3
Liu, Y., Sun, H., & Lin, L. (2025) · PhotoniX · doi:10.1186/s43074-025-00167-6 · Cited by 3
Effects of environment correlations on the onset of collective decay in waveguide QED
Angel, A. D., Solano, P., & Barberis-Blostein, P. (2023) · Physical Review A · doi:10.1103/physreva.108.013703 · Cited by 3
Chung, S.-H., Handayana, I. G. N. Y., Tsao, Y.-L., Wu, C.-C., Lin, G.-D., & Jen, H. H. (2024) · Physical Review Research · doi:10.1103/physrevresearch.6.023232 · Cited by 3
How to describe collective decay of uncoupled modes in the input–output formalism
Propp, T. B. (2022) · Journal of the Optical Society of America B · doi:10.1364/josab.468251 · Cited by 3
Characteristics of 1D ordered arrays of optical centers in solid-state photonics
Kling, T., & Hosseini, M. (2023) · Journal of Physics Photonics · doi:10.1088/2515-7647/acccc3 · Cited by 3
State carving in a chirally-coupled atom-nanophotonic cavity
Hiew, W. S., & Jen, H. H. (2023) · New Journal of Physics · doi:10.1088/1367-2630/acf518 · Cited by 3
Chirality-assisted enhancement of tripartite entanglement in waveguide QED
Patrick, L., Arshad, U., Guo, D., & Mirza, I. (2024) · Scientific Reports · doi:10.1038/s41598-024-61043-0 · Cited by 3
Cheng, H., & Nie, W. (2024) · Communications in Theoretical Physics · doi:10.1088/1572-9494/ad4f6f · Cited by 3
Spatial coherence from Nd3+ quantum emitters mediated by a plasmonic chain
Fernández‐Martínez, J., Carretero‐Palacios, S., Sánchez-García, L., Bravo‐Abad, J., Molina, P., van Hoof, N., Ramírez, M. O., Rivas, J. G., & Bausá, L. E. (2021) · Optics Express · doi:10.1364/oe.433080 · Cited by 3
Dipole-dipole interactions through a lens
Olivera, A., Sinha, K., & Solano, P. (2022) · Physical Review A · doi:10.1103/physreva.106.013703 · Cited by 3
Laser frequency stabilization in sub-nanowatt level using nanofibers
Su, D.-Q., Liu, R., Zhang, C.-B., Ji, Z., Zhao, Y., Xiao, L., & Jia, S. (2018) · Journal of Physics D Applied Physics · doi:10.1088/1361-6463/aae2f8 · Cited by 3
Phase-space methods for many-body quantum optics
Guardiola-Navarrete, E., Cardenas-Lopez, S., & Asenjo-Garcı́a, A. (2025) · Advances in atomic, molecular, and optical physics · doi:10.1016/bs.aamop.2025.04.003 · Cited by 2
Ferromagnetic traps for quasicontinuous operation of optical nanofiber interfaces
Liu, R., Wu, J. B., Jiang, Y. H., Zhao, Y., & Wu, S. (2025) · Physical Review Applied · doi:10.1103/413r-dn5p · Cited by 2
Wiest, M. C., & Puniani, A. S. (2025) · Computational and Structural Biotechnology Journal · doi:10.1016/j.csbj.2025.09.016 · Cited by 7
Two-photon superradiance and subradiance
Xie, W., Mirza, I. M., & Schotland, J. C. (2025) · Physical Review A · doi:10.1103/dbny-pjqc · Cited by 2
Controlling excitation localization in waveguide QED systems
Lee, C.-Y., Lin, K.-T., Lin, G.-D., & Jen, H. H. (2025) · Physical Review Research · doi:10.1103/2256-6x36 · Cited by 2
Controlling radiative properties of circular atomic arrays through nanofiber guided modes
Jaimes, J. J., Chormaic, S. N., & Brion, E. (2025) · Physical Review A · doi:10.1103/91kf-xl7p · Cited by 2
Time-delayed collective dynamics in waveguide QED and bosonic quantum networks
Barahona-Pascual, C., Jiang, H., Santos, A. C., & García‐Ripoll, J. J. (2025) · Quantum Science and Technology · doi:10.1088/2058-9565/ae2291 · Cited by 6
Optical Vortex Harmonic Generation Enabled by Confinement-Induced Photonic Spin–Orbit Coupling
Ha, C. K., Kim, E. M., Moon, K. J., & Kang, M. S. (2025) · Nano Letters · doi:10.1021/acs.nanolett.5c04527 · Cited by 2
Subwavelength resolution using the near field of quantum emitters
Kolkıran, A. (2024) · Optics Letters · doi:10.1364/ol.514768 · Cited by 2
Mirror-mediated ultralong-range atomic dipole–dipole interactions
Furtak-Wells, N., Dawson, B., Mann, T., Jose, G., & Beige, A. (2024) · Optical and Quantum Electronics · doi:10.1007/s11082-024-07194-w · Cited by 2
Metadata
- Authors
- Solano, P., Barberis-Blostein, P., Fatemi, F. K., Orozco, L. A., & Rolston, S. L.
- Affiliations
- National Institute of Standards and Technology (US)
- Joint Quantum Institute (US)
- DEVCOM Army Research Laboratory (US)
- Corresponding author
- Solano, P.
- ORCID
- Solano, P.
- Venue
- Nature Communications
- Published
- 2017-11-30
- Volume
- 8
- Issue
- 1
- Pages
- 1857-1857
- ISSN
- 2041-1723 (ISSN-L)
- PMC
- PMC5707363
- OpenAlex
- W2729354929
- Cited by
- 247
- References
- 37
- Citations by year
- 2026: 17 · 2025: 36 · 2024: 32 · 2023: 27 · 2022: 30 · 2021: 26 · 2020: 33 · 2019: 26 · 2018: 19 · 2017: 1
- FWCI
- 10.60
- Type
- journal article
- Language
- en
- Open access
- gold
- doi.org
- Locations
- Nature Communications (publishedVersion, cc-by)
- PubMed Central (publishedVersion, cc-by)
- PubMed (publishedVersion)
- arXiv (Cornell University) (submittedVersion)
- DOAJ (DOAJ: Directory of Open Access Journals) (submittedVersion, cc-by-sa)
- arXiv (Cornell University)
- Funders
- National Science Foundation (1430094, 1307416)
- U.S. Department of Commerce
- Joint Quantum Institute (PHY-1430094, 70NANB16H168)
- National Institute of Standards and Technology (PHY-1430094, 70NANB16H168)
- Office of the Secretary of Defense
- Topics
- Physical Sciences › Physics and Astronomy › Atomic and Molecular Physics, and Optics › Quantum optics and atomic interactions
- Physical Sciences › Physics and Astronomy › Atomic and Molecular Physics, and Optics › Cold Atom Physics and Bose-Einstein Condensates
- Physical Sciences › Physics and Astronomy › Atomic and Molecular Physics, and Optics › Strong Light-Matter Interactions
- Keywords
- superradiance, optical nanofibers, optical waveguides, cold rubidium atoms, evanescent coupling, collective atomic states, quantum information
About these checks
Registry, retraction, Cites and statistics results are computed, not judged, with one exception: a printed reference that no index lists is read once by a model before it counts as a citation error. Claims are extracted by a model and kept only when their quote appears verbatim in the text; each cited source is then checked, with a model’s help, for whether it says what the claim relies on. Those verdicts can be wrong — read the claim’s quote and the cited source before relying on one.
Statistics and arithmetic are recomputed, not judged.
Confidence bands are shown only for fields calibrated on our annotated test set. None is calibrated yet, so no band is shown.
What counts as a claim ›How we measure confidence ›How we check this ›
Are you an author, or do you see a problem with this page? Request a review
