

The DOI matches its Crossref record; 70 of the 70 references it cites were found in a registry or an index.
Hippocampal oxytocin receptors are necessary for discrimination of social stimuli
Open accessAbstract
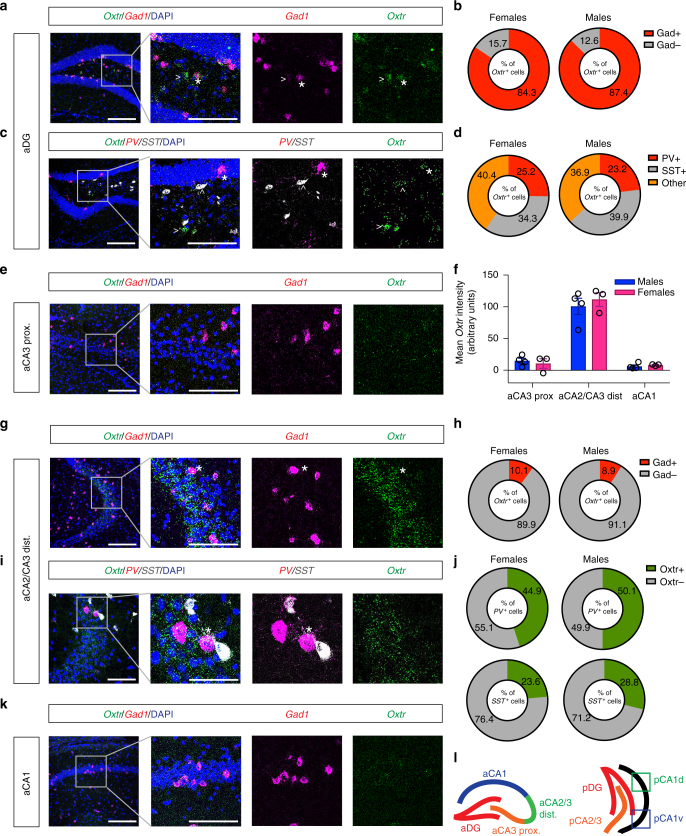
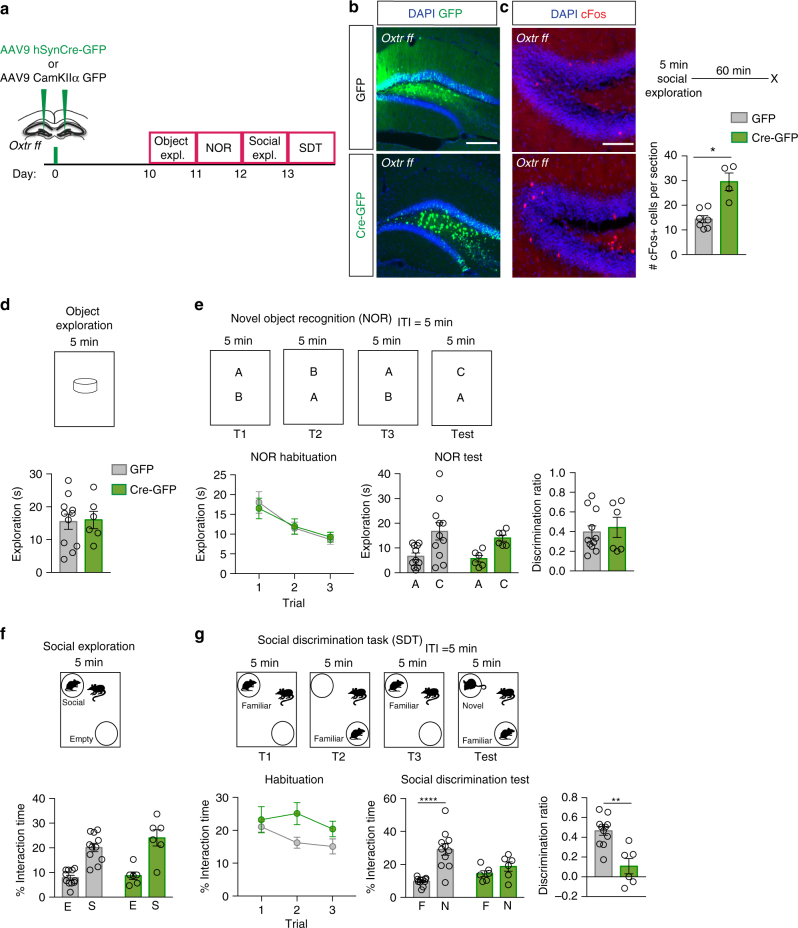
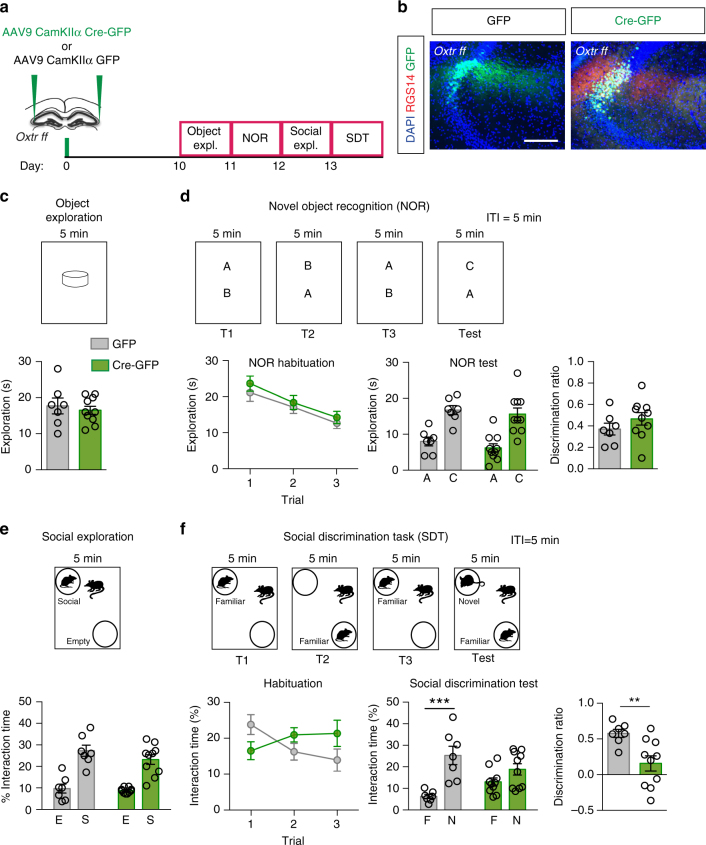
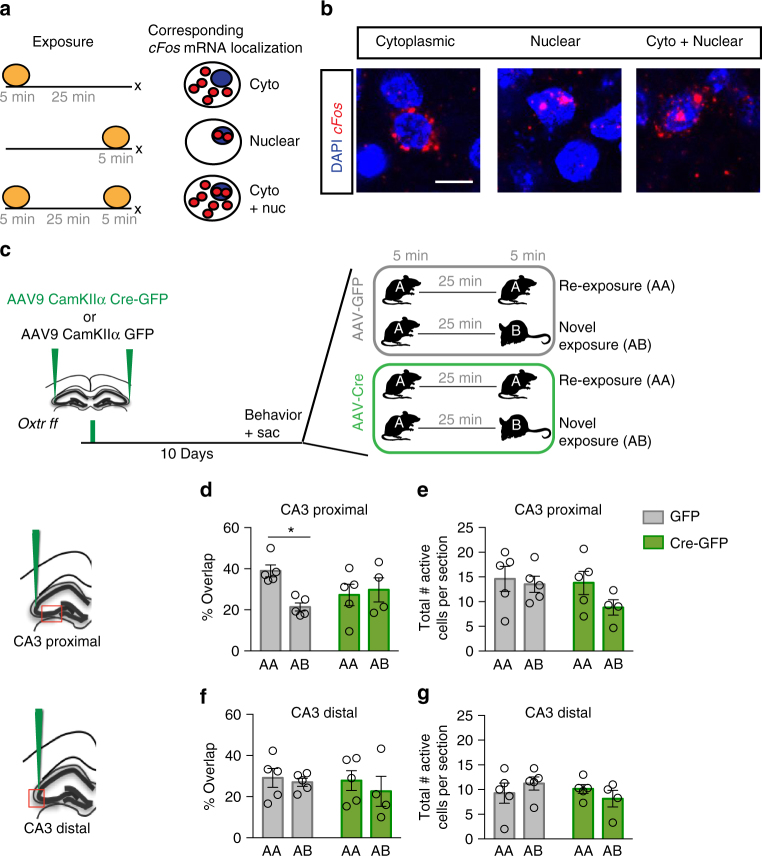
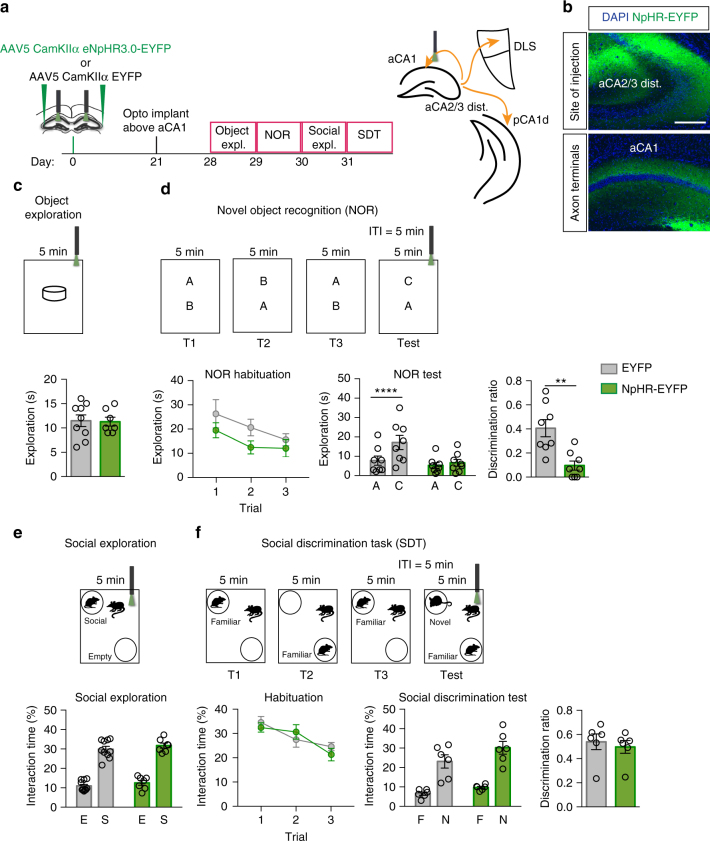
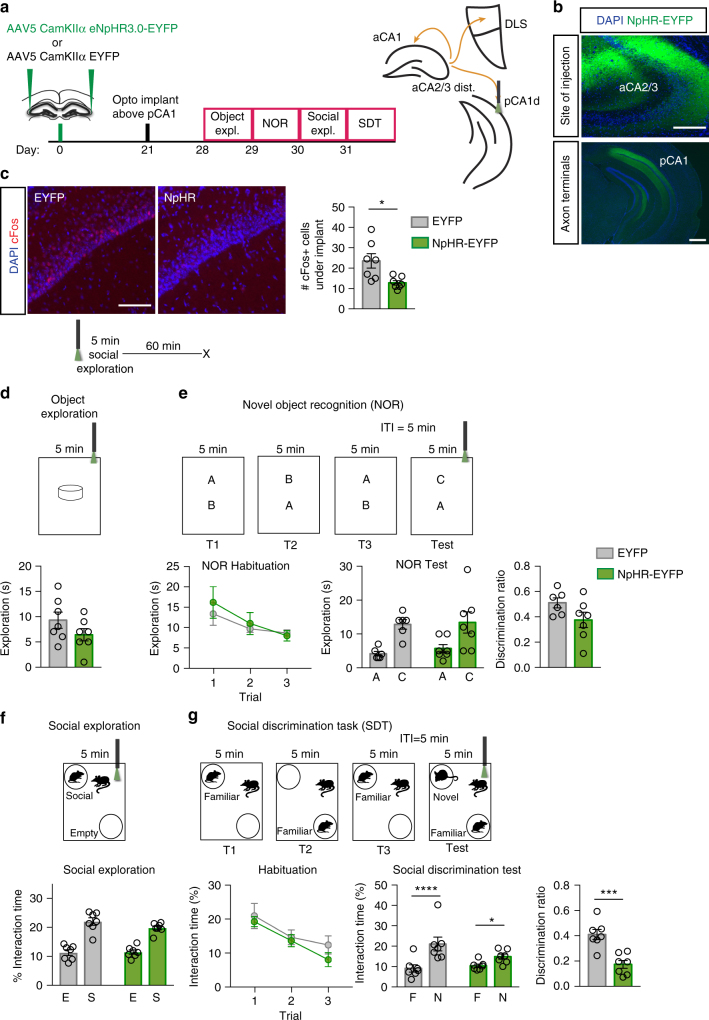
Oxytocin receptor (Oxtr) signaling in neural circuits mediating discrimination of social stimuli and affiliation or avoidance behavior is thought to guide social recognition. Remarkably, the physiological functions of Oxtrs in the hippocampus are not known. Here we demonstrate using genetic and pharmacological approaches that Oxtrs in the anterior dentate gyrus (aDG) and anterior CA2/CA3 (aCA2/CA3) of mice are necessary for discrimination of social, but not non-social, stimuli. Further, Oxtrs in aCA2/CA3 neurons recruit a population-based coding mechanism to mediate social stimuli discrimination. Optogenetic terminal-specific attenuation revealed a critical role for aCA2/CA3 outputs to posterior CA1 for discrimination of social stimuli. In contrast, aCA2/CA3 projections to aCA1 mediate discrimination of non-social stimuli. These studies identify a role for an aDG-CA2/CA3 axis of Oxtr expressing cells in discrimination of social stimuli and delineate a pathway relaying social memory computations in the anterior hippocampus to the posterior hippocampus to guide social recognition.
Overview
The claims and statistics of this paper haven’t been checked yet.
Run the check — free, no account needed. It reads the open-access text and checks the sources it cites.
Integrity signals
Registry
Cites
Statistics
Figures
Verification
Claims the paper makes
The claims and statistics of this paper haven’t been checked yet.
Run the check — free, no account needed. It reads the open-access text and checks the sources it cites.
Claims other papers make about this one
Each is checked against this paper’s own text: does it say what the citing paper says it does?
In the citing paper
“OXTRs in the anterior DG-CA2/ CA3 circuit facilitate social, but not object discrimination (101), and AVP projections from PVN to hippocampus influence recognition of conspecifics as well as spatial features in mice (102).”
From Oxytocin, Vasopressin, and Social Behavior: From Neural Circuits to Clinical Opportunities (2022) · cites this paper as [101]
In the citing paper
“In mice, BNST and MeA AVP cells are active during male sexual behavior (101, 119) and knockdown of AVP within the BNST reduced the number of intromissions and ejaculations in males, but did not alter sexual behavior in females (91).”
From Oxytocin, Vasopressin, and Social Behavior: From Neural Circuits to Clinical Opportunities (2022) · cites this paper as [101]
In the citing paper
“and the well-established role of oxytocin in social behaviors and social recognition (13, 21, 34; 39-44).”
From Social Interaction Elicits Activity in Glutamatergic Neurons in the Posterior Intralaminar Complex of the Thalamus (2024) · cites this paper as [43]
Self-check
Percentages, sums and reported differences re-computed from the paper’s own numbers.
The self-check needs the paper’s full text.
Citations
Cites
Are the Dorsal and Ventral Hippocampus Functionally Distinct Structures?
Fanselow, M. S., & Dong, H.-W. (2010) · Neuron · doi:10.1016/j.neuron.2009.11.031 · Cited by 3,358
Oxytocin and vasopressin in the human brain: social neuropeptides for translational medicine
Meyer-Lindenberg, A., Domes, G., Kirsch, P., & Heinrichs, M. (2011) · Nature Reviews Neuroscience · doi:10.1038/nrn3044 · Cited by 1,688
Oxytocin, vasopressin, and the neurogenetics of sociality
Donaldson, Z. R., & Young, L. J. (2008) · Science · doi:10.1126/science.1158668 · Cited by 1,645
Pattern Separation in the Dentate Gyrus and CA3 of the Hippocampus
Leutgeb, J. K., Leutgeb, S., Moser, M.-B., & Moser, E. I. (2007) · Science · doi:10.1126/science.1135801 · Cited by 1,601
Pattern separation in the hippocampus
Yassa, M. A., & Stark, C. E. L. (2011) · Trends in Neurosciences · doi:10.1016/j.tins.2011.06.006 · Cited by 1,544
Hippocampal synaptic enhancement and information storage within a distributed memory system
McNaughton, B. L., & Morris, R. G. M. (1987) · Trends in Neurosciences · doi:10.1016/0166-2236(87)90011-7 · Cited by 1,304
Social reward requires coordinated activity of nucleus accumbens oxytocin and serotonin
Dölen, G., Darvishzadeh, A., Huang, K. W., & Malenka, R. C. (2013) · Nature · doi:10.1038/nature12518 · Cited by 1,161
Pattern Separation in the Human Hippocampal CA3 and Dentate Gyrus
Bakker, A., Kirwan, C. B., Miller, M. I., & Stark, C. E. L. (2008) · Science · doi:10.1126/science.1152882 · Cited by 1,050
Oxytocin in the Medial Amygdala is Essential for Social Recognition in the Mouse
Ferguson, J. N., Aldag, J. M., Insel, T. R., & Young, L. J. (2001) · The Journal of Neuroscience · doi:10.1523/jneurosci.21-20-08278.2001 · Cited by 1,043
Oxytocin: The Great Facilitator of Life
Lee, H.-J., Macbeth, A. H., Pagani, J., & Young, W. S. (2009) · Progress in Neurobiology · doi:10.1016/j.pneurobio.2009.04.001 · Cited by 1,037
Cited by
Sorted by citations
Items 201–292 of 292
Kim, S.-H., An, K., Namkung, H., Rannals, M. D., Moore, J. R., Cash-Padgett, T. V., Mihaljevic, M. M., Saha, S., Oh, L. S., Kondo, M., et al. (2021) · bioRxiv (Cold Spring Harbor Laboratory) · doi:10.1101/2021.01.15.426848 · Cited by 4
Rajamani, K. T., Barbier, M., Lefèvre, A., Niblo, K., Cordero, N., Netser, S., Grinevich, V., Wagner, S., & Harony‐Nicolas, H. (2022) · bioRxiv (Cold Spring Harbor Laboratory) · doi:10.1101/2022.05.23.493099 · Cited by 4
Fluorescent Peptide Tracers for Simultaneous Oxytocin Receptor Activation and Visualization
Perisic, M., Kalaba, P., Gormal, R. S., Zupančič, M., Wolf, A., Juračić, M., Kremsmayr, T., Meunier, F. A., Langer, T., Gruber, C. W., et al. (2025) · Angewandte Chemie International Edition · doi:10.1002/anie.202515180 · Cited by 3
Hippocampal CA2 to CA1: A metaplastic switch for memory encoding
Ibrahim, M. Z. B., Goh, L. Z. N., Koh, N. W. K., Polepalli, J. S., Behnisch, T., & Sajikumar, S. (2025) · Proceedings of the National Academy of Sciences · doi:10.1073/pnas.2505936122 · Cited by 4
Moshfeghinia, R., Sanaei, E., Kavari, K., Barzegari, A. M., Ahmadzadeh, A. M., Bafrani, M. A., Habibzadeh, A., Boroon, M., & Shalbafan, M. (2025) · BMC Pharmacology and Toxicology · doi:10.1186/s40360-025-00996-y · Cited by 4
Social memory maintenance relies on social interaction-induced proteolytic products of neuroligin 1
Liu, A., Li, X., Zhuang, M., Ren, Q., Zhang, J., Lv, D., Wu, M., Bian, X., Zhu, C., Yang, X., et al. (2025) · Signal Transduction and Targeted Therapy · doi:10.1038/s41392-025-02467-6 · Cited by 3
The effects of oxytocin on social behavior and eye gaze: Insights from dog-human partnership
Yuan, S., & Zhang, Y. (2026) · Neuroscience & Biobehavioral Reviews · doi:10.1016/j.neubiorev.2026.106602 · Cited by 3
Tang, Y., Tang, L., Chen, B., Fan, M.-J., Chen, G.-J., Ou, Y.-N., Yang, F., & Wu, X. (2024) · Neuropharmacology · doi:10.1016/j.neuropharm.2024.110243 · Cited by 3
Effects of estrogen on social recognition and oxytocin regulating synaptic plasticity
Gao, T., Ying, Z., Yang, Y., & Xu, X. (2025) · Physiology & Behavior · doi:10.1016/j.physbeh.2025.114843 · Cited by 4
Tabbaa, M., Moses, A., & Hammock, E. A. D. (2021) · PLoS ONE · doi:10.1371/journal.pone.0260199 · Cited by 3
Micronutrients and the evolution of the human brain
Biesalski, H. K. (2023) · NFS Journal · doi:10.1016/j.nfs.2023.100150 · Cited by 3
Dissecting social decision-making: A spotlight on oxytocinergic transmission
Coccia, G., Greca, F. L., Luca, M. D., & Scheggia, D. (2022) · Frontiers in Molecular Neuroscience · doi:10.3389/fnmol.2022.1061934 · Cited by 3
Coding of social odors in the hippocampal CA2 region as a substrate for social memoryPreprint
Hassan, S., Bigler, S., & Siegelbaum, S. A. (2021) · bioRxiv (Cold Spring Harbor Laboratory) · doi:10.1101/2021.09.02.458744 · Cited by 3
Rajamani, K. T., Barbier, M., Lefèvre, A., Niblo, K., Cordero, N., Netser, S., Grinevich, V., Wagner, S., & Harony‐Nicolas, H. (2022) · SSRN Electronic Journal · doi:10.2139/ssrn.4124625 · Cited by 3
Leithead, A. B., Godino, A., Barbier, M., & Harony‐Nicolas, H. (2023) · bioRxiv (Cold Spring Harbor Laboratory) · doi:10.1101/2023.04.24.538114 · Cited by 3
A neural mechanism for discriminating social threat from social safetyPreprint
Kassraian, P., Bigler, S. K., Gilly, D. M., Shrotri, N., & Siegelbaum, S. (2023) · bioRxiv · doi:10.1101/2023.07.04.547723
Lee, S. H., Cilz, N. I., Williams, S. K., Cymerblit‐Sabba, A., Song, J., Courey, K., Howley, A., Cooke, M. E., & Young, W. S. (2023) · bioRxiv (Cold Spring Harbor Laboratory) · doi:10.1101/2023.08.30.555504 · Cited by 3
Taylor, C. S. R., Renström, J. G., Loayza, J., Gwilt, M., Williams, S. A., Allen, R. G., Moran, P. M., Gigg, J., Neill, J. C., Harte, M., et al. (2025) · Journal of Neuroscience · doi:10.1523/jneurosci.1141-25.2025 · Cited by 3
Shehadeh, E., Narattil, N. R., Kritman, M., & Maroun, M. (2025) · Behavioral and Brain Functions · doi:10.1186/s12993-025-00307-9 · Cited by 2
The (un-)Social Brain in Isolation
Fishman, A., Grinin, P., & RILJAK, V. (2025) · Physiological Research · doi:10.33549/physiolres.935565 · Cited by 2
The Function of Oxytocin in Memory —A General Review of Oxytocin’s Effect on Memory
Gao, F. (2023) · World Journal of Neuroscience · doi:10.4236/wjns.2023.134013 · Cited by 3
Ding, S., Liu, Y., Tao, H., Zhao, Y., Zeng, H., Han, Y., Wang, S., Chen, Z., Tang, Y., & Guo, W. (2024) · Psychoneuroendocrinology · doi:10.1016/j.psyneuen.2024.107138 · Cited by 2
Jones, S. M., Sleiman, S. J., McCann, K. E., Jarmusch, A. K., Alexander, G. M., & Dudek, S. M. (2024) · Neuropsychopharmacology · doi:10.1038/s41386-024-01971-7 · Cited by 3
Rigney, N., Horie, K., Guo, J., Blumenthal, S. A., Johnson, Z. V., & Young, L. J. (2025) · Hormones and Behavior · doi:10.1016/j.yhbeh.2025.105726 · Cited by 2
Borie, A. M., Dromard, Y., Dufner, D., Pollozi, E., Huzard, D., Tömböli, C., Olma, A., Manning, M., Colson, P. H., Guillon, G., et al. (2019) · bioRxiv (Cold Spring Harbor Laboratory) · doi:10.1101/800425 · Cited by 2
Scribble controls social behaviors through the regulation of the ERK/Mnk1 pathwayPreprint
Moreau, M. M., Pietropaolo, S., Ezan, J., Robert, B. J. A., Miraux, S., Maître, M., Cho, Y. H., Crusio, W. E., Montcouquiol, M., & Sans, N. (2020) · bioRxiv (Cold Spring Harbor Laboratory) · doi:10.1101/2020.09.10.289397 · Cited by 2
Coenjaerts, M., Trimborn, I., Adrovic, B., Stoffel‐Wagner, B., Cahill, L. F., Philipsen, A., Hurlemann, R., & Scheele, D. (2021) · bioRxiv (Cold Spring Harbor Laboratory) · doi:10.1101/2021.11.22.469500 · Cited by 2
Tsai, T.-C., Fang, Y.-S., Hung, Y.-C., Hung, L.-C., & Hsu, K. (2022) · Research Square · doi:10.21203/rs.3.rs-1356484/v1 · Cited by 2
CA2 neurons show abnormal responses to social stimuli in a rat model of Fragile X syndromePreprint
Donahue, M. M., Robson, E., Marron, A. M., Fernandez, E. J., Hill, M., Mably, A. J., Trimper, J. B., Brager, D. H., & Colgin, L. L. (2025) · bioRxiv (Cold Spring Harbor Laboratory) · doi:10.1101/2025.09.10.674743 · Cited by 3
Cai, A., Zheng, D., Xu, F., Wang, F., Sajikumar, S., & Wang, J. (2025) · Brain Sciences · doi:10.3390/brainsci15030284 · Cited by 1
Gong, H., Wang, Y., Ou, Y., Zhou, M., Wu, G., Che, M., Li, K., Chen, R., Xiong, Z., Ling, X., et al. (2026) · Brain Research Bulletin · doi:10.1016/j.brainresbull.2026.111904 · Cited by 1
What Is the Potential Relevance of Hippocampal Area CA2 in Neurologic Disorders?
Benarroch, E. E. (2026) · Neurology · doi:10.1212/wnl.0000000000218096 · Cited by 1
Psilocybin modulates social behaviour in male and female mice in a time-dependent manner
Shadani, S., McCoy, K., Ong, L., Greaves, E., Conn, K., Andrews, Z. B., & Foldi, C. J. (2026) · Neuropsychopharmacology · doi:10.1038/s41386-026-02450-x · Cited by 2
A hypothalamic–hippocampal circuit-driven plasticity in fasciola cinereum mediates social memory
Qin, H., Wang, X., Jian, T., Li, Q., Liang, S., Tao, J., Wang, R., Chen, Q., Liu, B., Zhang, K., et al. (2026) · Vita · doi:10.15302/vita.2026.08.0071 · Cited by 1
Avliyakulyeva, A. M., Kindyakova, E., Kuzmina, S. V., Gorina, Y. V., & Lopatina, O. L. (2024) · Bulletin of Siberian Medicine · doi:10.20538/1682-0363-2024-1-105-115 · Cited by 2
Xiao, S., Ebner, N. C., Dang, J., Rukh, G., Westberg, L., Schiöth, H. B., & Fischer, H. (2024) · Cortex · doi:10.1016/j.cortex.2024.11.017 · Cited by 1
Silkis, I. G. (2021) · Neuroscience and Behavioral Physiology · doi:10.1007/s11055-021-01169-0 · Cited by 1
Neural Representation of the Relational Self from Infancy to AdulthoodPreprint
Ulmer-Yaniv, A., Waidergoren, S., Shaked, A., Salomon, R., & Feldman, R. (2021) · bioRxiv (Cold Spring Harbor Laboratory) · doi:10.1101/2021.03.21.436295 · Cited by 1
Oxytocin Modulates the Neurocomputational Mechanisms Engaged in Learning Social HierarchyPreprint
Liu, J., Qu, C., Phillipe, R., Li, S., Derrington, E. A., Corgnet, B., & Dreher, J. (2023) · SSRN Electronic Journal · doi:10.2139/ssrn.4514360 · Cited by 1
Dorsal hippocampal oxytocin receptor regulates adult peer bonding in ratsPreprint
Hu, Y., Li, W., Zhao, Y., Liu, Y., Sun, W., Yan, Y. F., Liu, L., Deng, B., & Fan, P. (2023) · bioRxiv (Cold Spring Harbor Laboratory) · doi:10.1101/2023.12.04.570022 · Cited by 1
Chung, A., Alipio, J. B., Ghosh, M., Evans, L., Miller, S. M., Goode, T. D., Mehta, I., Ahmed, O. J., & Sahay, A. (2025) · Research Square · doi:10.1101/2025.03.17.643806 · Cited by 1
Kozlova, E. V., Gonzalez, G. M., Denys, M. E., Bishay, A. E., Gutierrez, R., Reid, J., Krum, J. M., Lampel, G., Luvsanravdan, N., Rabbani, K. M., et al. (2025) · bioRxiv (Cold Spring Harbor Laboratory) · doi:10.1101/2025.09.02.673882 · Cited by 1
Chauhan, G., Kumar, G., Roy, K., Kumari, P., Alam, S., Thondala, B., Kishore, K., Panjwani, U., & Ray, K. (2020) · doi:10.21203/rs.3.rs-97712/v1
Díaz, C. G. (2021) · Tesis Doctorals en Xarxa (Consorci de Serveis Universitaris de Catalunya) · doi:10.6035/14112.2021.403202
Silkis, I. G. (2021) · Neurochemical Journal · doi:10.1134/s1819712421020148
Oxytocin Increases Prosocial Behavior in Groups of African LionsPreprint
Burkhart, J. C., Gupta, S., Borrego, N., Heilbronner, S. R., & Packer, C. (2021) · SSRN Electronic Journal · doi:10.2139/ssrn.3919952
Pimpinella, D., Mastrorilli, V., Giorgi, C., Coemans, S., Lecca, S., Lalive, A. L., Ostermann, H., Fuchs, E. C., Monyer, H., Mele, A., et al. (2021) · eLife · doi:10.7554/elife.65580.sa2
Milton, A. L. (2019) · Faculty Opinions – Post-Publication Peer Review of the Biomedical Literature · doi:10.3410/f.734996995.793567218
Sajikumar, S., & Raghuraman, R. (2019) · Faculty Opinions – Post-Publication Peer Review of the Biomedical Literature · doi:10.3410/f.734996995.793556932
Kumar, A., Kumar, P., Faiq, M. A., Sharma, V., Sesham, K., & Kulandhasamy, M. (2018) · Springer eBooks · doi:10.1007/978-3-319-47829-6_476-1
Faculty Opinions recommendation of Oxytocin transforms firing mode of CA2 hippocampal neurons.
Sajikumar, S., & Benoy, A. (2018) · Faculty Opinions – Post-Publication Peer Review of the Biomedical Literature · doi:10.3410/f.734147277.793553360
Kumar, A., Kumar, P., Faiq, M. A., Sharma, V. K., Sesham, K., & Kulandhasamy, M. (2022) · Springer eBooks · doi:10.1007/978-3-319-55065-7_476
Maletta, T. A. (2022) · Carleton University's Institutional Repository (MacOdrum Library, Carleton University) · doi:10.22215/etd/2022-15208
Koulousakis, P. (2024) · Research Publications (Maastricht University) · doi:10.26481/dis.20240523pk
Neurobiological mechanisms of social recognition memory
Park, G., & Lee, Y. (2024) · Elsevier eBooks · doi:10.1016/b978-0-443-15754-7.00027-4
The role of hippocampal subregions in learning and memory
Shin, J., Lee, J. W., & Jung, M. W. (2025) · Elsevier eBooks · doi:10.1016/b978-0-443-15754-7.00079-1
The role of oxytocin on touching and daily life
Yamaguchi, H. (2024) · Journal for the Integrated Study of Dietary Habits · doi:10.2740/jisdh.35.3_127
Wang, J., Zhang, L., Liu, J., Yang, Y., Wei, X., Jiang, X., Hua, Y., Zhu, T., Chen, G., & Zhou, C. (2025) · Molecular Psychiatry · doi:10.1038/s41380-025-03101-1
Muller, M., Fermigier, A., Rakotonandrasana, A., Ducourneau, E., Moschetta, M., Eldirdiri, H. S., Radice, M., Raffaelli, P.-A., Ferreira, G., Chevaleyre, V., et al. (2026) · Cell Reports · doi:10.1016/j.celrep.2026.117935
Esquilin‐Rodriguez, C. J., Fricker, B. A., & Kelly, A. M. (2025) · Journal of Neuroendocrinology · doi:10.1111/jne.70089
Fluoreszenzmarkierte Peptidtracer zur simultanen Aktivierung und Bildgebung des Oxytocinrezeptors
Perisic, M., Kalaba, P., Gormal, R. S., Zupančič, M., Wolf, A., Juračić, M., Kremsmayr, T., Meunier, F. A., Langer, T., Gruber, C. W., et al. (2025) · Angewandte Chemie · doi:10.1002/ange.202515180
Brain-Wide Subnetworks within and between Naturally Socializing Typical and Autism Model MicePreprint
Marmor, O., Terner, R., Khuory, V., Ginzburg, S., Amal, H., & Gilad, A. (2025) · bioRxiv (Cold Spring Harbor Laboratory) · doi:10.1101/2025.10.16.682530
Beery, A. K., Lee, N. S., & Cooke, E. M. (2025) · Developmental Neurobiology · doi:10.1002/dneu.23005 · Cited by 1
Representations of social experience in hippocampal circuits
Clein, R. S., & Gould, E. (2025) · Trends in Cognitive Sciences · doi:10.1016/j.tics.2025.09.011
Social memory deficits and their neural correlates in multiple sclerosis
Magalhães, A., Morais, M., Amorim, L., Coelho, A., Morais‐Ribeiro, R., Gomes, C., Oliveira, T. G., Schafer, M., Cerqueira, J., & Meira, T. (2025) · Scientific Reports · doi:10.1038/s41598-025-23153-1 · Cited by 1
The Growth of the Brain in a Changing Environment
Biesalski, H. K. (2025) · Springer eBooks · doi:10.1007/978-3-031-99121-9_10
Oxytocin enhances excitability and potentiates synaptic transmission in dentate gyrus granule cellsPreprint
Marron, A. M., Balsamo, B., & Brager, D. H. (2025) · bioRxiv (Cold Spring Harbor Laboratory) · doi:10.64898/2025.12.06.692683
Lei, H.-Y., Pi, G.-L., He, T., Xiong, R., Lv, J.-R., Liu, J.-L., Wu, D.-Q., Li, M.-Z., Shi, K., Li, S.-H., et al. (2024) · Figshare · doi:10.6084/m9.figshare.25378030
Hung, Y.-C., Hsieh, Y.-Y., & Hsu, K. (2026) · Journal of Biomedical Science · doi:10.1186/s12929-026-01221-6
Oxytocin mediates the acquisition and strategy formation of cooperation in ratsPreprint
Lin, Y., Wei, L., Wang, Q., & Wang, Z. (2026) · bioRxiv (Cold Spring Harbor Laboratory) · doi:10.64898/2026.03.02.708935
Zhang, L., Huang, M., Ye, C.-L., Tang, Z., Xu, M., Yuan, W. A. N. G., Wang, T., Luo, S., Ji, R., Yu, C., et al. (2026) · Nature Communications · doi:10.1038/s41467-026-69955-3
Bertoni, A. (2019) · theses.fr (ABES) · doi:10.70675/d43fcf44zc66ez47a1zae43zd20439e2b233
Royer, J. (2021) · theses.fr (ABES) · doi:10.70675/9561320dz3197z4755zbb24zf51613d38d02
On the developmental origin of CA1 pyramidal neuron diversity in the adult mouse hippocampus
Cavalieri, D. (2021) · theses.fr (ABES) · doi:10.70675/af05b2d4zc031z48d7z9ebaz859f489a8450
Chemogenetic manipulation of the hippocampus alleviates obesogenic diet-induced memory deficits
Bakoyiannis, I. (2021) · theses.fr (ABES) · doi:10.70675/f5ac23cezc829z4dc0zaf4az467fb1eb75a9
Narattil, N. R., Chandran, S. K., & Maroun, M. (2026) · Communications Biology · doi:10.1038/s42003-026-10088-0
Tachi, A., Takahashi, Y., Ito, Y., Kato, S., Sugiura‐Ogasawara, M., Saitoh, S., Kamijima, M., Children’s Study Group the Japan Environment, Yamazaki, S., Fukami, M., et al. (2026) · Scientific Reports · doi:10.1038/s41598-026-46497-8
Genome editing-based refinement of GPCR visualization in mice using the oxytocin receptor as a model
Inoue, Y. U., Kurumiya, E., Tany, R., Koike, E., Asami, J., Masuho, I., & Inoue, T. (2026) · Scientific Reports · doi:10.1038/s41598-026-50956-7
Wu, M., Wang, Z., Cao, K., Zhu, C., Wang, Z., Li, M., Ren, Q., Yi, Z., Yang, X., Wang, S., et al. (2026) · Nature Communications · doi:10.1038/s41467-026-73903-6
Illouz, H., Jesic, M., Tanche, E., Lelièvre, V., Hugel, S., & Poisbeau, P. (2026) · bioRxiv (Cold Spring Harbor Laboratory) · doi:10.64898/2026.07.04.736473
Demetrovich, P. G., & Colgin, L. L. (2026) · Journal of Neuroscience · doi:10.1523/jneurosci.2001-25.2026 · Cited by 1
Circuit logic of oxytocin and vasopressin complementary actions
Jeanneteau, F. D., Chakraborty, P., Petitjean, H., & Charlet, A. (2026) · Frontiers in Neuroscience · doi:10.3389/fnins.2026.1875731
Kozlova, E. V., Denys, M. E., Bishay, A. E., Do, E. A., Lui, R., Luna, C. N., Lam, A. A., Piamthai, V., Hsiao, A., & Currás‐Collazo, M. (2026) · bioRxiv (Cold Spring Harbor Laboratory) · doi:10.64898/2026.07.18.739173
Kozlova, E. V., Gonzalez, G. M., Denys, M. E., Bishay, A. E., Gutiérrez, R., Reid, J., Krum, J. M., Lampel, G., Luvsanravdan, N., Rabbani, K. M., et al. (2026) · Journal of Neuroendocrinology · doi:10.1111/jne.70237 · Cited by 1
Zwierzyńska, E., Stragierowicz, J., Nasiadek, M., Klimczak, M., & Pietrzak, B. (2026) · International Journal of Molecular Sciences · doi:10.3390/ijms27167435
Comparative atlas of PVN oxytocin and vasopressin systems reveals sex-conserved input–output wiring
Freda, S. N., Lowe, Y. F., Priest, M. F., Badong, D., Liu, Y., Xiao, L., & Kozorovitskiy, Y. (2026) · Proceedings of the National Academy of Sciences · doi:10.1073/pnas.2536750123
Rtel1 in hypothalamic oxytocin neurons regulates oxytocin output and social behaviors in micePreprint
Wang, J., Wang, X., & Qiu, Z. (2026) · bioRxiv (Cold Spring Harbor Laboratory) · doi:10.64898/2026.09.10.750776
Loveren, E. V., Alfos, S., Guu, S. F., Ducroix‐Crepy, C., Hernández‐Ramírez, S., Ferreira, G., & Lafenetre, P. (2026) · Journal of Neuroendocrinology · doi:10.1111/jne.70300
Metadata
- Authors
- Raam, T., McAvoy, K. M., Besnard, A., Veenema, A. H., & Sahay, A.
- Affiliations
- Harvard University (US)
- Michigan State University (US)
- Broad Institute (US)
- Corresponding author
- Sahay, Amar
- Venue
- Nature Communications
- Published
- 2017-12-08
- Volume
- 8
- Issue
- 1
- Pages
- 2001-2001
- ISSN
- 2041-1723 (ISSN-L)
- PMC
- PMC5722862
- OpenAlex
- W2772417881
- Cited by
- 292
- References
- 70
- Citations by year
- 2026: 25 · 2025: 35 · 2024: 26 · 2023: 33 · 2022: 48 · 2021: 40 · 2020: 34 · 2019: 25 · 2018: 26
- FWCI
- 33.27
- Type
- journal article
- Language
- en
- Update notices
- correction (2018-02-02)
- Open access
- gold
- doi.org
- Locations
- Nature Communications (publishedVersion, cc-by)
- PubMed Central (publishedVersion, cc-by)
- PubMed (publishedVersion)
- Digital Access to Scholarship at Harvard (DASH) (Harvard University) (submittedVersion, cc-by)
- RePEc: Research Papers in Economics (submittedVersion)
- DOAJ (DOAJ: Directory of Open Access Journals) (submittedVersion)
- DOAJ (DOAJ: Directory of Open Access Journals) (submittedVersion, cc-by-sa)
- Funders
- Ellison Medical Foundation
- National Alliance for Research on Schizophrenia and Depression
- National Institutes of Health
- Harvard Stem Cell Institute
- National Institute on Aging (RF1AG048908)
- National Institute of Mental Health (R01MH104175, R01MH111729)
- Topics
- Life Sciences › Neuroscience › Endocrine and Autonomic Systems › Neuroendocrine regulation and behavior
- Life Sciences › Neuroscience › Cognitive Neuroscience › Memory and Neural Mechanisms
- Life Sciences › Neuroscience › Cellular and Molecular Neuroscience › Neuroscience and Neuropharmacology Research
- Keywords
- oxytocin receptor, hippocampus, social recognition, CA1, population coding, social memory, optogenetic manipulation
- MeSH terms
- Animals, Behavior, Animal, Discrimination, Psychological, Hippocampus, Male, Mice, Inbred C57BL, Neural Pathways, Neurons, Social Behavior, Receptors, Oxytocin, Mice, Knockout, Models, Animal, Mice, Optogenetics
About these checks
Registry, retraction, Cites and statistics results are computed, not judged, with one exception: a printed reference that no index lists is read once by a model before it counts as a citation error. Claims are extracted by a model and kept only when their quote appears verbatim in the text; each cited source is then checked, with a model’s help, for whether it says what the claim relies on. Those verdicts can be wrong — read the claim’s quote and the cited source before relying on one.
Statistics and arithmetic are recomputed, not judged.
Confidence bands are shown only for fields calibrated on our annotated test set. None is calibrated yet, so no band is shown.
What counts as a claim ›How we measure confidence ›How we check this ›
Are you an author, or do you see a problem with this page? Request a review
