

The DOI matches its Crossref record; 53 of the 53 references it cites were found in a registry or an index.
The evolutionary landscape of chronic lymphocytic leukemia treated with ibrutinib targeted therapy
Open accessAbstract
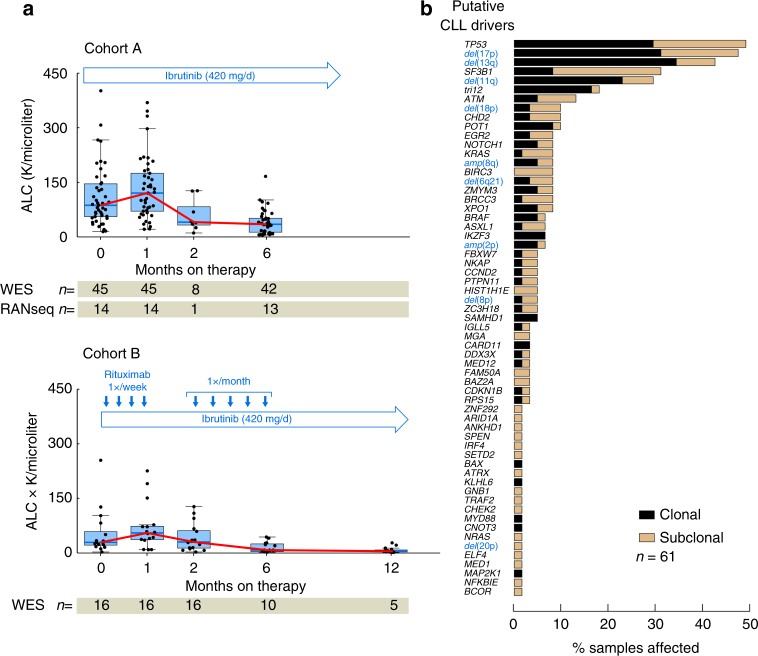
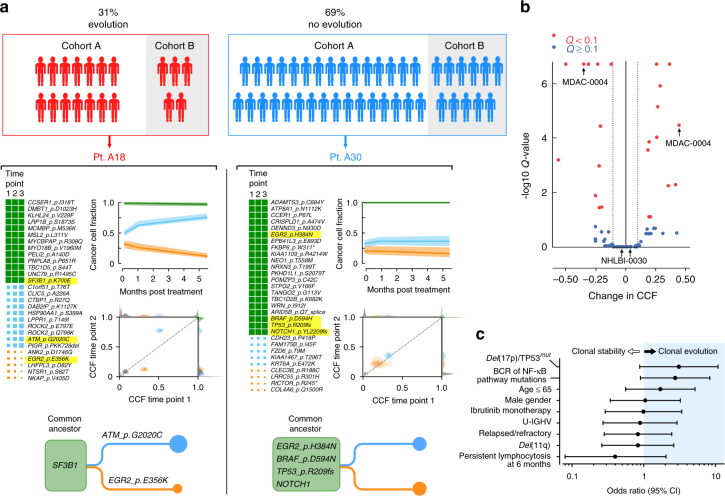
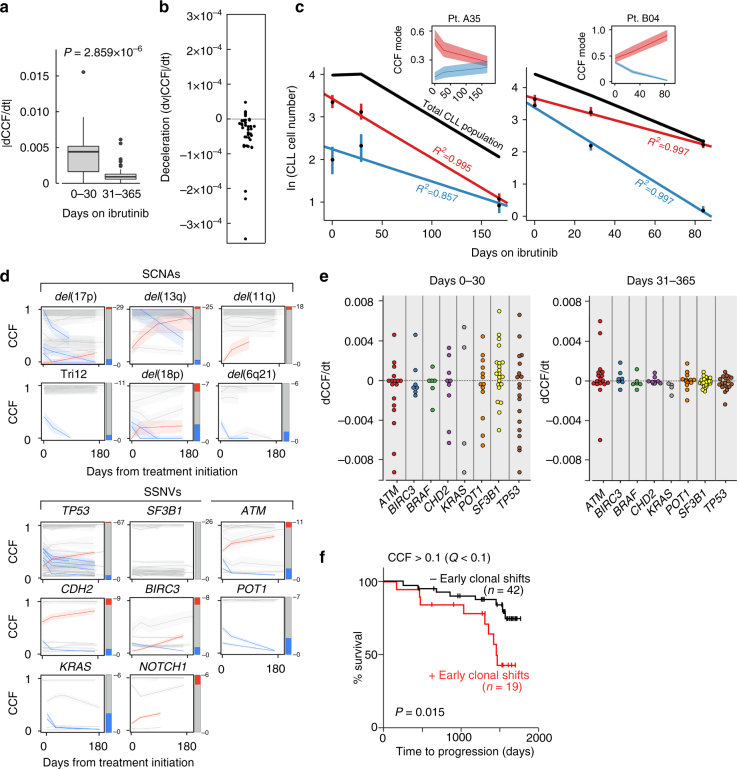
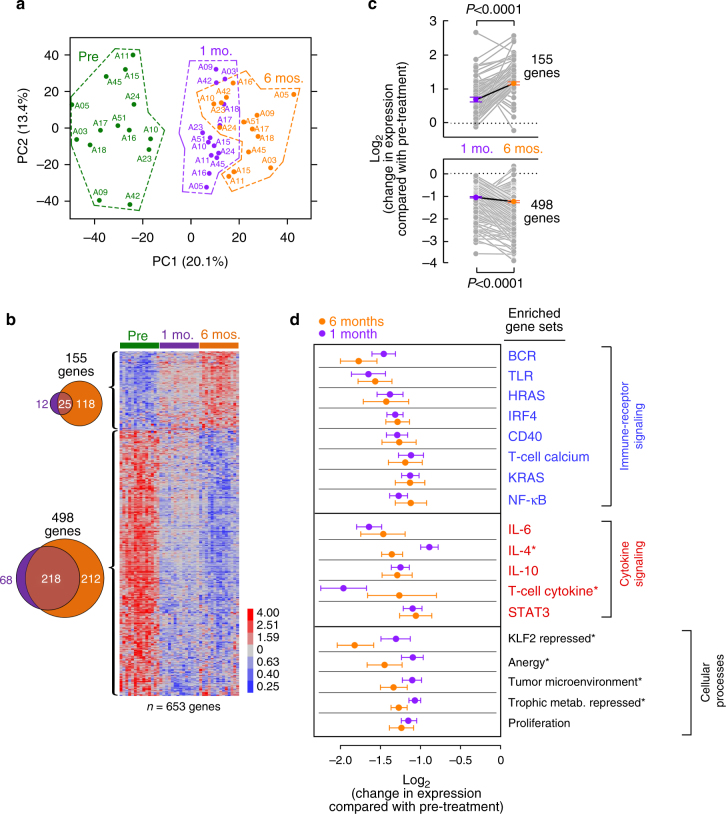
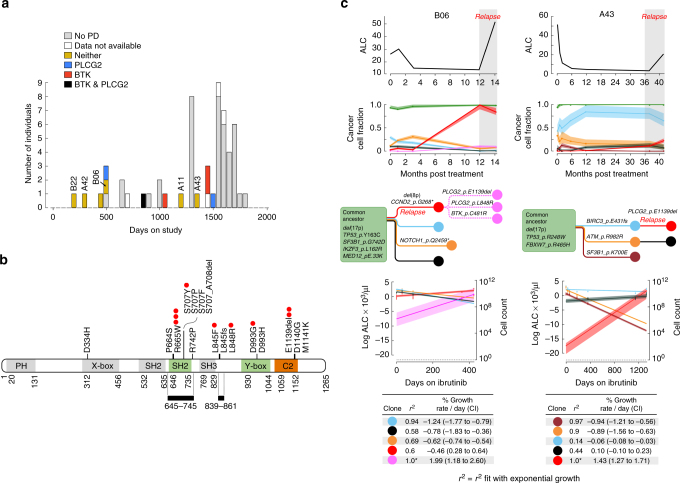
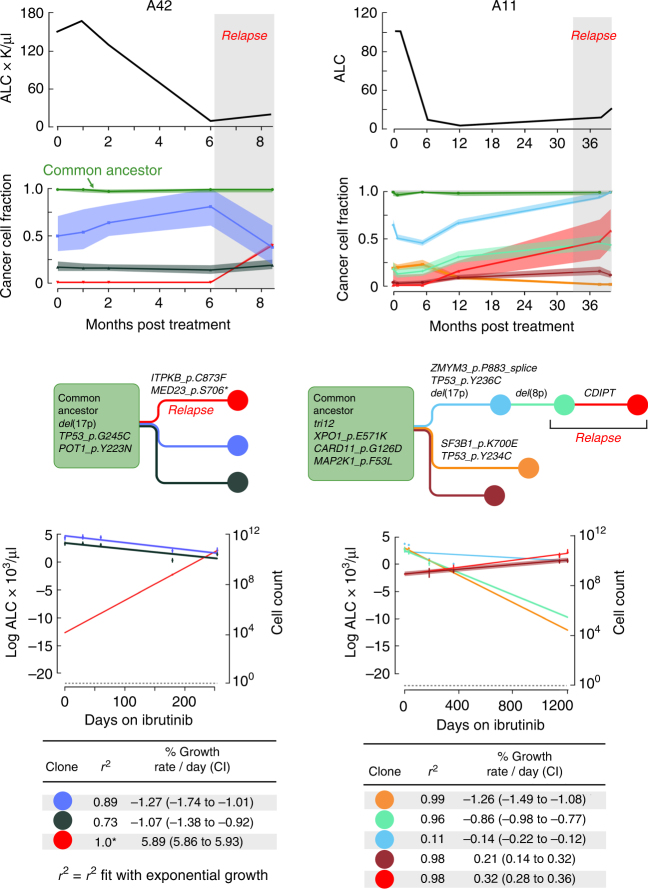
Treatment of chronic lymphocytic leukemia (CLL) has shifted from chemo-immunotherapy to targeted agents. To define the evolutionary dynamics induced by targeted therapy in CLL, we perform serial exome and transcriptome sequencing for 61 ibrutinib-treated CLLs. Here, we report clonal shifts (change >0.1 in clonal cancer cell fraction, Q < 0.1) in 31% of patients during the first year of therapy, associated with adverse outcome. We also observe transcriptional downregulation of pathways mediating energy metabolism, cell cycle, and B cell receptor signaling. Known and previously undescribed mutations in BTK and PLCG2, or uncommonly, other candidate alterations are present in seventeen subjects at the time of progression. Thus, the frequently observed clonal shifts during the early treatment period and its potential association with adverse outcome may reflect greater evolutionary capacity, heralding the emergence of drug-resistant clones.
Overview
The claims and statistics of this paper haven’t been checked yet.
Run the check — free, no account needed. It reads the open-access text and checks the sources it cites.
Integrity signals
Registry
Cites
Statistics
Figures
Verification
Claims the paper makes
The claims and statistics of this paper haven’t been checked yet.
Run the check — free, no account needed. It reads the open-access text and checks the sources it cites.
Claims other papers make about this one
Each is checked against this paper’s own text: does it say what the citing paper says it does?
The source backs part of the claim, not all of it — or backs it for a different population, condition or comparison.
In the citing paper
“Duration of response with a BTKi is longer in settings where clonal complexity and evolutionary potential are lower, such as in treatment-naïve cases(12, 14, 17).”
From Resistance Mechanisms and Approach to Chronic Lymphocytic Leukemia after BTK Inhibitor Therapy (2025) · cites this paper as [17]
Experimental — accuracy not yet measuredThe cited source says what the claim attributes to it.
In the citing paper
“Likewise, continuous BTKi therapy exerts a strong selective pressure, with resistant subclones often emerging after years of treatment(12, 17, 18).”
From Resistance Mechanisms and Approach to Chronic Lymphocytic Leukemia after BTK Inhibitor Therapy (2025) · cites this paper as [17]
The cited source says what the claim attributes to it.
In the citing paper
“However, after Ibrutinib treatment, it was observed that CLL progression favored the selection of rare subclones bearing PLCγ2 mutations (129, 130).”
From The role of PLCγ2 in immunological disorders, cancer, and neurodegeneration (2021) · cites this paper as [129]
Self-check
Percentages, sums and reported differences re-computed from the paper’s own numbers.
The self-check needs the paper’s full text.
Citations
Cites
The Sequence Alignment/Map format and SAMtools
Li, H., Handsaker, B., Wysoker, A., Fennell, T., Ruan, J., Homer, N., Marth, G., Abecasis, G., Durbin, R., & 1000 Genome Project Data Processing Subgroup (2009) · Bioinformatics · doi:10.1093/bioinformatics/btp352 · Cited by 62,041
Fast and accurate short read alignment with Burrows-Wheeler transform
Li, H., & Durbin, R. (2009) · Bioinformatics · doi:10.1093/bioinformatics/btp324 · Cited by 58,607
The Genome Analysis Toolkit: A MapReduce framework for analyzing next-generation DNA sequencing data
McKenna, A., Hanna, M., Banks, E., Sivachenko, A., Cibulskis, K., Kernytsky, A., Garimella, K., Altshuler, D., Gabriel, S., Daly, M., et al. (2010) · Genome Research · doi:10.1101/gr.107524.110 · Cited by 27,895
Robinson, J. T., Thorvaldsdóttir, H., Winckler, W., Guttman, M., Lander, E. S., Getz, G., & Mesirov, J. P. (2011) · Nature Biotechnology · doi:10.1038/nbt.1754 · Cited by 15,390
Self-citationA method and server for predicting damaging missense mutations.
Adzhubei, I. A., Schmidt, S., Peshkin, L., Ramensky, V. E., Gerasimova, A., Bork, P., Kondrashov, A. S., & Sunyaev, S. R. (2010) · Nature Methods · doi:10.1038/nmeth0410-248 · Cited by 13,194
Sensitive detection of somatic point mutations in impure and heterogeneous cancer samples
Cibulskis, K., Lawrence, M. S., Carter, S. L., Sivachenko, A., Jaffe, D. B., Sougnez, C. L., Gabriel, S., Meyerson, M. M., Lander, E. S., & Getz, G. A. (2013) · Nature Biotechnology · doi:10.1038/nbt.2514 · Cited by 4,966
Self-citationUnmutated Ig VH Genes Are Associated With a More Aggressive Form of Chronic Lymphocytic Leukemia
Hamblin, T. J., Davis, Z. A., Gardiner, A. C., Oscier, D. G., & Stevenson, F. K. (1999) · Blood · doi:10.1182/blood.v94.6.1848 · Cited by 2,774
Circular binary segmentation for the analysis of array-based DNA copy number data
Olshen, A. B., Venkatraman, E. S., Lucito, R., & Wigler, M. H. (2004) · Biostatistics · doi:10.1093/biostatistics/kxh008 · Cited by 2,304
COSMIC: exploring the world's knowledge of somatic mutations in human cancer
Forbes, S. A., Beare, D. M., Gunasekaran, P., Leung, K., Bindal, N., Boutselakis, H., Ding, M., Bamford, S., Cole, C. G., Ward, S. A., et al. (2014) · Nucleic Acids Research · doi:10.1093/nar/gku1075 · Cited by 2,294
Targeting BTK with Ibrutinib in Relapsed Chronic Lymphocytic Leukemia
Byrd, J. C., Furman, R. R., Coutre, S. E., Flinn, I. W., Burger, J. A., Blum, K. A., Grant, B., Sharman, J. P., Coleman, M., Wierda, W. G., et al. (2013) · New England Journal of Medicine · doi:10.1056/nejmoa1215637 · Cited by 2,270
Self-citation
Cited by
Sorted by citations
Wright, G. W., Huang, D. W., Phelan, J. D., Coulibaly, Z. A., Roulland, S., Young, R. M., Wang, J. Q., Schmitz, R., Morin, R. D., Tang, J. S., et al. (2020) · Cancer Cell · doi:10.1016/j.ccell.2020.03.015 · Cited by 1,179
Ibrutinib–Rituximab or Chemoimmunotherapy for Chronic Lymphocytic Leukemia
Shanafelt, T. D., Wang, X. V., Kay, N. E., Hanson, C. A., O'Brien, S. M., Barrientos, J. C., Jelinek, D. F., Braggio, E., Leis, J. F., Zhang, C. C., et al. (2019) · New England Journal of Medicine · doi:10.1056/nejmoa1817073 · Cited by 765
Integrating genetic and non-genetic determinants of cancer evolution by single-cell multi-omics
Nam, A. S., Chaligné, R., & Landau, D. A. (2020) · Nature Reviews Genetics · doi:10.1038/s41576-020-0265-5 · Cited by 399
Self-citationDNA Damage/Repair Management in Cancers
Alhmoud, J. F., Woolley, J. F., Moustafa, A. A., & Malki, M. I. (2020) · Cancers · doi:10.3390/cancers12041050 · Cited by 409
Somatic mutations and cell identity linked by Genotyping of Transcriptomes
Nam, A. S., Kim, K.-T., Chaligne, R., Izzo, F., Ang, C., Taylor, J., Myers, R. M., Abu-Zeinah, G., Brand, R., Omans, N. D., et al. (2019) · Nature · doi:10.1038/s41586-019-1367-0 · Cited by 333
Self-citationKater, A. P., Seymour, J. F., Hillmen, P., Eichhorst, B. F., Langerak, A. W., Owen, C., Verdugo, M., Wu, J. Q., Punnoose, E. A., Jiang, Y., et al. (2018) · Journal of Clinical Oncology · doi:10.1200/jco.18.01580 · Cited by 316
Gopal, R. K., Kübler, K., Calvo, S. E., Polak, P. P., Livitz, D. G., Rosebrock, D., Sadow, P. M., Campbell, B., Donovan, S. E., Amin, S., et al. (2018) · Cancer Cell · doi:10.1016/j.ccell.2018.06.013 · Cited by 271
Self-citationPhase 1b trial of an ibrutinib-based combination therapy in recurrent/refractory CNS lymphoma
Grommes, C., Tang, S. S. K., Wolfe, J., Kaley, T. J., Daras, M., Pentsova, E. I., Piotrowski, A. F., Stone, J. B., Lin, A. L., Nolan, C. P., et al. (2018) · Blood · doi:10.1182/blood-2018-09-875732 · Cited by 249
Chronic lymphocytic leukaemia: from genetics to treatment
Bosch, F., & Dalla‐Favera, R. (2019) · Nature Reviews Clinical Oncology · doi:10.1038/s41571-019-0239-8 · Cited by 259
Kater, A. P., Wu, J. Q., Kipps, T. J., Eichhorst, B. F., Hillmen, P., D’Rozario, J., Assouline, S. E., Owen, C., Robak, T., de la Serna, J., et al. (2020) · Journal of Clinical Oncology · doi:10.1200/jco.20.00948 · Cited by 228
Tracking Cancer Evolution through the Disease Course
Bailey, C., Black, J. R., Reading, J. L., Litchfield, K., Turajlic, S., McGranahan, N., Jamal‐Hanjani, M., & Swanton, C. (2021) · Cancer Discovery · doi:10.1158/2159-8290.cd-20-1559 · Cited by 159
Molecular map of chronic lymphocytic leukemia and its impact on outcome
Knisbacher, B. A., Lin, Z., Hahn, C. K., Nadeu, F., Duran‐Ferrer, M., Stevenson, K. E., Tausch, E., Delgado, J., Barbera-Mourelle, A., Taylor-Weiner, A. N., et al. (2022) · Nature Genetics · doi:10.1038/s41588-022-01140-w · Cited by 167
Self-citationCharacterizing the ecological and evolutionary dynamics of cancer
Zahir, N., Sun, R., Gallahan, D., Gatenby, R. A., & Curtis, C. N. (2020) · Nature Genetics · doi:10.1038/s41588-020-0668-4 · Cited by 144
Pathogenic B‐cell receptor signaling in lymphoid malignancies: New insights to improve treatment
Young, R. M., Phelan, J. D., Wilson, W. H., & Staudt, L. M. (2019) · Immunological Reviews · doi:10.1111/imr.12792 · Cited by 155
Detection of early seeding of Richter transformation in chronic lymphocytic leukemia
Nadeu, F., Royo, R., Massoni-Badosa, R., Playà-Albinyana, H., García-Torre, B., Duran‐Ferrer, M., Dawson, K. J., Kulis, M., Díaz‐Navarro, A., Villamor, N., et al. (2022) · Nature Medicine · doi:10.1038/s41591-022-01927-8 · Cited by 143
Evolution of CLL treatment — from chemoimmunotherapy to targeted and individualized therapy
Burger, J. A., & O'Brien, S. M. (2018) · Nature Reviews Clinical Oncology · doi:10.1038/s41571-018-0037-8 · Cited by 142
Self-citationQuinquenel, A., Fornecker, L.-M., Letestu, R., Ysebaert, L., Fleury, C., Lazarian, G., Dilhuydy, M.-S., Nollet, D., Guieze, R., Feugier, P., et al. (2019) · Blood · doi:10.1182/blood.2019000854 · Cited by 133
Targeting BTK in CLL: Beyond Ibrutinib
Bond, D. A., & Woyach, J. A. (2019) · Current Hematologic Malignancy Reports · doi:10.1007/s11899-019-00512-0 · Cited by 124
Jain, P., Kanagal‐Shamanna, R., Zhang, S., Ahmed, M., Ghorab, A., Zhang, L., Ok, C. Y., Li, S., Hagemeister, F. B., Zeng, D., et al. (2018) · British Journal of Haematology · doi:10.1111/bjh.15567 · Cited by 121
The role of PLCγ2 in immunological disorders, cancer, and neurodegeneration
Jackson, J. T., Mulazzani, E., Nutt, S. L., & Masters, S. L. (2021) · Journal of Biological Chemistry · doi:10.1016/j.jbc.2021.100905 · Cited by 113
“However, after Ibrutinib treatment, it was observed that CLL progression favored the selection of rare subclones bearing PLCγ2 mutations (129, 130).”
BackgroundAhn, I. E., Tian, X., Ipe, D., Cheng, M. L., Albitar, M. X., Tsao, L. C., Zhang, L., Ma, W., Herman, S. E. M., Gaglione, E. M., et al. (2020) · Journal of Clinical Oncology · doi:10.1200/jco.20.00979 · Cited by 108
Self-citationSun, C., Nierman, P., Kendall, E. K., Cheung, J., Gulrajani, M., Herman, S. E. M., Pleyer, C., Ahn, I. E., Stetler-Stevenson, M., Yuan, C. M., et al. (2020) · Blood · doi:10.1182/blood.2019003715 · Cited by 103
Self-citationChronic lymphocytic leukemia: from molecular pathogenesis to novel therapeutic strategies
Delgado, J., Nadeu, F., Colomer, D., & Campo, E. (2020) · Haematologica · doi:10.3324/haematol.2019.236000 · Cited by 113
Genomic profiling of primary histiocytic sarcoma reveals two molecular subgroups
Egan, C., Nicolae, A., Lack, J., Chung, H., Skarshaug, S., Pham, T., Navarro, W., Abdullaev, Z., Aguilera, N. S. I., Xi, L., et al. (2019) · Haematologica · doi:10.3324/haematol.2019.230375 · Cited by 104
Kanagal‐Shamanna, R., Jain, P., Patel, K. P., Routbort, M., Bueso‐Ramos, C., Alhalouli, T., Khoury, J. D., Luthra, R., Ferrajoli, A., Keating, M., et al. (2019) · Cancer · doi:10.1002/cncr.31831 · Cited by 98
Self-citationRendeiro, A. F., Krausgruber, T., Fortelny, N., Zhao, F., Penz, T., Farlik, M., Schuster, L. C., Nemc, A., Tasnády, S., Réti, M., et al. (2020) · Nature Communications · doi:10.1038/s41467-019-14081-6 · Cited by 97
Yin, S., Gambe, R. G., Sun, J., Martinez, A. Z., Cartun, Z. J., Regis, F. F., Wan, Y., Fan, J., Brooks, A. N., Herman, S. E. M., et al. (2019) · Cancer Cell · doi:10.1016/j.ccell.2018.12.013 · Cited by 92
Self-citationOverarching roles of diacylglycerol signaling in cancer development and antitumor immunity
Cooke, M., & Kazanietz, M. G. (2022) · Science Signaling · doi:10.1126/scisignal.abo0264 · Cited by 98
Genomic and transcriptomic correlates of Richter transformation in chronic lymphocytic leukemia
Klintman, J., Appleby, N., Stamatopoulos, B., Ridout, K., Eyre, T. A., Robbe, P., Pascua, L. L., Knight, S. J. L., Dreau, H. M.-P., Cabes, M., et al. (2020) · Blood · doi:10.1182/blood.2020005650 · Cited by 92
Phospholipase C families: Common themes and versatility in physiology and pathology
Katan, M., & Cockcroft, S. (2020) · Progress in Lipid Research · doi:10.1016/j.plipres.2020.101065 · Cited by 89
Hajicek, N., Keith, N. C., Siraliev-Perez, E., Temple, B. R., Huang, W., Zhang, Q., Harden, T. K., & Sondek, J. (2019) · eLife · doi:10.7554/elife.51700 · Cited by 89
Pastore, A., Gaiti, F., Lu, S. X., Brand, R. M., Kulm, S., Chaligné, R., Gu, H., Huang, K. Y., Stamenova, E. K., Béguelin, W., et al. (2019) · Nature Communications · doi:10.1038/s41467-019-09645-5 · Cited by 88
Self-citationEstupiñán, H. Y., Wang, Q., Berglöf, A., Schaafsma, G. C. P., Shi, Y., Zhou, L., Mohammad, D. K., Yu, L., Vihinen, M., Zain, R., et al. (2021) · Leukemia · doi:10.1038/s41375-021-01123-6 · Cited by 80
Kapoor, I., Li, Y., Sharma, A., Zhu, H., Bodo, J., Xu, W., Hsi, E. D., Hill, B. T., & Almasan, A. (2019) · Cell Death and Disease · doi:10.1038/s41419-019-2158-0 · Cited by 80
BTK and PLCG2 remain unmutated in one-third of patients with CLL relapsing on ibrutinib
Bonfiglio, S., Sutton, L., Ljungström, V., Capasso, A., Pandzic, T., Weström, S., Asl, H. F., Skaftason, A., Gellerbring, A., Lyander, A., et al. (2023) · Blood Advances · doi:10.1182/bloodadvances.2022008821 · Cited by 75
The importance of B cell receptor isotypes and stereotypes in chronic lymphocytic leukemia
ten Hacken, E., Gounari, M., Ghia, P., & Burger, J. A. (2018) · Leukemia · doi:10.1038/s41375-018-0303-x · Cited by 72
Self-citationSmith, C. I. E., & Burger, J. A. (2021) · Frontiers in Immunology · doi:10.3389/fimmu.2021.689472 · Cited by 69
Self-citationKittai, A. S., Miller, C. R., Goldstein, D., Huang, Y., Abruzzo, L. V., Beckwith, K. A., Bhat, S. A., Bond, D. A., Grever, M. R., Heerema, N. A., et al. (2021) · Blood · doi:10.1182/blood.2020010536 · Cited by 64
Baysac, K., Sun, G., Nakano, H., Schmitz, E. G., Cruz, A. C., Fisher, C., Bailey, A. C., Abbott, J. K., Aldave Becerra, J. C., Allenspach, E. J., et al. (2024) · Journal of Allergy and Clinical Immunology · doi:10.1016/j.jaci.2023.08.036 · Cited by 63
Penter, L., Gohil, S. H., Lareau, C. A., Ludwig, L. S., Parry, E. M., Huang, T., Li, S., Zhang, W., Livitz, D. G., Leshchiner, I., et al. (2021) · Cancer Discovery · doi:10.1158/2159-8290.cd-21-0276 · Cited by 64
Self-citationOvercoming Acquired Epigenetic Resistance to BTK Inhibitors
Shaffer, A. L., Phelan, J. D., Wang, J. Q., Huang, D., Wright, G. W., Kasbekar, M., Choi, J., Young, R. M., Webster, D. E., Yang, Y., et al. (2021) · Blood Cancer Discovery · doi:10.1158/2643-3230.bcd-21-0063 · Cited by 68
Self-citationSharma, S., Pavlasová, G. M., Šeda, V., Černá, K. A., Vojáčková, E., Filip, D., Ondrišová, L., Šandová, V., Košťálová, L., Zeni, P. F., et al. (2021) · Blood · doi:10.1182/blood.2020005627 · Cited by 65
Malčíková, J., Pavlová, Š., Vonková, B., Radová, L., Plevová, K., Kotašková, J., Pál, K., Dvořáčková, B., Ženatová, M., Hynšt, J., et al. (2021) · Blood · doi:10.1182/blood.2020009530 · Cited by 60
Hajicek, N., & Sondek, J. (2019) · Worldwide Protein Data Bank · doi:10.2210/pdb6pbc/pdb · Cited by 58
Minimal Residual Disease in Chronic Lymphocytic Leukemia: A New Goal?
Giudice, I. D., Raponi, S., Starza, I. D., Propris, M. S. D., Cavalli, M., Novi, L. A. D., Cappelli, L. V., Ilari, C., Cafforio, L., Guarini, A. R., et al. (2019) · Frontiers in Oncology · doi:10.3389/fonc.2019.00689 · Cited by 55
Sun, C., Chen, Y.-C., Martinez, A. Z., Baptista, M. J., Pittaluga, S., Liu, D., Rosebrock, D., Gohil, S. H., Saba, N. S., DAVIES-HILL, T. M., et al. (2022) · Blood Advances · doi:10.1182/bloodadvances.2021006941 · Cited by 53
Self-citationGángó, A., Alpár, D., Galik, B., Marosvári, D., Kiss, R., Fésüs, V., Aczél, D., Eyüpoglu, E., Nagy, N., Nagy, Á., et al. (2020) · International Journal of Cancer · doi:10.1002/ijc.32502 · Cited by 54
Sun, S., Wu, S.-H., Kang, J.-B., Ma, Y.-Y., Chen, L., Cao, P., Chang, L., Ding, N., Xue, X., Li, N., et al. (2022) · Journal of Medicinal Chemistry · doi:10.1021/acs.jmedchem.2c00030 · Cited by 54
Chen, Z., Simon‐Molas, H., Cretenet, G., Valle‐Argos, B., Smith, L., Forconi, F., Schomakers, B. V., van Weeghel, M., Bryant, D. J., van Bruggen, J. A. C., et al. (2022) · Blood · doi:10.1182/blood.2021013990 · Cited by 55
Clonal diversity predicts adverse outcome in chronic lymphocytic leukemia
Leeksma, A. C., Taylor, J., Wu, B., Gardner, J. R., He, J., Nahas, M. K., Gönen, M., Alemayehu, W. G., Raa, D. T., Walther, T., et al. (2018) · Leukemia · doi:10.1038/s41375-018-0215-9 · Cited by 49
Delineating the evolutionary dynamics of cancer from theory to reality
Božić, I., & Wu, C. J. (2020) · Nature Cancer · doi:10.1038/s43018-020-0079-6 · Cited by 46
Self-citationDecreased NOTCH1 Activation Correlates with Response to Ibrutinib in Chronic Lymphocytic Leukemia
Papa, B. D., Baldoni, S., Dorillo, E., Falco, F. D., Rompietti, C., Cecchini, D., Cantelmi, M. G., Sorcini, D., Nogarotto, M., Adamo, F. M., et al. (2019) · Clinical Cancer Research · doi:10.1158/1078-0432.ccr-19-1009 · Cited by 44
Mhibik, M., Gaglione, E. M., Eik, D., Herrick, J., Le, J., Ahn, I. E., Chiu, C., Wielgos-Bonvallet, M., Hiemstra, I. H., Breij, E. C. W., et al. (2023) · Blood Advances · doi:10.1182/bloodadvances.2022009517 · Cited by 43
Self-citationPirtobrutinib: a new hope for patients with BTK inhibitor-refractory lymphoproliferative disorders
Thompson, P. A., & Tam, C. (2023) · Blood Journal · doi:10.1182/blood.2023020240 · Cited by 42
Brieghel, C., Aarup, K., Torp, M. H., Andersen, M. A., Yde, C. W., Tian, X., Wiestner, A. U., Ahn, I. E., & Niemann, C. U. (2021) · Clinical Cancer Research · doi:10.1158/1078-0432.ccr-20-4890 · Cited by 43
Self-citationERIC recommendations for TP53 mutation analysis in chronic lymphocytic leukemia—2024 update
Malčíková, J., Pavlová, Š., Baliakas, P., Chatzikonstantinou, T., Tausch, E., Catherwood, M. A., Rossi, D., Soussi, T., Tichý, B., Kater, A. P., et al. (2024) · Leukemia · doi:10.1038/s41375-024-02267-x · Cited by 48
The resistance mechanisms and treatment strategies of BTK inhibitors in B-cell lymphoma
Wang, H., Zhang, W., Yang, J., & Zhou, K. (2021) · Hematological Oncology · doi:10.1002/hon.2933 · Cited by 41
Self-citationInhibiting Bruton’s Tyrosine Kinase in CLL and Other B-Cell Malignancies
Lucas, F. M., & Woyach, J. A. (2019) · Targeted Oncology · doi:10.1007/s11523-019-00635-7 · Cited by 40
Combined chemosensitivity and chromatin profiling prioritizes drug combinations in CLL
Schmidl, C., Vladimer, G. I., Rendeiro, A. F., Schnabl, S., Krausgruber, T., Taubert, C., Krall, N., Pemovska, T., Araghi, M., Snijder, B., et al. (2019) · Nature Chemical Biology · doi:10.1038/s41589-018-0205-2 · Cited by 39
DNA Damage/Repair Management in Cancers
Alhmoud, J. F., Woolley, J. F., Moustafa, A. A., & Mallei, M. I. (2021) · doi:10.1201/9781003180449-12 · Cited by 41
Quijada‐Álamo, M., Hernández‐Sánchez, M., Alonso-Pérez, V., Rodríguez‐Vicente, A. E., García‐Tuñón, I., Martín‐Izquierdo, M., Hernández-Sánchez, J. M., Herrero, A. B., Bastida, J. M., San‐Segundo, L., et al. (2020) · Leukemia · doi:10.1038/s41375-020-0714-3 · Cited by 39
Self-citationIbrutinib in Chronic Lymphocytic Leukemia: Clinical Applications, Drug Resistance, and Prospects
Zhou, H., Hu, P., Yan, X., Zhang, Y., & Shi, W. (2020) · OncoTargets and Therapy · doi:10.2147/ott.s249586 · Cited by 41
Stanchina, M., Montoya, S., Danilov, A. V., Castillo, J. J., Alencar, A. J., Chavez, J. C., Cheah, C. Y., CHIATTONE, C. S., Wang, Y., Thompson, M. C., et al. (2024) · Nature Reviews Clinical Oncology · doi:10.1038/s41571-024-00956-1 · Cited by 40
Zhang, D., Harris, H. M., Chen, J., Judy, J., James, G., Kelly, A., McIntosh, J., Tenn-McClellan, A., Ambing, E., Tan, Y. S., et al. (2023) · Blood · doi:10.1182/blood.2022016934 · Cited by 35
Self-citationGenomic and Epigenomic Alterations in Chronic Lymphocytic Leukemia
Nadeu, F., Díaz‐Navarro, A., Delgado, J., Puente, X. S., & Campo, E. (2020) · Annual Review of Pathology Mechanisms of Disease · doi:10.1146/annurev-pathmechdis-012419-032810 · Cited by 35
Cadot, S., Valle, C., Tosolini, M., Pont, F., Largeaud, L., Laurent, C., Fournié, J., Ysebaert, L., & Quillet‐Mary, A. (2020) · Biomarker Research · doi:10.1186/s40364-020-00253-w · Cited by 33
A resource for exploring the understudied human kinome for research and therapeutic opportunitiesPreprint
Moret, N., Liu, C., Gyori, B. M., Bachman, J. A., Steppi, A., Hug, C. B., Taujale, R., Huang, L., Berginski, M. E., Gomez, S. M., et al. (2020) · bioRxiv (Cold Spring Harbor Laboratory) · doi:10.1101/2020.04.02.022277 · Cited by 33
Ahn, I. E., Basumallik, N., Tian, X., Soto, S., & Wiestner, A. U. (2019) · Blood · doi:10.1182/blood.2019896688 · Cited by 31
Self-citationResisting the Resistance: Navigating BTK Mutations in Chronic Lymphocytic Leukemia (CLL)
Chirino, A., Montoya, S., Safronenka, A., & Taylor, J. (2023) · Genes · doi:10.3390/genes14122182 · Cited by 30
Clonal dynamics in chronic lymphocytic leukemia
Gutierrez, C., & Wu, C. J. (2019) · Blood Advances · doi:10.1182/bloodadvances.2019000367 · Cited by 30
Self-citationThe Evolving Landscape of Chronic Lymphocytic Leukemia on Diagnosis, Prognosis and Treatment
Carretero, C. P., González-Gascón-y-Marín, I., Rodríguez‐Vicente, A. E., Quijada‐Álamo, M., Hernández‐Rivas, J., Hernández‐Sánchez, M., & Hernández‐Rivas, J. M. (2021) · Diagnostics · doi:10.3390/diagnostics11050853 · Cited by 33
Mhibik, M., Gaglione, E. M., Eik, D., Kendall, E. K., Blackburn, A., Keyvanfar, K., Baptista, M. J., Ahn, I. E., Sun, C., Qi, J., et al. (2021) · Blood · doi:10.1182/blood.2020009686 · Cited by 30
Self-citationUnresolved questions in selection of therapies for treatment-naïve chronic lymphocytic leukemia
Bennett, R., Anderson, M. A., & Seymour, J. F. (2023) · Journal of Hematology & Oncology · doi:10.1186/s13045-023-01469-7 · Cited by 26
Update on the management of relapsed/refractory chronic lymphocytic leukemia
Bennett, R., & Seymour, J. F. (2024) · Blood Cancer Journal · doi:10.1038/s41408-024-01001-1 · Cited by 28
Asslaber, D., Qi, Y., Maeding, N., Steiner, M. J., Denk, U., Höpner, J. P., Hartmann, T. N., Zaborsky, N., Greil, R., & Egle, A. (2019) · Blood · doi:10.1182/blood.2019000973 · Cited by 24
Sequential and combination treatments with novel agents in chronic lymphocytic leukemia
Fürstenau, M., Hallek, M. J., & Eichhorst, B. F. (2019) · Haematologica · doi:10.3324/haematol.2018.208603 · Cited by 25
Alsadhan, A., Chen, J., Gaglione, E. M., Underbayev, C., Tuma, P. L., Tian, X., Freeman, L. A., Baskar, S., Nierman, P., Soto, S., et al. (2023) · Clinical Cancer Research · doi:10.1158/1078-0432.ccr-22-3217 · Cited by 23
Self-citationGhia, E. M., Rassenti, L. Z., Neuberg, D. S., Blanco, A., Yousif, F., Smith, E. N., McPherson, J. D., Hudson, T. J., Harismendy, O., Frazer, K. A., et al. (2019) · Blood · doi:10.1182/blood-2018-09-873695 · Cited by 22
Self-citationKielbassa-Elkadi, K., Haselager, M. V., Bax, D. J. C., van Driel, B. F., Dubois, J. M. N., Levin, M., Kersting, S., Svanberg, R., Niemann, C. U., Kater, A. P., et al. (2023) · Leukemia · doi:10.1038/s41375-023-01898-w · Cited by 21
Natural Barcodes for Longitudinal Single Cell Tracking of Leukemic and Immune Cell Dynamics
Penter, L., Gohil, S. H., & Wu, C. J. (2022) · Frontiers in Immunology · doi:10.3389/fimmu.2021.788891 · Cited by 20
Self-citationBödör, C., Kotmayer, L., László, T., Takács, F., Barna, G., Kiss, R., Sebestyén, E., Nagy, T., Hegyi, L. L., Mikala, G., et al. (2021) · British Journal of Haematology · doi:10.1111/bjh.17502 · Cited by 20
Precision diagnostics in chronic lymphocytic leukemia: Past, present and future
Mollstedt, J., Mansouri, L., & Rosenquist, R. (2023) · Frontiers in Oncology · doi:10.3389/fonc.2023.1146486 · Cited by 21
The genomic landscape of plasma cells in systemic light chain amyloidosis
Boyle, E. M., Ashby, C., Wardell, C. P., Rowczenio, D. M., Sachchithanantham, S., Wang, Y., Johnson, S., Bauer, M., Weinhold, N., Kaiser, M., et al. (2018) · Blood · doi:10.1182/blood-2018-08-872226 · Cited by 19
Clonal Evolution of High-Risk Chronic Lymphocytic Leukemia: A Contemporary Perspective
Kwok, M., & Wu, C. J. (2021) · Frontiers in Oncology · doi:10.3389/fonc.2021.790004 · Cited by 20
Self-citationKiss, R., Alpár, D., Gángó, A., Nagy, N., Eyüpoglu, E., Aczél, D., Matolcsy, A., Csomor, J., Mátrai, Z., & Bödör, C. (2018) · Haematologica · doi:10.3324/haematol.2018.202085 · Cited by 19
Morande, P. E., Sivina, M., Uriepero, A., Seija, N., Berca, C., Fresia, P., Landoni, A. I., Noia, J. M. D., Burger, J. A., & Oppezzo, P. (2019) · Blood · doi:10.1182/blood-2018-09-876292 · Cited by 19
Self-citationResistance Mechanisms to Targeted Agents in Chronic Lymphocytic Leukemia
Kittai, A. S., & Woyach, J. A. (2019) · The Cancer Journal · doi:10.1097/ppo.0000000000000406 · Cited by 19
Pozzo, F., Forestieri, G., Vit, F., Ianna, G., Tissino, E., Bittolo, T., Papotti, R., Gaglio, A., di Bergamo, L. T., Steffan, A., et al. (2024) · Leukemia · doi:10.1038/s41375-024-02301-y · Cited by 16
Bravo-González, A., Alasfour, M., Soong, D., Noy, J., & Pongas, G. N. (2024) · Cancers · doi:10.3390/cancers16203434 · Cited by 14
Acquired Mutations in Patients with Relapsed/Refractory Cll Who Progressed in the Alpine Study
Brown, J. R., Li, J., Eichhorst, B. F., Lamanna, N., O’Brien, S. M., Tam, C. S., Qiu, L., Huang, R., Shi, Y., Idoine, A., et al. (2025) · Blood Advances · doi:10.1182/bloodadvances.2024014206 · Cited by 14
On the architecture of translational research designed to control chronic lymphocytic leukemia
Hallek, M. J. (2018) · Hematology · doi:10.1182/asheducation-2018.1.1 · Cited by 14
Roeker, L. E., Feldman, T. A., Soumerai, J. D., Falco, V., Panton, G., Dorsey, C., Zelenetz, A. D., Falchi, L., Park, J. H., Straus, D. J., et al. (2022) · Clinical Cancer Research · doi:10.1158/1078-0432.ccr-22-0964 · Cited by 13
Kater, A. P., van Oers, M. H. J., van Norden, Y., van der Straten, L., Driessen, J., Posthuma, W. F. M., Schipperus, M. R., Chamuleau, M. E. D., Nijland, M., Doorduijn, J. K., et al. (2018) · Haematologica · doi:10.3324/haematol.2018.193854 · Cited by 13
Mutations Detected in Real World Clinical Sequencing during BTK Inhibitor Treatment in CLLPreprint
Brown, J. R., Mashima, K., Fernandes, S. M., Naeem, A. S., Shupe, S. J., Fardoun, R., & Davids, M. S. (2024) · Research Square · doi:10.21203/rs.3.rs-3837426/v1 · Cited by 14
Zapatka, M., Tausch, E., Öztürk, S., Yosifov, D. Y., Seiffert, M., Zenz, T., Schneider, C., Bloehdorn, J., Döhner, H., Mertens, D., et al. (2021) · Haematologica · doi:10.3324/haematol.2020.265777 · Cited by 12
Treatment Sequencing in Chronic Lymphocytic Leukemia in 2024: Where We Are and Where We Are Headed
Fresa, A., Innocenti, I., Tomasso, A., Stirparo, L., Mosca, A., Iadevaia, F., Autore, F., Ghia, P., & Laurenti, L. (2024) · Cancers · doi:10.3390/cancers16112011 · Cited by 12
A mini-review-cancer energy reprogramming on drug resistance and immune response
Liu, C., Yang, L., Gao, T., Yuan, X., Bajinka, O., & Wang, K. (2024) · Translational Oncology · doi:10.1016/j.tranon.2024.102099 · Cited by 11
Black, G. S., Huang, X., Qiao, Y., Tarapcsák, S., Rogers, K. A., Misra, S., Byrd, J. C., Marth, G., Stephens, D. M., & Woyach, J. A. (2022) · Blood · doi:10.1182/blood.2021015132 · Cited by 11
The molecular map of CLL and Richter's syndrome
Sud, A., Parry, E. M., & Wu, C. J. (2024) · Seminars in Hematology · doi:10.1053/j.seminhematol.2024.01.009 · Cited by 10
Self-citationPeng, H., Jabbari, J. S., Tian, L., Wang, C., You, Y., Chua, C. C., Anstee, N. S., Amin, N., Wei, A. H., Davidson, N., et al. (2025) · Genome Research · doi:10.1101/gr.279322.124 · Cited by 10
Metadata
- Authors
- Landau, D. A., Sun, C., Rosebrock, D., Herman, S. E. M., Fein, J., Sivina, M., Underbayev, C., Liu, D., Hoellenriegel, J., Ravichandran, S., Farooqui, M. Z. H., Zhang, W., Cibulskis, C., Zviran, A., Neuberg, D. S., Livitz, D., Bozic, I., Leshchiner, I., Getz, G., Burger, J. A., Wiestner, A., & Wu, C. J.
- Affiliations
- Broad Institute (US)
- National Institutes of Health (US)
- Tel Aviv University (IL)
- The University of Texas MD Anderson Cancer Center (US)
- Frederick National Laboratory for Cancer Research (US)
- Dana-Farber Cancer Institute (US)
- New York Genome Center (US)
- Corresponding author
- Wiestner, Adrian
- Wu, Catherine J.
- ORCID
- Venue
- Nature Communications
- Published
- 2017-12-19
- Volume
- 8
- Issue
- 1
- Pages
- 2185-2185
- ISSN
- 2041-1723 (ISSN-L)
- PMC
- PMC5736707
- OpenAlex
- W2773946416
- Cited by
- 176
- References
- 53
- Citations by year
- 2026: 3 · 2025: 10 · 2024: 19 · 2023: 19 · 2022: 16 · 2021: 30 · 2020: 28 · 2019: 34 · 2018: 16
- FWCI
- 12.41
- Type
- journal article
- Language
- en
- Open access
- gold
- doi.org
- Locations
- Nature Communications (publishedVersion, cc-by)
- Europe PMC (PubMed Central) (publishedVersion, cc-by)
- PubMed Central (publishedVersion, cc-by)
- PubMed (publishedVersion)
- Digital Access to Scholarship at Harvard (DASH) (Harvard University) (submittedVersion, cc-by)
- RePEc: Research Papers in Economics (submittedVersion)
- DOAJ (DOAJ: Directory of Open Access Journals) (submittedVersion)
- DOAJ (DOAJ: Directory of Open Access Journals) (submittedVersion, cc-by-sa)
- Funders
- American Association for Cancer Research
- Burroughs Wellcome Fund
- Leukemia and Lymphoma Society
- Entertainment Industry Foundation
- Broad Institute (U54HG003067)
- National Institutes of Health
- Stand Up To Cancer
- National Heart, Lung, and Blood Institute (R01HL116452, R01HL131768)
- National Human Genome Research Institute (U54HG003067)
- National Cancer Institute (U10CA180861, R01CA184922, R01CA216273, R01CA182461, P01CA206978)
- National Institute of Environmental Health Sciences (K01ES025431)
- Topics
- Health Sciences › Medicine › Hematology › Chronic Lymphocytic Leukemia Research
- Health Sciences › Medicine › Pathology and Forensic Medicine › Lymphoma Diagnosis and Treatment
- Life Sciences › Biochemistry, Genetics and Molecular Biology › Cancer Research › Cancer Genomics and Diagnostics
- Keywords
- chronic lymphocytic leukemia, ibrutinib, clonal evolution, drug resistance, BTK mutations, PLCG2 mutations, B cell receptor signaling, energy metabolism, cell cycle, transcriptome, exome sequencing, treatment outcomes
- MeSH terms
- Rituximab, Exome Sequencing, Agammaglobulinaemia Tyrosine Kinase, Adenine, Adult, Aged, Aged, 80 and over, Antineoplastic Combined Chemotherapy Protocols, Female, Humans, Longitudinal Studies, Male, Middle Aged, Mutation, Piperidines, Prognosis, Protein-Tyrosine Kinases, Pyrazoles, Pyrimidines, Signal Transduction, Leukemia, Lymphocytic, Chronic, B-Cell, Down-Regulation, Gene Expression Regulation, Neoplastic, Treatment Outcome, Disease Progression, Drug Resistance, Neoplasm, Phospholipase C gamma, Molecular Targeted Therapy, Clonal Evolution
About these checks
Registry, retraction, Cites and statistics results are computed, not judged, with one exception: a printed reference that no index lists is read once by a model before it counts as a citation error. Claims are extracted by a model and kept only when their quote appears verbatim in the text; each cited source is then checked, with a model’s help, for whether it says what the claim relies on. Those verdicts can be wrong — read the claim’s quote and the cited source before relying on one.
Statistics and arithmetic are recomputed, not judged.
Confidence bands are shown only for fields calibrated on our annotated test set. None is calibrated yet, so no band is shown.
What counts as a claim ›How we measure confidence ›How we check this ›
Are you an author, or do you see a problem with this page? Request a review
