

The DOI matches its Crossref record; 44 of the 44 references it cites were found in a registry or an index.
Nanodroplet processing platform for deep and quantitative proteome profiling of 10–100 mammalian cells
Open accessAbstract
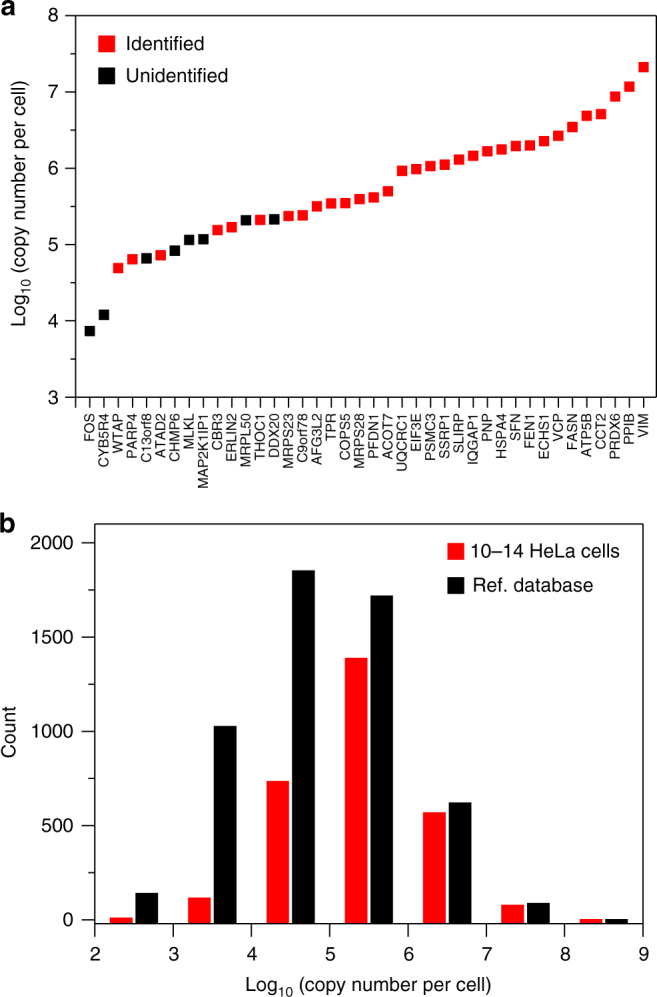
Nanoscale or single-cell technologies are critical for biomedical applications. However, current mass spectrometry (MS)-based proteomic approaches require samples comprising a minimum of thousands of cells to provide in-depth profiling. Here, we report the development of a nanoPOTS (nanodroplet processing in one pot for trace samples) platform for small cell population proteomics analysis. NanoPOTS enhances the efficiency and recovery of sample processing by downscaling processing volumes to <200 nL to minimize surface losses. When combined with ultrasensitive liquid chromatography-MS, nanoPOTS allows identification of ~1500 to ~3000 proteins from ~10 to ~140 cells, respectively. By incorporating the Match Between Runs algorithm of MaxQuant, >3000 proteins are consistently identified from as few as 10 cells. Furthermore, we demonstrate quantification of ~2400 proteins from single human pancreatic islet thin sections from type 1 diabetic and control donors, illustrating the application of nanoPOTS for spatially resolved proteome measurements from clinical tissues.
Overview
The claims and statistics of this paper haven’t been checked yet.
Free: it reads the open-access text and checks the first 5 claims that cite a source we can check. Create a free account to check every claim.
Integrity signals
Registry
Cites
Statistics
Figures




Verification
Claims the paper makes
The claims and statistics of this paper haven’t been checked yet.
Free: it reads the open-access text and checks the first 5 claims that cite a source we can check. Create a free account to check every claim.
Claims other papers make about this one
Each is checked against this paper’s own text: does it say what the citing paper says it does?
In the citing paper
“To improve the sensitivity and automation of top-down sample preparation, Zhu and coworkers have adapted the nanoPOTS (nanodroplet processing in one pot for trace samples) [37] technology for top-down proteomics.”
From Top-down proteomics: challenges, innovations, and applications in basic and clinical research (2020) · cites this paper as [37]
In the citing paper
“The nanoPOTS platform enabled the identification and quantitation of ~3000 proteins from 10 HeLa cells and ~2400 proteins from a single human pancreatic islet thin section.31”
From Sensitive Top-Down Proteomics Analysis of a Low Number of Mammalian Cells Using a Nanodroplet Sample Processing Platform (2020) · cites this paper as [31]
Self-check
Percentages, sums and reported differences re-computed from the paper’s own numbers.
The self-check needs the paper’s full text.
Citations
Cites
NIH Image to ImageJ: 25 years of image analysis
Schneider, C. A., Rasband, W. S., & Eliceiri, K. W. (2012) · Nature Methods · doi:10.1038/nmeth.2089 · Cited by 64,638
The Perseus computational platform for comprehensive analysis of (prote)omics data
Tyanova, S., Temu, T., Sinitcyn, P., Carlson, A., Hein, M. Y., Geiger, T., Mann, M., & Cox, J. (2016) · Nature Methods · doi:10.1038/nmeth.3901 · Cited by 8,803
The MaxQuant computational platform for mass spectrometry-based shotgun proteomics
Tyanova, S., Temu, T., & Cox, J. (2016) · Nature Protocols · doi:10.1038/nprot.2016.136 · Cited by 4,797
2016 update of the PRIDE database and its related tools
Vizcaíno, J. A., Csordas, A., del-Toro, N., Dianes, J. A., Griss, J., Lavidas, I., Mayer, G., Perez-Riverol, Y., Reisinger, F., Ternent, T., et al. (2016) · Nucleic Acids Research · doi:10.1093/nar/gkv1145 · Cited by 3,451
Bendall, S. C., Simonds, E. F., Qiu, P., Amir, E.-A. D., Krutzik, P. O., Finck, R., Bruggner, R. V., Melamed, R., Trejo, A., Ornatsky, O. I., et al. (2011) · Science · doi:10.1126/science.1198704 · Cited by 2,279
Massively parallel single-cell RNA-seq for marker-free decomposition of tissues into cell types
Jaitin, D. A., Kenigsberg, E., Keren-Shaul, H., Elefant, N., Paul, F., Zaretsky, I., Mildner, A., Cohen, N., Jung, S., Tanay, A., et al. (2014) · Science · doi:10.1126/science.1247651 · Cited by 1,795
Single-cell sequencing-based technologies will revolutionize whole-organism science
Shapiro, E., Biezuner, T., & Linnarsson, S. (2013) · Nature Reviews Genetics · doi:10.1038/nrg3542 · Cited by 1,177
BoxPlotR: a web tool for generation of box plots
Spitzer, M., Wildenhain, J., Rappsilber, J., & Tyers, M. (2014) · Nature Methods · doi:10.1038/nmeth.2811 · Cited by 815
A “Proteomic Ruler” for Protein Copy Number and Concentration Estimation without Spike-in Standards
Wiśniewski, J. R., Hein, M. Y., Cox, J., & Mann, M. (2014) · Molecular & Cellular Proteomics · doi:10.1074/mcp.m113.037309 · Cited by 690
High-throughput microfluidic single-cell RT-qPCR
White, A. K., VanInsberghe, M., Petriv, O. I., Hamidi, M., Sikorski, D., Marra, M. A., Piret, J., Aparicio, S., & Hansen, C. L. (2011) · Proceedings of the National Academy of Sciences · doi:10.1073/pnas.1019446108 · Cited by 440
Cited by
The human body at cellular resolution: the NIH Human Biomolecular Atlas Program
HuBMAP Consortium, Writing Group, Snyder, M. P., Lin, S., Posgai, A., Atkinson, M., Regev, A., Rood, J., Rozenblatt-Rosen, O., Gaffney, L., et al. (2019) · Nature · doi:10.1038/s41586-019-1629-x · Cited by 595
Self-citationSpatial proteomics: a powerful discovery tool for cell biology
Lundberg, E., & Borner, G. H. H. (2019) · Nature Reviews Molecular Cell Biology · doi:10.1038/s41580-018-0094-y · Cited by 591
Ultra‐high sensitivity mass spectrometry quantifies single‐cell proteome changes upon perturbation
Brunner, A., Thielert, M., Vasilopoulou, C., Ammar, C., Coscia, F., Mund, A., Hoerning, O. B., Bache, N., Apalategui, A., Lubeck, M., et al. (2022) · Molecular Systems Biology · doi:10.15252/msb.202110798 · Cited by 544
Single-cell Proteomics: Progress and Prospects
Kelly, R. T. (2020) · Molecular & Cellular Proteomics · doi:10.1074/mcp.r120.002234 · Cited by 356
“Mol Cell Proteomics (2020) 19(11) 1739–1748 1741”
BackgroundMethodInfluentialSelf-citationA Critical Review of Bottom-Up Proteomics: The Good, the Bad, and the Future of This Field
Dupree, E. J., Jayathirtha, M., Yorkey, H., Mihasan, M., Petre, B. A., & Darie, C. C. (2020) · Proteomes · doi:10.3390/proteomes8030014 · Cited by 353
“They allow in-solution digestion and processing of single cells and are reproducible [64].”
Background
Metadata
- Authors
- Zhu, Y., Piehowski, P. D., Zhao, R., Chen, J., Shen, Y., Moore, R. J., Shukla, A. K., Petyuk, V. A., Campbell-Thompson, M., Mathews, C. E., Smith, R. D., Qian, W.-J., & Kelly, R. T.
- Affiliations
- Pacific Northwest National Laboratory (US)
- University of Florida (US)
- Corresponding author
- Kelly, Ryan T.
- ORCID
- Venue
- Nature Communications
- Published
- 2018-02-28
- Volume
- 9
- Issue
- 1
- Pages
- 882-882
- ISSN
- 2041-1723 (ISSN-L)
- PMC
- PMC5830451
- OpenAlex
- W2807662170
- Cited by
- 587
- References
- 44
- Citations by year
- 2026: 58 · 2025: 62 · 2024: 99 · 2023: 80 · 2022: 83 · 2021: 80 · 2020: 56 · 2019: 43 · 2018: 26
- FWCI
- 22.11
- Type
- journal article
- Language
- en
- Open access
- gold
- doi.org
- Licence
- cc-by
- creativecommons.org/licenses/by/4.0 (tdm)
- creativecommons.org/licenses/by/4.0 (vor)
- Locations
- Nature Communications (publishedVersion, cc-by)
- Europe PMC (PubMed Central) (publishedVersion, cc-by)
- PubMed Central (publishedVersion, cc-by)
- PubMed (publishedVersion)
- OSTI OAI (U.S. Department of Energy Office of Scientific and Technical Information) (submittedVersion)
- RePEc: Research Papers in Economics (submittedVersion)
- DOAJ (DOAJ: Directory of Open Access Journals) (submittedVersion, cc-by-sa)
- DOAJ (DOAJ: Directory of Open Access Journals) (submittedVersion)
- Funders
- U.S. Department of Energy (GM103493)
- National Institutes of Health (1s10od016350-01, 8p41gm103493-10, P41-GM103493, GM103493)
- National Cancer Institute (R33CA225248)
- National Institute of General Medical Sciences (P41-GM103493)
- National Institute of Diabetes and Digestive and Kidney Diseases (UC4DK104167, DP3DK110844)
- National Institute of Biomedical Imaging and Bioengineering (R21EB020976)
- Biological and Environmental Research
- Pacific Northwest National Laboratory
- Topics
- Physical Sciences › Chemistry › Spectroscopy › Advanced Proteomics Techniques and Applications
- Physical Sciences › Chemistry › Spectroscopy › Mass Spectrometry Techniques and Applications
- Life Sciences › Biochemistry, Genetics and Molecular Biology › Molecular Biology › Metabolomics and Mass Spectrometry Studies
- Keywords
- single-cell proteomics, liquid chromatography-mass spectrometry, protein quantification, pancreatic islets, type 1 diabetes, spatial proteomics, sample volume reduction
- MeSH terms
- Humans, Islets of Langerhans, Proteins, Mass Spectrometry, Proteome, Gene Expression Profiling, Proteomics
About these checks
Registry, retraction, Cites and statistics results are computed, not judged, with one exception: a printed reference that no index lists is read once by a model before it counts as a citation error. Claims are extracted by a model and kept only when their quote appears verbatim in the text; each cited source is then checked, with a model’s help, for whether it says what the claim relies on. Those verdicts can be wrong — read the claim’s quote and the cited source before relying on one.
Statistics and arithmetic are recomputed, not judged.
Confidence bands are shown only for fields calibrated on our annotated test set. None is calibrated yet, so no band is shown.
What counts as a claim ›How we measure confidence ›How we check this ›
Are you an author, or do you see a problem with this page? Request a review
How to cite
Cite CoChat for the checks on this page, and the paper for its own findings.
- This page
- CoChat. (2026). Citation check: Nanodroplet processing platform for deep and quantitative proteome profiling of 10–100 mammalian cells. https://app.cochat.ai/papers/10.1038/s41467-018-03367-w
- The paper
- Zhu, Y., Piehowski, P. D., Zhao, R., Chen, J., Shen, Y., Moore, R. J., Shukla, A. K., Petyuk, V. A., Campbell-Thompson, M., Mathews, C. E., Smith, R. D., Qian, W.-J., & Kelly, R. T. (2018). Nanodroplet processing platform for deep and quantitative proteome profiling of 10–100 mammalian cells. Nature Communications. https://doi.org/10.1038/s41467-018-03367-w
Data sources
Bibliographic data: Semantic Scholar, OpenAlex, Crossref.
Contains information from the Semantic Scholar Academic Graph Datasets, made available under the ODC Attribution License (ODC-BY 1.0).
Semantic Scholar’s data is described in: Kinney, R., et al. (2023). The Semantic Scholar Open Data Platform. arXiv:2301.10140.
