Cited by 101Motor Control and AdaptationNeural dynamics and brain functionMemory and Neural Mechanisms

The DOI matches its Crossref record; 66 of the 67 references it cites were found in a registry or an index, and 1 are not checked yet.

Different population dynamics in the supplementary motor area and motor cortex during reaching

Open access
Lara, A. H., Cunningham, J. P., Churchland, M. M.·2018·Nature Communications

Abstract

Neural populations perform computations through their collective activity. Different computations likely require different population-level dynamics. We leverage this assumption to examine neural responses recorded from the supplementary motor area (SMA) and motor cortex. During visually guided reaching, the respective roles of these areas remain unclear; neurons in both areas exhibit preparation-related activity and complex patterns of movement-related activity. To explore population dynamics, we employ a novel "hypothesis-guided" dimensionality reduction approach. This approach reveals commonalities but also stark differences: linear population dynamics, dominated by rotations, are prominent in motor cortex but largely absent in SMA. In motor cortex, the observed dynamics produce patterns resembling muscle activity. Conversely, the non-rotational patterns in SMA co-vary with cues regarding when movement should be initiated. Thus, while SMA and motor cortex display superficially similar single-neuron responses during visually guided reaching, their different population dynamics indicate they are likely performing quite different computations.

Overview

The claims and statistics of this paper haven’t been checked yet.

Run the check — free, no account needed. It reads the open-access text and checks the sources it cites.

A few free checks a day · papers already verified open instantly · results are public

Integrity signals

Registry

Crossref · 10.1038/s41467-018-05146-z

Cites

66 of 67 references verified0 citation errors · 0 not checkable

Statistics

Figures

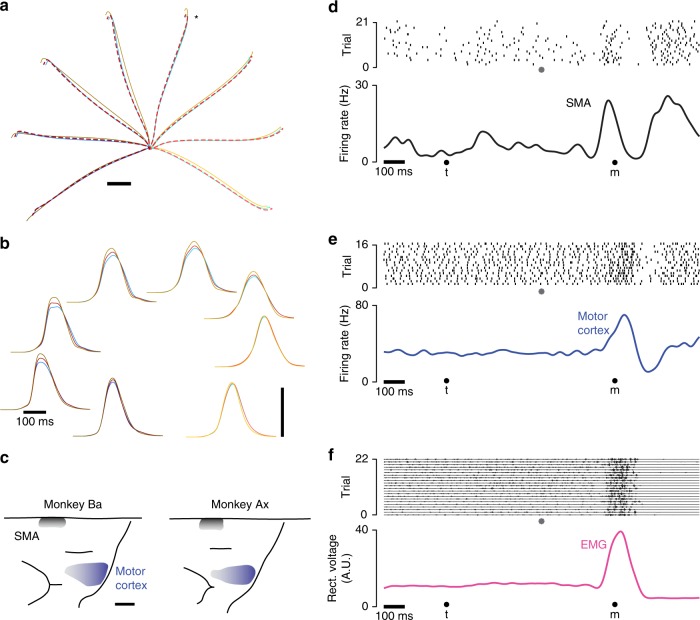
Fig. 1 Illustration of behavior and physiological recordings. a Average reach trajectories for the eight directions and three contexts. Red, blue and yellow traces show average hand position during curing cue-initiated, self-initiated, and quasi-automatic reaches. Traces are shaded from dark to light based on reach direction. Red traces are dashed to allow visualization of blue traces with which they often overlap. Data shown are for monkey Ba, and were similar for monkey Ax. Star indicates the reach direction for which neural/muscle data are shown in panel (d). Scale bar shows 2 cm. b Average hand-velocity profiles corresponding to the trajectories in panel (a). Scale bar shows 1 m/s. c Reconstructions of surface landmarks based on MRIs (see Supplementary Figure 1 for example MRI sections). Shaded regions indicate where penetrations entered cortex, and are shaded darker to indicate where recordings included deeper locations. Scale bar shows 5 mm. d Raster plot of spikes recorded from one SMA neuron for one reach direction during the quasi-automatic condition. Data in this and subsequent panels are for monkey Ax. Data to the left of the gray symbol are aligned to target onset (t) and data to the right are aligned to movement onset (m). Filtering and averaging of spike-trains yields a smooth firing rate versus time (black trace) that interpolates across the concatenation at the time indicated by the gray symbol. Filtering used a narrow (20 ms) Gaussian to ensure high-frequency aspects of the response were not lost. e Same as in d but for a neuron recorded from motor cortex. f Similar to d and e but for EMG recorded from the medial deltoid. Voltage traces show a mixture of discrete and (especially during movement) overlapping events. Discontinuities resulting from concatenation of target-locked and movement-locked data are small and barely visible. Rectification, filtering and averaging produces a continuous trace summarizing average EMG intensity (magenta trace)
Fig. 1 Illustration of behavior and physiological recordings. a Average reach trajectories for the eight directions and three contexts. Red, blue and yellow traces show average hand position during curing cue-initiated, self-initiated, and quasi-automatic reaches. Traces are shaded from dark to light based on reach direction. Red traces are dashed to allow visualization of blue traces with which they often overlap. Data shown are for monkey Ba, and were similar for monkey Ax. Star indicates the reach direction for which neural/muscle data are shown in panel (d). Scale bar shows 2 cm. b Average hand-velocity profiles corresponding to the trajectories in panel (a). Scale bar shows 1 m/s. c Reconstructions of surface landmarks based on MRIs (see Supplementary Figure 1 for example MRI sections). Shaded regions indicate where penetrations entered cortex, and are shaded darker to indicate where recordings included deeper locations. Scale bar shows 5 mm. d Raster plot of spikes recorded from one SMA neuron for one reach direction during the quasi-automatic condition. Data in this and subsequent panels are for monkey Ax. Data to the left of the gray symbol are aligned to target onset (t) and data to the right are aligned to movement onset (m). Filtering and averaging of spike-trains yields a smooth firing rate versus time (black trace) that interpolates across the concatenation at the time indicated by the gray symbol. Filtering used a narrow (20 ms) Gaussian to ensure high-frequency aspects of the response were not lost. e Same as in d but for a neuron recorded from motor cortex. f Similar to d and e but for EMG recorded from the medial deltoid. Voltage traces show a mixture of discrete and (especially during movement) overlapping events. Discontinuities resulting from concatenation of target-locked and movement-locked data are small and barely visible. Rectification, filtering and averaging produces a continuous trace summarizing average EMG intensity (magenta trace)CC BY · PubMed Central
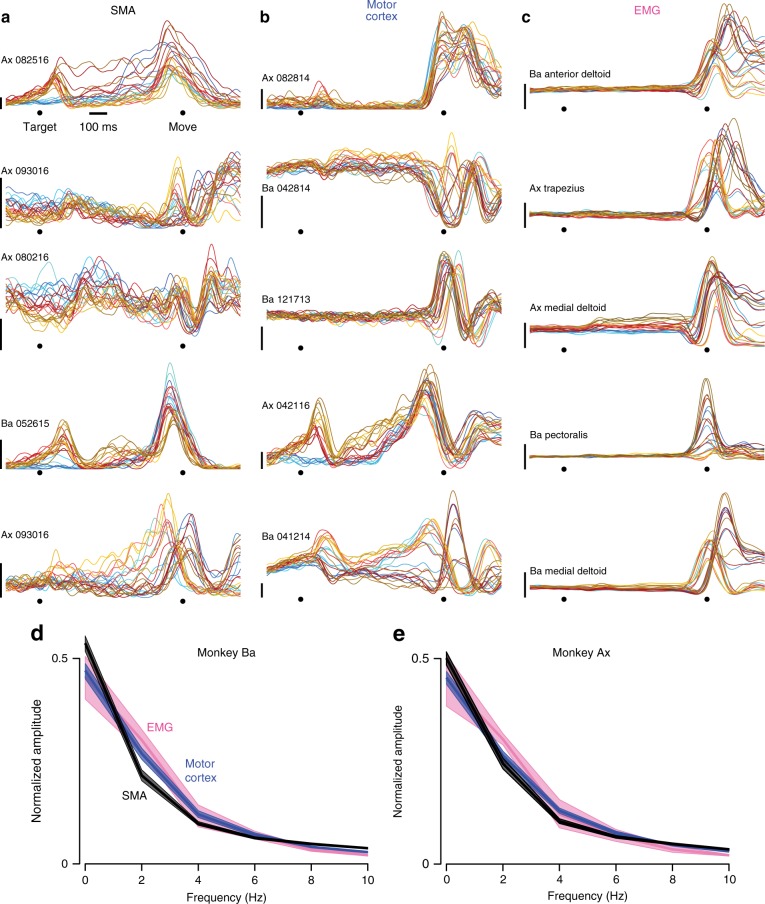
Fig. 2 Example responses of single neurons and muscles. a Example responses of five neurons recorded from SMA. Each colored trace plots the trial-averaged firing rate for one condition, computed as illustrated in Fig. 1. Red, blue, and yellow traces correspond to the three contexts. Darker/lighter traces are for reaches to the left/right. (Same color scheme as in Fig. 1a, b). Scale bars indicate 20 spikes/s. b Same as a, but for five neurons recorded from motor cortex. c Same as a and b, but for five example muscle recordings. The bottom of the vertical scale bars indicates zero EMG activity, but the scale is otherwise arbitrary. d Frequency spectrum, computed via the Fourier transform, for the three populations. Frequency content was computed per neuron/muscle, over the temporal interval from −250 to 250 ms relative to movement onset. Frequency content was then normalized and averaged. Envelopes show 95% confidence intervals computed via bootstrap, resampling neurons/muscles. Data are for monkey Ba. e Same as d, but for monkey Ax
Fig. 2 Example responses of single neurons and muscles. a Example responses of five neurons recorded from SMA. Each colored trace plots the trial-averaged firing rate for one condition, computed as illustrated in Fig. 1. Red, blue, and yellow traces correspond to the three contexts. Darker/lighter traces are for reaches to the left/right. (Same color scheme as in Fig. 1a, b). Scale bars indicate 20 spikes/s. b Same as a, but for five neurons recorded from motor cortex. c Same as a and b, but for five example muscle recordings. The bottom of the vertical scale bars indicates zero EMG activity, but the scale is otherwise arbitrary. d Frequency spectrum, computed via the Fourier transform, for the three populations. Frequency content was computed per neuron/muscle, over the temporal interval from −250 to 250 ms relative to movement onset. Frequency content was then normalized and averaged. Envelopes show 95% confidence intervals computed via bootstrap, resampling neurons/muscles. Data are for monkey Ba. e Same as d, but for monkey AxCC BY · PubMed Central
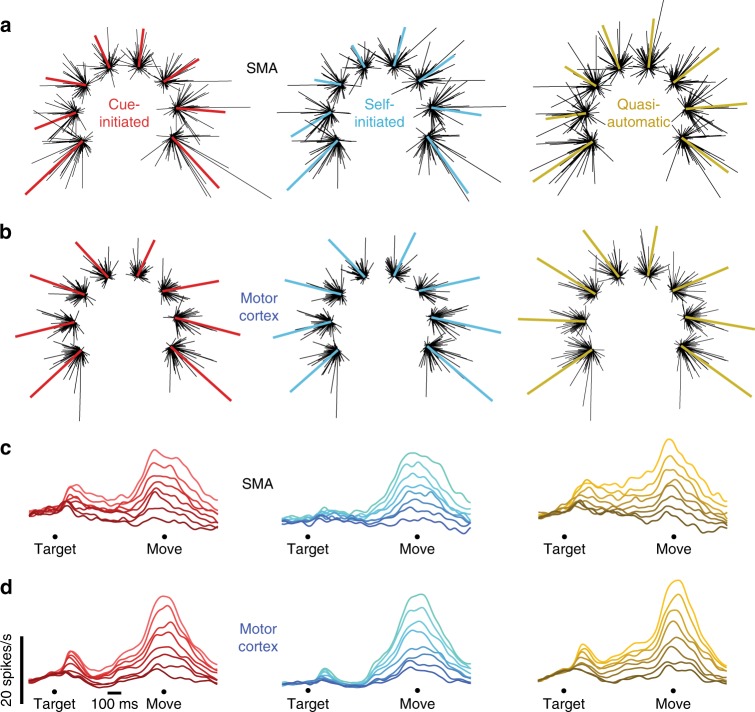
Fig. 3 Population vectors and population PSTHs for monkey Ba. a SMA population vectors for each of the three contexts. Each cluster of lines corresponds to one of the eight reach directions. The length of each black line indicates the firing rate of one neuron for that direction and context, and points in that neuron’s preferred direction. Colored traces plot (on a different scale) the sum of those vectors. For each neuron, the preferred direction was computed based on firing rates across all directions and contexts. b Motor cortex population vectors. Scaling is arbitrary and differs between the two brain areas, as they had different average firing rates (see main text). c SMA population PSTHs for the three contexts. Shading is ordered from most-preferred direction (lightest) to least-preferred (darkest) within each context. d Motor cortex population PSTHs
Fig. 3 Population vectors and population PSTHs for monkey Ba. a SMA population vectors for each of the three contexts. Each cluster of lines corresponds to one of the eight reach directions. The length of each black line indicates the firing rate of one neuron for that direction and context, and points in that neuron’s preferred direction. Colored traces plot (on a different scale) the sum of those vectors. For each neuron, the preferred direction was computed based on firing rates across all directions and contexts. b Motor cortex population vectors. Scaling is arbitrary and differs between the two brain areas, as they had different average firing rates (see main text). c SMA population PSTHs for the three contexts. Shading is ordered from most-preferred direction (lightest) to least-preferred (darkest) within each context. d Motor cortex population PSTHsCC BY · PubMed Central
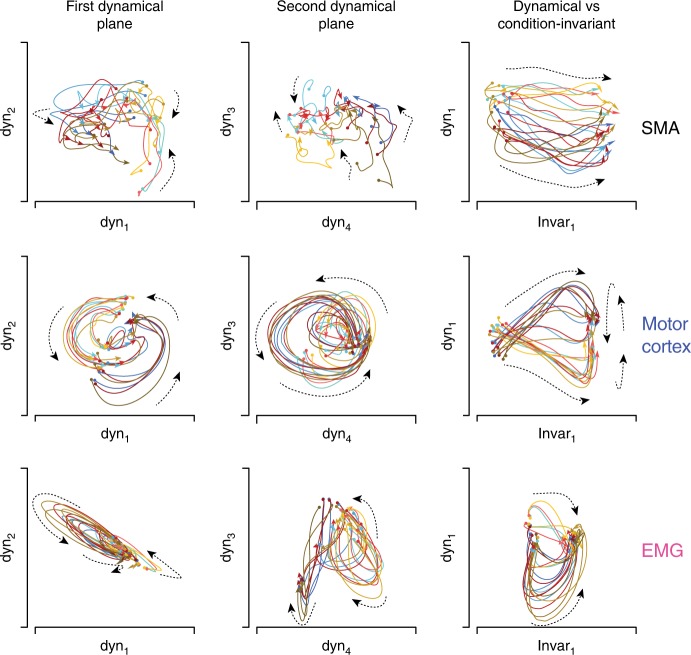
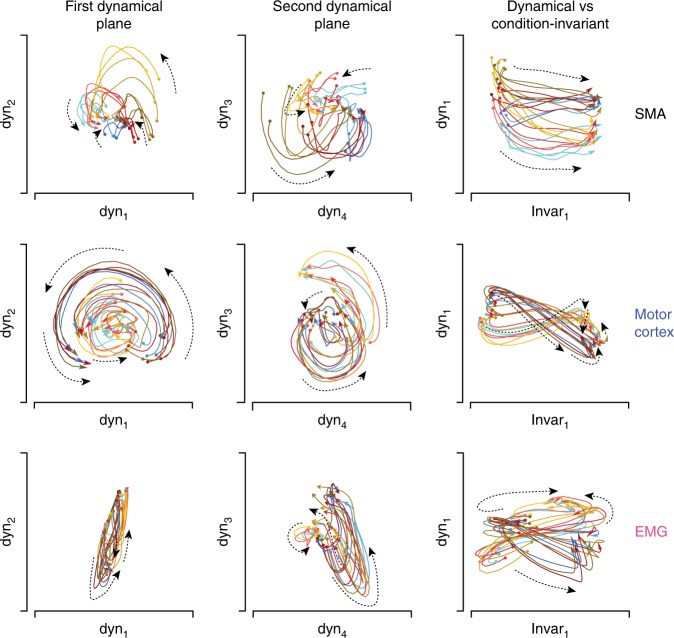
Fig. 4 State-space plots of the latent variables identified by HDR for monkey Ba. HDR was applied separately for SMA, motor cortex, and muscle populations. Each sub-panel plots the joint evolution of two latent variables (equivalent to a projection of the full neural state onto two dimensions). Each colored trajectory corresponds to one condition and plots the values of the latent variables from −80 to 150 ms relative to movement onset. The beginning and end of each trajectory is indicated by a circle and arrow, respectively. Color-coding is as in Figs. 1a, b and 2a–c: red, blue, and yellow trajectories correspond to the three contexts, while darker/lighter traces correspond to leftward/rightward movements. Dashed lines are included to aid visualization and indicate the local direction of flow (this was often less consistent for SMA and the muscles than for motor cortex). Scaling is arbitrary but the same scale is always used for the horizontal and vertical axis within each subpanel
Fig. 4 State-space plots of the latent variables identified by HDR for monkey Ba. HDR was applied separately for SMA, motor cortex, and muscle populations. Each sub-panel plots the joint evolution of two latent variables (equivalent to a projection of the full neural state onto two dimensions). Each colored trajectory corresponds to one condition and plots the values of the latent variables from −80 to 150 ms relative to movement onset. The beginning and end of each trajectory is indicated by a circle and arrow, respectively. Color-coding is as in Figs. 1a, b and 2a–c: red, blue, and yellow trajectories correspond to the three contexts, while darker/lighter traces correspond to leftward/rightward movements. Dashed lines are included to aid visualization and indicate the local direction of flow (this was often less consistent for SMA and the muscles than for motor cortex). Scaling is arbitrary but the same scale is always used for the horizontal and vertical axis within each subpanelCC BY · PubMed Central
Fig. 5 State-space plots for monkey Ax. Format as in Fig. 4. Scaling is arbitrary but the same scale is always used for the horizontal and vertical axis within each subpanel. Scaling is sometimes altered across subpanels. In particular, for motor cortex, scaling was reduced for the third column to allow plotting of the first condition-independent latent variable, which had a very large magnitude
Fig. 5 State-space plots for monkey Ax. Format as in Fig. 4. Scaling is arbitrary but the same scale is always used for the horizontal and vertical axis within each subpanel. Scaling is sometimes altered across subpanels. In particular, for motor cortex, scaling was reduced for the third column to allow plotting of the first condition-independent latent variable, which had a very large magnitudeCC BY · PubMed Central
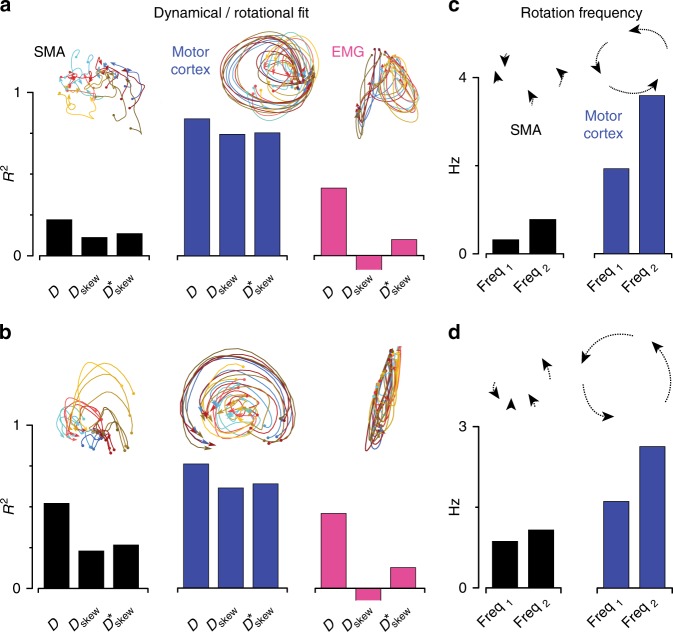
Fig. 6 Quantification of dynamical structure. Insets indicate the nature of the structure being quantified. a Fit quality provided by unconstrained (D) and constrained (Dskew and Dskew^(*)) linear dynamical fits. Fits are made over a 200 ms window, starting at movement onset, during which firing rates are changing rapidly. Results were robust to reasonable window sizes, so long as they included the time when responses were in rapid flux. For example, all p-values quoted in the text are lower (more significant) when using an earlier window: from 80 ms before movement onset until 150 ms after. Negative values, in the case of EMG, have been truncated. Data are for monkey Ba. b Same as a but for monkey Ax. c Rotational frequencies derived from Dskew^(*) for SMA and motor cortex. Data are for monkey Ba. d Same as c but for monkey Ax
Fig. 6 Quantification of dynamical structure. Insets indicate the nature of the structure being quantified. a Fit quality provided by unconstrained (D) and constrained (Dskew and Dskew^(*)) linear dynamical fits. Fits are made over a 200 ms window, starting at movement onset, during which firing rates are changing rapidly. Results were robust to reasonable window sizes, so long as they included the time when responses were in rapid flux. For example, all p-values quoted in the text are lower (more significant) when using an earlier window: from 80 ms before movement onset until 150 ms after. Negative values, in the case of EMG, have been truncated. Data are for monkey Ba. b Same as a but for monkey Ax. c Rotational frequencies derived from Dskew^(*) for SMA and motor cortex. Data are for monkey Ba. d Same as c but for monkey AxCC BY · PubMed Central
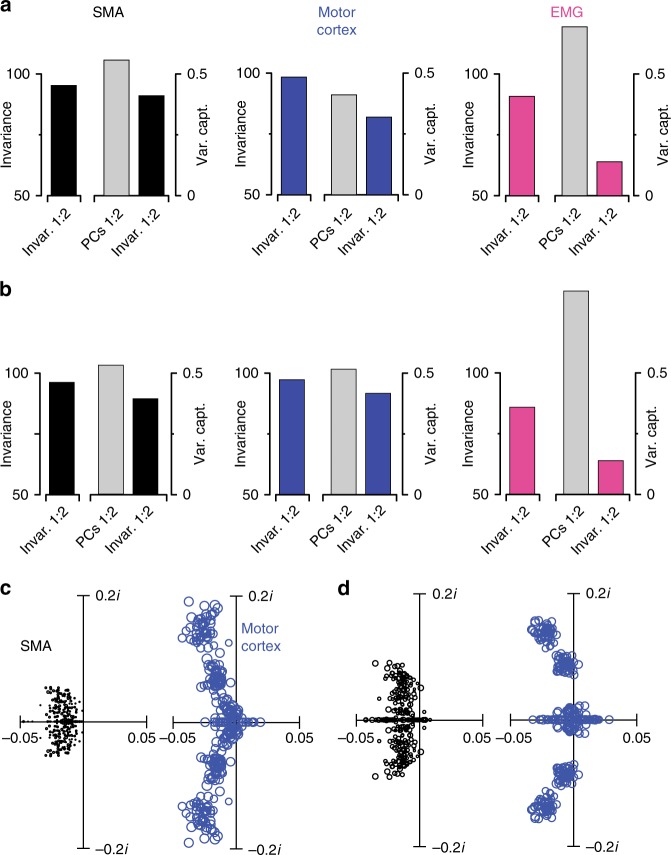
Fig. 7 Quantification of HDR-based condition-invariant structure and PCA-based dynamical structure. a Quantification of the structure captured by the condition-invariant dimensions. In each subpanel, the leftmost bar indicates the empirical condition invariance of activity in the condition-invariant dimensions. The right plot indicates the total data variance captured by the two condition-invariant dimensions and that captured by the first two PCs (gray bar). These analyses focus on the time from −100 ms before movement onset until 200 ms after movement onset. This is the epoch during which the signal in the condition-invariant dimensions was changing rapidly. Data are for monkey Ba. b Same as a but for monkey Ax. c Eigenvalue spectra when fitting linear dynamics to the population response projected onto the top six principal components (PCs), rather than using HDR. The analysis was conducted for 100 bootstrap repetitions, each time re-drawing a new population of neurons (with replacement) from the recorded population. Fitting linear dynamics resulted in a set of six eigenvalues per bootstrap repetition. For visualization, only the first 50 sets of eigenvalues are shown. Circle sizes are proportional to fit quality. Data are for monkey Ba. d. Same analysis for monkey Ax
Fig. 7 Quantification of HDR-based condition-invariant structure and PCA-based dynamical structure. a Quantification of the structure captured by the condition-invariant dimensions. In each subpanel, the leftmost bar indicates the empirical condition invariance of activity in the condition-invariant dimensions. The right plot indicates the total data variance captured by the two condition-invariant dimensions and that captured by the first two PCs (gray bar). These analyses focus on the time from −100 ms before movement onset until 200 ms after movement onset. This is the epoch during which the signal in the condition-invariant dimensions was changing rapidly. Data are for monkey Ba. b Same as a but for monkey Ax. c Eigenvalue spectra when fitting linear dynamics to the population response projected onto the top six principal components (PCs), rather than using HDR. The analysis was conducted for 100 bootstrap repetitions, each time re-drawing a new population of neurons (with replacement) from the recorded population. Fitting linear dynamics resulted in a set of six eigenvalues per bootstrap repetition. For visualization, only the first 50 sets of eigenvalues are shown. Circle sizes are proportional to fit quality. Data are for monkey Ba. d. Same analysis for monkey AxCC BY · PubMed Central
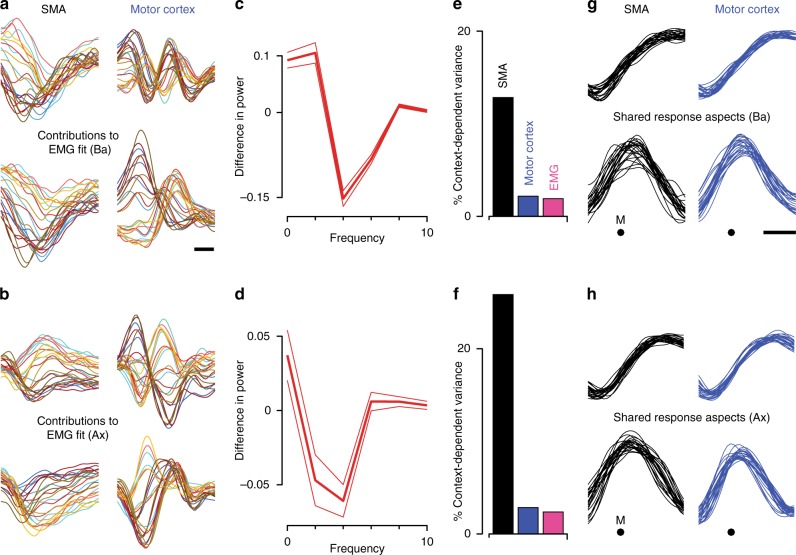
Fig. 8 Potential contributions to outputs and internal computations. a Relative contributions of SMA and motor cortex when fitting muscle activity with neural activity. Analysis is based on the four dynamical dimensions for SMA, motor cortex, and the muscles. Activity in each EMG dimension was regressed against eight dimensions of neural activity, four each from SMA and motor cortex. The fit was the sum of contributions from SMA and motor cortex, shown separately in the left and right columns. Average R2 was 0.58. For visualization, contributions are shown for two of the four muscle dimensions, chosen to highlight the greater contribution of motor cortex to multi-phasic structure. Each trace corresponds to one condition, plotted versus time over a 500 ms period starting 150 ms before movement onset (scale bar shows 100 ms). Data are for monkey Ba. b Same analysis for monkey Ax. The average R2 was 0.72. c Quantification of the effects illustrated in panel a. Difference in normalized power, between SMA and motor cortex contributions, as a function of frequency. Positive values indicate greater power in SMA, negative values indicate greater power in motor cortex. Averages are taken across all conditions, and across all four dimensions of the EMG activity being fit. Flanking traces shown standard errors. d Same analysis for monkey Ax. e Percentage of total response variance due to activity varying with context. Data are for monkey Ba. f Same analysis for monkey Ax. g Response aspects that were most strongly shared between SMA and motor cortex, found via canonical correlation analysis. Dimensions were found within the space spanned by the six HDR dimensions, including the two condition-invariant dimensions and the four dynamical dimensions. Top and bottom rows plot the first and second canonical correlates. These are plotted versus time around the time of movement onset (M). Each trace corresponds to one condition. Scale bar shows 100 ms. Data are for monkey Ba. h Same analysis for monkey Ax
Fig. 8 Potential contributions to outputs and internal computations. a Relative contributions of SMA and motor cortex when fitting muscle activity with neural activity. Analysis is based on the four dynamical dimensions for SMA, motor cortex, and the muscles. Activity in each EMG dimension was regressed against eight dimensions of neural activity, four each from SMA and motor cortex. The fit was the sum of contributions from SMA and motor cortex, shown separately in the left and right columns. Average R2 was 0.58. For visualization, contributions are shown for two of the four muscle dimensions, chosen to highlight the greater contribution of motor cortex to multi-phasic structure. Each trace corresponds to one condition, plotted versus time over a 500 ms period starting 150 ms before movement onset (scale bar shows 100 ms). Data are for monkey Ba. b Same analysis for monkey Ax. The average R2 was 0.72. c Quantification of the effects illustrated in panel a. Difference in normalized power, between SMA and motor cortex contributions, as a function of frequency. Positive values indicate greater power in SMA, negative values indicate greater power in motor cortex. Averages are taken across all conditions, and across all four dimensions of the EMG activity being fit. Flanking traces shown standard errors. d Same analysis for monkey Ax. e Percentage of total response variance due to activity varying with context. Data are for monkey Ba. f Same analysis for monkey Ax. g Response aspects that were most strongly shared between SMA and motor cortex, found via canonical correlation analysis. Dimensions were found within the space spanned by the six HDR dimensions, including the two condition-invariant dimensions and the four dynamical dimensions. Top and bottom rows plot the first and second canonical correlates. These are plotted versus time around the time of movement onset (M). Each trace corresponds to one condition. Scale bar shows 100 ms. Data are for monkey Ba. h Same analysis for monkey AxCC BY · PubMed Central

Verification

Claims the paper makes

The claims and statistics of this paper haven’t been checked yet.

Run the check — free, no account needed. It reads the open-access text and checks the sources it cites.

A few free checks a day · papers already verified open instantly · results are public

Claims other papers make about this one

Each is checked against this paper’s own text: does it say what the citing paper says it does?

Self-check

Percentages, sums and reported differences re-computed from the paper’s own numbers.

The self-check needs the paper’s full text.

Citations

Cites

Show all 66 references

Research works printed but not linked: 4

  1. Petreska, B. et al. in Advances in Neural Information Processing Systems, Vol. 24 (eds Shawe-Taylor, J. et al.) 756–764 (Curran Associates, Inc., Red Hook, New York, 2011).
  2. Munoz, D. P. & Schall, J. D. in The Oculomotor System: New Approaches for Studying Sensorimotor Integration. (eds Hall, W. C. & Moschovakis, A. K.) 52–82 (CRC Press, Boca Raton, FL, USA, 2003).
  3. Gao, Y., Archer, E., Paninski, L. & Cunningham, J. P. 30th Conference on Neural Information Processing Systems (NIPS) (Barcelona, Spain, 2016).
  4. Macke, J. H. et al. Neural Information Processing Systems (NIPS) (Lake Tahoe, CA, USA, 2016).

Cited by

Sorted by citations

See all 101

Metadata

Authors
Lara, A. H., Cunningham, J. P., & Churchland, M. M.
Affiliations
Columbia University Irving Medical Center (US)
Corresponding author
Churchland, M. M.
Venue
Nature Communications
Published
2018-07-16
Volume
9
Issue
1
Pages
2754-2754
ISSN
2041-1723 (ISSN-L)
OpenAlex
W2832227888
Cited by
101
References
66
Citations by year
2026: 8 · 2025: 12 · 2024: 10 · 2023: 10 · 2022: 10 · 2021: 17 · 2020: 17 · 2019: 13 · 2018: 4
FWCI
7.59
Type
journal article
Language
en
Open access
Locations
  • Nature Communications (publishedVersion, cc-by)
  • Europe PMC (PubMed Central) (publishedVersion, other-oa)
  • PubMed Central (publishedVersion, cc-by)
  • PubMed (publishedVersion)
  • RePEc: Research Papers in Economics (submittedVersion)
  • DOAJ (DOAJ: Directory of Open Access Journals) (submittedVersion, cc-by-sa)
  • DOAJ (DOAJ: Directory of Open Access Journals) (submittedVersion)
  • Columbia Academic Commons (Columbia University)
Funders
  • Alfred P. Sloan Foundation
  • Simons Foundation (SCGB#542957, SCGB#325233, 325233)
  • McKnight Foundation (P30 EY019007)
  • Searle Scholars Program
  • National Institutes of Health (EY019007)
  • N. Bud Grossman Center for Memory Research and Care
  • National Eye Institute (P30EY019007)
  • National Institute of Neurological Disorders and Stroke (NS092350, U19NS104649, DP2NS083037, F32NS092350, R01NS100066)
Topics
  • Life Sciences › Neuroscience › Cognitive Neuroscience › Motor Control and Adaptation
  • Life Sciences › Neuroscience › Cognitive Neuroscience › Neural dynamics and brain function
  • Life Sciences › Neuroscience › Cognitive Neuroscience › Memory and Neural Mechanisms
Keywords
supplementary motor area, motor cortex, population dynamics, visually guided reaching, movement-related activity, motor preparation, muscle activity, population coding
MeSH terms
Animals, Brain Mapping, Electrodes, Implanted, Electroencephalography, Electromyography, Hand, Macaca mulatta, Male, Motor Cortex, Motor Neurons, Movement, Neural Pathways, Photic Stimulation, Psychomotor Performance, Reaction Time, Stereotaxic Techniques, Range of Motion, Articular, Muscle, Skeletal, Multifactor Dimensionality Reduction

About these checks

Registry, retraction, Cites and statistics results are computed, not judged, with one exception: a printed reference that no index lists is read once by a model before it counts as a citation error. Claims are extracted by a model and kept only when their quote appears verbatim in the text; each cited source is then checked, with a model’s help, for whether it says what the claim relies on. Those verdicts can be wrong — read the claim’s quote and the cited source before relying on one.

Statistics and arithmetic are recomputed, not judged.

Confidence bands are shown only for fields calibrated on our annotated test set. None is calibrated yet, so no band is shown.

What counts as a claim ›How we measure confidence ›How we check this ›

Are you an author, or do you see a problem with this page? Request a review