

The DOI matches its Crossref record; 52 of the 53 references it cites were found in a registry or an index.
Single-cell analysis reveals that stochasticity and paracrine signaling control interferon-alpha production by plasmacytoid dendritic cells
Open accessAbstract
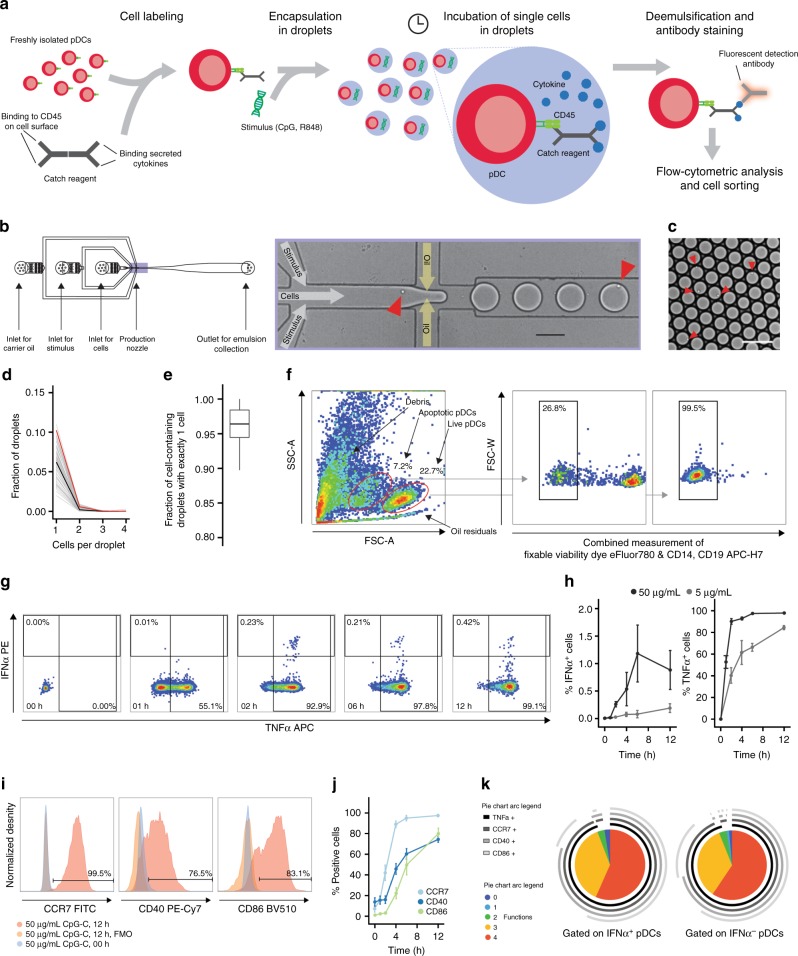
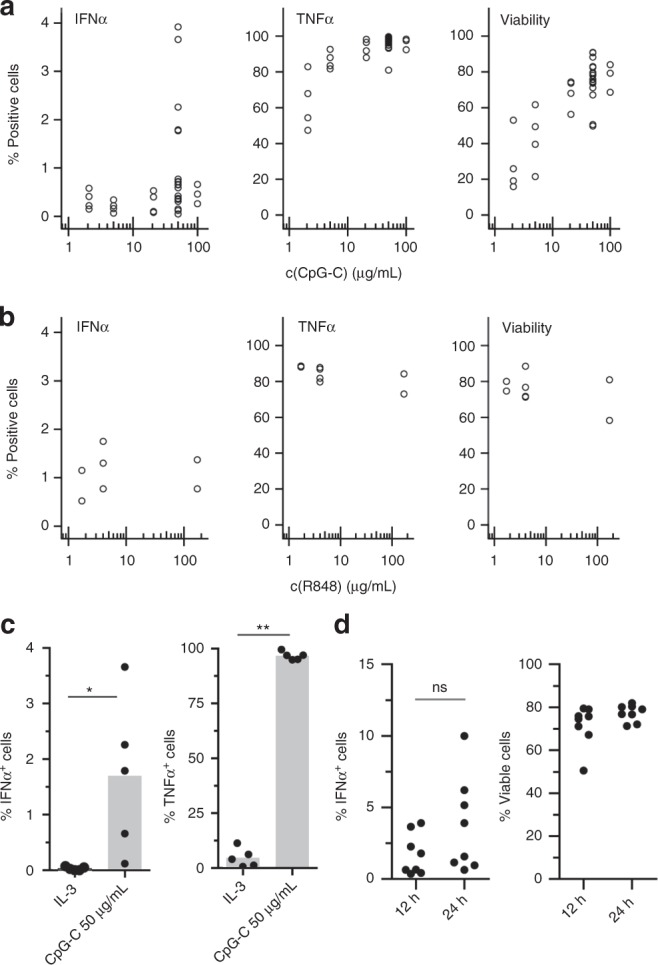
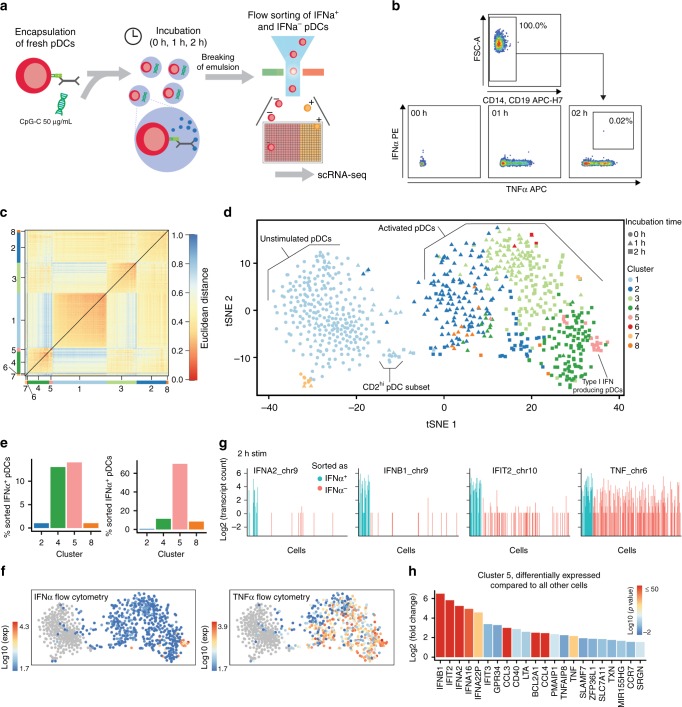
Type I interferon (IFN) is a key driver of immunity to infections and cancer. Plasmacytoid dendritic cells (pDCs) are uniquely equipped to produce large quantities of type I IFN but the mechanisms that control this process are poorly understood. Here we report on a droplet-based microfluidic platform to investigate type I IFN production in human pDCs at the single-cell level. We show that type I IFN but not TNFα production is limited to a small subpopulation of individually stimulated pDCs and controlled by stochastic gene regulation. Combining single-cell cytokine analysis with single-cell RNA-seq profiling reveals no evidence for a pre-existing subset of type I IFN-producing pDCs. By modulating the droplet microenvironment, we demonstrate that vigorous pDC population responses are driven by a type I IFN amplification loop. Our study highlights the significance of stochastic gene regulation and suggests strategies to dissect the characteristics of immune responses at the single-cell level.
Overview
The claims and statistics of this paper haven’t been checked yet.
Run the check — free, no account needed. It reads the open-access text and checks the sources it cites.
Integrity signals
Registry
Cites
Statistics
Figures
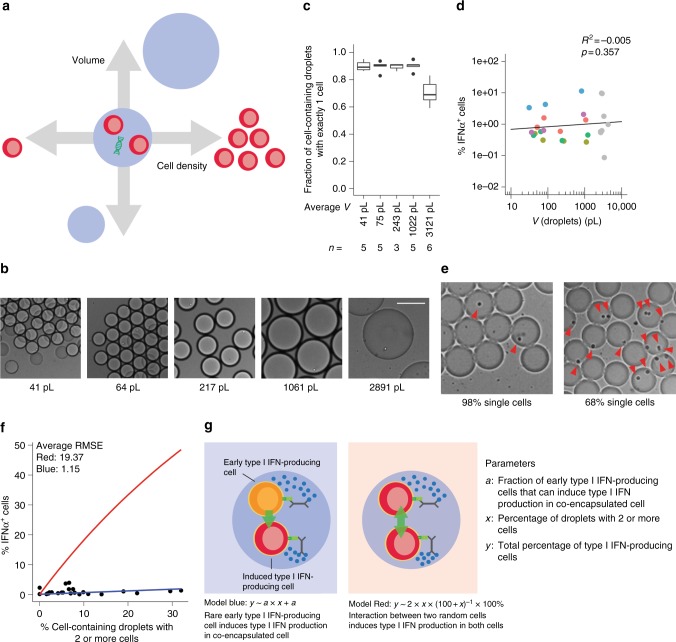
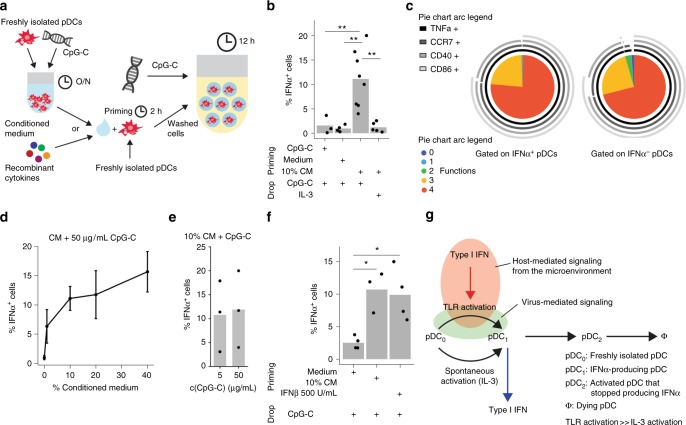
Verification
Claims the paper makes
The claims and statistics of this paper haven’t been checked yet.
Run the check — free, no account needed. It reads the open-access text and checks the sources it cites.
Claims other papers make about this one
Each is checked against this paper’s own text: does it say what the citing paper says it does?
In the citing paper
“Importantly, the type I IFN response can be rather heterogeneous. Depending on the state of the reacting cell (e.g., with respect to its metabolic or general activation state) (Talemi and Höfer, 2018), it is at least in part stochastic (Rand et al., 2012; Wimmers et al., 2018), it varies among different cell types and microenvironments, and it shows interindividual heterogeneity concerning the”
From COVID-19 and the human innate immune system (2021) · cites this paper as Wimmers et al., 2018
Self-check
Percentages, sums and reported differences re-computed from the paper’s own numbers.
The self-check needs the paper’s full text.
Citations
Cites
R: A Language and Environment for Statistical Computing
R Core Team (2000) · doi:10.32614/r.manuals · Cited by 355,893
Analysis of Relative Gene Expression Data Using Real-Time Quantitative PCR and the 2−ΔΔCT Method
Livak, K. J., & Schmittgen, T. D. (2001) · Methods · doi:10.1006/meth.2001.1262 · Cited by 180,860
Fiji: an open-source platform for biological-image analysis
Schindelin, J., Arganda-Carreras, I., Frise, E., Kaynig, V., Longair, M., Pietzsch, T., Preibisch, S., Rueden, C., Saalfeld, S., Schmid, B., et al. (2012) · Nature Methods · doi:10.1038/nmeth.2019 · Cited by 66,890
NIH Image to ImageJ: 25 years of image analysis
Schneider, C. A., Rasband, W. S., & Eliceiri, K. W. (2012) · Nature Methods · doi:10.1038/nmeth.2089 · Cited by 64,638
Fast and accurate short read alignment with Burrows-Wheeler transform
Li, H., & Durbin, R. (2009) · Bioinformatics · doi:10.1093/bioinformatics/btp324 · Cited by 58,607
Systematic and integrative analysis of large gene lists using DAVID bioinformatics resources
Huang, D. W., Sherman, B. T., & Lempicki, R. A. (2009) · Nature Protocols · doi:10.1038/nprot.2008.211 · Cited by 35,890
ggplot2: Elegant Graphics for Data Analysis
Wickham, H. (2009) · doi:10.1007/978-0-387-98141-3 · Cited by 14,447
Huang, D. W., Sherman, B. T., & Lempicki, R. A. (2009) · Nucleic Acids Research · doi:10.1093/nar/gkn923 · Cited by 14,108
Highly parallel genome-wide expression profiling of individual cells using nanoliter droplets.
Macosko, E. Z., Basu, A., Satija, R., Nemesh, J., Shekhar, K., Goldman, M., Tirosh, I., Bialas, A. R., Kamitaki, N., Martersteck, E. M., et al. (2015) · Cell · doi:10.1016/j.cell.2015.05.002 · Cited by 7,110
Mutation of the mouse klotho gene leads to a syndrome resembling ageing
Kuro-o, M., Matsumura, Y., Aizawa, H., Kawaguchi, H., Suga, T., Utsugi, T., Ohyama, Y., Kurabayashi, M., Kaname, T., Kume, E., et al. (1997) · Nature · doi:10.1038/36285 · Cited by 3,837
Cited by
Sorted by citations
Items 101–149 of 149
The In Vivo Source of Type I and Type III IFNs is Pathogen DependentPreprint
Sandoval, M. J., Hsiang-Chi, T., Risman, H. P., Sv, S., Li, Q., Lin, J.-D., Rivera, A., Durbin, R. K., Kotenko, S. V., & Durbin, J. E. (2021) · bioRxiv (Cold Spring Harbor Laboratory) · doi:10.1101/2021.10.05.463160 · Cited by 5
Heterogeneity in viral replication dynamics shapes the antiviral responsePreprint
Bruurs, L. J. M., Müller, M., Schipper, J. G., Rabouw, H. H., Boersma, S., van Kuppeveld, F. J. M., & Tanenbaum, M. E. (2022) · bioRxiv (Cold Spring Harbor Laboratory) · doi:10.1101/2022.06.08.495262 · Cited by 6
Deciphering cellular complexity: advances and future directions in single-cell protein analysis
Zhao, Q., Li, S., Krall, L., Li, Q., Sun, R., Yin, Y., Fu, J., Zhang, X. D., Wang, Y., & Yang, M. (2025) · Frontiers in Bioengineering and Biotechnology · doi:10.3389/fbioe.2024.1507460 · Cited by 6
Rivera-Cardona, J., Mahajan, T., Thayer, E. A., Kakuturu, N., Teo, Q. W., Lederer, J., Rowland, E. F., Heimburger, K., Sun, J., McDonald, C. A., et al. (2025) · Proceedings of the National Academy of Sciences · doi:10.1073/pnas.2509560123 · Cited by 8
The population context is a driver of the heterogeneous response of epithelial cells to interferons
Metz‐Zumaran, C., Uckeley, Z. M., Doldan, P., Muraca, F., Keser, Y., Lukas, P., Kuropka, B., Küchenhoff, L., Talemi, S. R., Höfer, T., et al. (2024) · Molecular Systems Biology · doi:10.1038/s44320-024-00011-2 · Cited by 5
Immune quorum sensing dictates IFN‐I response dynamics in human plasmacytoid dendritic cells
Eyndhoven, L. C. V., Vreezen, C. C., Tiemeijer, B. M., & Tel, J. (2024) · European Journal of Immunology · doi:10.1002/eji.202350955 · Cited by 5
Self-citationYang, H., Sinha, N., Rand, U., Häuser, H., Köster, M., de Greef, T. F. A., & Tel, J. (2022) · Biosensors and Bioelectronics · doi:10.1016/j.bios.2022.114353 · Cited by 5
Self-citationRevising immune cell coordination: Origins and importance of single‐cell variation
Eyndhoven, L. C. V., & Tel, J. (2022) · European Journal of Immunology · doi:10.1002/eji.202250073 · Cited by 4
Self-citationMurray, L., Thillaiyampalam, G., Xi, Y., Cristino, A. S., & Upham, J. W. (2021) · Clinical & Translational Immunology · doi:10.1002/cti2.1356 · Cited by 5
Barrat, F. J., & Guéry, J. (2025) · Immunological Reviews · doi:10.1111/imr.70074 · Cited by 6
Regulation and function of Id2 in plasmacytoid dendritic cells
Babcock, R. L., Zhou, Y., Patel, B., Chrisikos, T. T., Kahn, L. M., Dyevoich, A. M., Medik, Y. B., & Watowich, S. S. (2022) · Molecular Immunology · doi:10.1016/j.molimm.2022.05.009 · Cited by 4
Bridges, K., Pizzurro, G. A., Khunte, M., Chen, M., Rocha, E. S., Alexander, A. F., Bass, V., Kellman, L. N., Baskaran, J., & Miller‐Jensen, K. (2024) · The Journal of Immunology · doi:10.4049/jimmunol.2300431 · Cited by 4
Eyndhoven, L. C. V., Chouri, E., Matos, C. I., Pandit, A., Radstake, T. R. D. J., Broen, J. C. A., Singh, A., & Tel, J. (2024) · Frontiers in Immunology · doi:10.3389/fimmu.2024.1322814 · Cited by 4
Self-citationA Pipette-Tip Based Method for Seeding Cells to Droplet Microfluidic Platforms
Sinha, N., Subedi, N., Wimmers, F., Soennichsen, M., & Tel, J. (2019) · Journal of Visualized Experiments · doi:10.3791/57848-v · Cited by 4
Self-citationMicroheterogeneity in the Kinetics and Sex-Specific Response to Type I IFN
Gal-Oz, S. T., Baysoy, A., Vijaykumar, B., Mostafavi, S., Benoist, C. O., Shay, T., & Immunological Genome Project (2024) · The Journal of Immunology · doi:10.4049/jimmunol.2300453 · Cited by 4
Reduced Type‐I Interferon by Plasmacytoid Dendritic Cells and Asthma in School‐Aged Children
Coenen, I., Jones, A. C., White, A. A., Takashima, M., Lee, W. R., Wong, M. D., Vilcins, D., Kadolsky, U. D., Cheema, A. S., Saxena, A., et al. (2025) · Allergy · doi:10.1111/all.70005 · Cited by 3
Wang, H., Chen, K., & Wang, Z. (2025) · Open Research (University of Surrey) · doi:10.1002/viw.20250065 · Cited by 3
Advances in understanding epigenetic impacts on dendritic cell regulation and function
Verlander, Z., Cummings, A., Brown, H. M., & Sen, R. (2022) · Clinical and Translational Discovery · doi:10.1002/ctd2.53 · Cited by 5
Advanced Biosensing towards Real-Time Imaging of Protein Secretion from Single Cells
Zhou, L., Chen, P., & Simonian, A. L. (2021) · IntechOpen eBooks · doi:10.5772/intechopen.94248 · Cited by 3
Microfluidics for Immuno‐oncology
Ma, C., Harris, J., Morales, R. T., & Chen, W. (2019) · Wiley eBooks · doi:10.1002/9783527818341.ch5 · Cited by 3
Intrinsic OASL expression licenses interferon induction during influenza A virus infectionPreprint
Rivera-Cardona, J., Mahajan, T., Kakuturu, N., Teo, Q. W., Lederer, J., Thayer, E. A., Rowland, E. F., Heimburger, K., Sun, J., McDonald, C. A., et al. (2025) · bioRxiv (Cold Spring Harbor Laboratory) · doi:10.1101/2025.03.14.643375 · Cited by 3
Gao, M., Zhang, N., & Xia, Y. (2025) · Journal of Immunology Research · doi:10.1155/jimr/5600731 · Cited by 2
Recent progress in co-detection of single-cell transcripts and proteins
Huang, S., Fan, Q., Wang, Y., Huang, Z., Shi, W., Gong, Y., Yang, T., Wang, J., Wu, L., & Yang, C. J. (2023) · Nano Research · doi:10.1007/s12274-023-5924-3 · Cited by 2
Li, Y., Li, W., Chen, J., Qiu, S., Liu, Y., Xu, L., Tian, T., & Li, J. P. (2023) · Bioorganic Chemistry · doi:10.1016/j.bioorg.2023.106987 · Cited by 2
Five patterns of cell signaling pathways associated with cell behaviorPreprint
Takeda, Y., Kawano, K., Ma, R., Saitoh, S., & Asao, H. (2020) · bioRxiv (Cold Spring Harbor Laboratory) · doi:10.1101/2020.08.04.235986 · Cited by 2
A tissue-scale strategy for sensing threats in barrier organs
Nguyen, D. H., Tian, J., Shanahan, S.-L., Wang, C., Jacks, T., Wang, X., & Li, P. (2026) · Cell Systems · doi:10.1016/j.cels.2026.101611 · Cited by 1
Advances in microfluidics-based single-cell secretion analysis
Chen, Y., & Lu, Y. (2025) · Chinese Science Bulletin (Chinese Version) · doi:10.1360/tb-2024-1405 · Cited by 1
Lussier, F., Moon, B., Janta, M., Morocz, Y., Svahn, F., Shen, M. L., Lukic, L., Malic, L., Veres, T., Ng, A., et al. (2025) · Advanced Materials · doi:10.1002/adma.202506398 · Cited by 1
BATF controls IFN I production via DC-SCRIPT in plasmacytoid dendritic cellsPreprint
Ali, S., Mann‐Nüttel, R., Marson, M., Leiser, B., Hoffe, J., Dress, R. J., Bhuyan, M. H., Petzsch, P., Köhrer, K., Xu, H. C., et al. (2024) · bioRxiv (Cold Spring Harbor Laboratory) · doi:10.1101/2024.01.11.574638 · Cited by 1
Deak, P., Studnitzer, B., Steinhardt, R. C., & Esser-Kahn, A. P. (2020) · bioRxiv (Cold Spring Harbor Laboratory) · doi:10.1101/2020.10.08.331744
Multi-Scale Modeling of the Innate Immune System: A Dynamic Investigation into Pathogenic Detection
Gregg, R. W. (2020) · D-Scholarship@Pitt (University of Pittsburgh)
Klement, J. D., Redd, P. S., Lu, C., Merting, A. D., Poschel, D. B., Yang, D., Zhou, G., Munn, D. H., & Liu, K. (2021) · bioRxiv (Cold Spring Harbor Laboratory) · doi:10.1101/2021.06.18.449028
Yang, H., van de Kreeke, T., Eyndhoven, L. C. V., & Tel, J. (2023) · bioRxiv (Cold Spring Harbor Laboratory) · doi:10.1101/2023.03.27.534340
Self-citationPopulation context drives cell-to-cell variability in interferon response in epithelial cellsPreprint
Metz‐Zumaran, C., Doldan, P., Muraca, F., Keser, Y., Lukas, P., Kuropka, B., Küchenhoff, L., Talemi, S. R., Höfer, T., Freund, C., et al. (2023) · bioRxiv (Cold Spring Harbor Laboratory) · doi:10.1101/2023.05.22.541682
TLR8 escapes X chromosome inactivation in human monocytes and CD4 + T cellsPreprint
Youness, A., Cénac, C., Faz-López, B., Grunenwald, S., Barrat, F. J., Chaumeil, J., Mejía, J. E., & Guéry, J. (2023) · medRxiv · doi:10.1101/2023.08.08.23293823
Hernández, S. S., Bjerg, T. W., Nielsen, I. H., Laustsen, A., Tang, H. Q., Pedersen, L. H., Klechevsky, E., Jakobsen, M. R., & Bak, R. O. (2025) · Frontiers in Immunology · doi:10.3389/fimmu.2025.1550397
Gastaldi, T., Novoszel, P., Sanlorenzo, M., Fernandes, C. D. S., Mohr, T. T., Krauß, D., Blauensteiner, B., Holcmann, M., Barozzi, I., & Sibilia, M. C. (2025) · iScience · doi:10.1016/j.isci.2025.112670
Maranou, E., Park, G., Weinzettl, P., Alanko, J., Pulkkinen, O. I., Coupland, S. E., Salmi, M., & Figueiredo, C. R. (2025) · bioRxiv (Cold Spring Harbor Laboratory) · doi:10.64898/2025.12.01.691518
Additional file 2 of TLR8 escapes X chromosome inactivation in human monocytes and CD4+ T cells
Youness, A., Cénac, C., Faz-López, B., Grunenwald, S., Barrat, F. J., Chaumeil, J., Mejía, J. E., & Guéry, J. (2023) · Figshare · doi:10.6084/m9.figshare.24159528
Additional file 1 of TLR8 escapes X chromosome inactivation in human monocytes and CD4+ T cells
Youness, A., Cénac, C., Faz-López, B., Grunenwald, S., Barrat, F. J., Chaumeil, J., Mejía, J. E., & Guéry, J. (2023) · Figshare · doi:10.6084/m9.figshare.24159525
Wu, L., Nguyen, M. A., Yang, Z., Potluri, S., Sivagnanam, S., Kirchberger, N. C., Joshi, A. S., Ahn, K. J., Tumulty, J. S., Cabrera, E. C., et al. (2026) · bioRxiv (Cold Spring Harbor Laboratory) · doi:10.64898/2026.02.01.703134
Etude de l'hétérogénéité des cellules dendritiques plasmacytoïdes au cours d'une infection in vivo
Abbas, A. (2019) · theses.fr (ABES) · doi:10.70675/079668e7z9744z463ezbc34zbcebe6034de7
The Immunomodulatory Effects of Arsenic Trioxide in Autoimmunity and Alloreactivity
Ye, Y. (2019) · theses.fr (ABES) · doi:10.70675/65bfdcabzdb07z4be1z9c7czaa4093c44245
Single cell monitoring of antiviral response regulation upon viral infection
Ribeiro, M. M. S. (2022) · theses.fr (ABES) · doi:10.70675/ad14ca1bzc138z439ezaea2z978adb91e70c
DePuyt, A. E., Shoucair, P. E. J., Bilben, H. A., Martinson, J. J., Macatangay, B. J. C., Rinaldo, C. R., Kaliński, P., & Mailliard, R. B. (2026) · bioRxiv (Cold Spring Harbor Laboratory) · doi:10.64898/2026.04.29.721620
Metadata
- Authors
- Wimmers, F., Subedi, N., van Buuringen, N., Heister, D., Vivié, J., Beeren-Reinieren, I., Woestenenk, R., Dolstra, H., Piruska, A., Jacobs, J. F. M., van Oudenaarden, A., Figdor, C. G., Huck, W. T. S., de Vries, I. J. M., & Tel, J.
- Affiliations
- Radboud University Medical Center (NL)
- Eindhoven University of Technology (NL)
- University Medical Center Utrecht (NL)
- Radboud University Nijmegen (NL)
- Corresponding author
- Tel, Jurjen
- ORCID
- Venue
- Nature Communications
- Published
- 2018-08-20
- Volume
- 9
- Issue
- 1
- Pages
- 3317-3317
- ISSN
- 2041-1723 (ISSN-L)
- PMC
- PMC6102223
- OpenAlex
- W2885999695
- Cited by
- 150
- References
- 53
- Citations by year
- 2026: 3 · 2025: 17 · 2024: 11 · 2023: 26 · 2022: 21 · 2021: 24 · 2020: 20 · 2019: 26 · 2018: 2
- FWCI
- 7.68
- Type
- journal article
- Language
- en
- Open access
- gold
- doi.org
- Locations
- Nature Communications (publishedVersion, cc-by)
- Europe PMC (PubMed Central) (publishedVersion, cc-by)
- PubMed Central (publishedVersion, cc-by)
- PubMed (publishedVersion)
- KNAW Research Portal (The Royal Netherlands Academy of Arts and Sciences) (publishedVersion, other-oa)
- TU/e Research Portal (acceptedVersion, other-oa)
- TU/e Research Portal (submittedVersion)
- Data Archiving and Networked Services (DANS) (submittedVersion, other-oa)
- RePEc: Research Papers in Economics (submittedVersion)
- DOAJ (DOAJ: Directory of Open Access Journals) (submittedVersion)
- DOAJ (DOAJ: Directory of Open Access Journals) (submittedVersion, cc-by-sa)
- Utrecht University Repository (Utrecht University) (submittedVersion, other-oa)
- Radboud Repository (Radboud University) (submittedVersion)
- Radboud Repository (Radboud University) (submittedVersion, other-oa)
- TU/e Research Portal (submittedVersion, other-oa)
- Funders
- Radboud Universitair Medisch Centrum (PhD grant)
- Nederlandse Organisatie voor Wetenschappelijk Onderzoek (863.130.24, Spinoza Award, Spinoza award)
- Generous support by the Eindhoven University of Technology
- Ministerie van Onderwijs, Cultuur en Wetenschap (024.001.035)
- generous support by the Radboud University
- KWF Kankerbestrijding (2009-4402)
- Topics
- Life Sciences › Immunology and Microbiology › Immunology › interferon and immune responses
- Life Sciences › Immunology and Microbiology › Immunology › Immune Response and Inflammation
- Life Sciences › Immunology and Microbiology › Immunology › Immunotherapy and Immune Responses
- Keywords
- plasmacytoid dendritic cells, type I interferon, interferon-alpha production, stochastic gene regulation, paracrine signaling, droplet microfluidics, single-cell RNA sequencing, TNF-α, immune response heterogeneity
- MeSH terms
- Dendritic Cells, Gene Expression Regulation, Humans, Interferon Type I, Stochastic Processes, Sequence Analysis, RNA, Jurkat Cells, Paracrine Communication, Cross-Priming, Toll-Like Receptors, Single-Cell Analysis, Cellular Microenvironment
About these checks
Registry, retraction, Cites and statistics results are computed, not judged, with one exception: a printed reference that no index lists is read once by a model before it counts as a citation error. Claims are extracted by a model and kept only when their quote appears verbatim in the text; each cited source is then checked, with a model’s help, for whether it says what the claim relies on. Those verdicts can be wrong — read the claim’s quote and the cited source before relying on one.
Statistics and arithmetic are recomputed, not judged.
Confidence bands are shown only for fields calibrated on our annotated test set. None is calibrated yet, so no band is shown.
What counts as a claim ›How we measure confidence ›How we check this ›
Are you an author, or do you see a problem with this page? Request a review
