Student or educator? Sign up with your school email and get 6 months of Pro free.
Cited by 51

The DOI matches its Crossref record; 112 of the 112 references it cites were found in a registry or an index.

Heart enhancers with deeply conserved regulatory activity are established early in zebrafish development

Yuan, Xuefei, Song, Mengyi, Devine, Patrick, Bruneau, Benoit G., Scott, Ian C., Wilson, Michael D.·2018·Nature Communications

Published version of a preprint

Abstract

During the phylotypic period, embryos from different genera show similar gene expression patterns, implying common regulatory mechanisms. Here we set out to identify enhancers involved in the initial events of cardiogenesis, which occurs during the phylotypic period. We isolate early cardiac progenitor cells from zebrafish embryos and characterize 3838 open chromatin regions specific to this cell population. Of these regions, 162 overlap with conserved non-coding elements (CNEs) that also map to open chromatin regions in human. Most of the zebrafish conserved open chromatin elements tested drive gene expression in the developing heart. Despite modest sequence identity, human orthologous open chromatin regions recapitulate the spatial temporal expression patterns of the zebrafish sequence, potentially providing a basis for phylotypic gene expression patterns. Genome-wide, we discover 5598 zebrafish-human conserved open chromatin regions, suggesting that a diverse repertoire of ancient enhancers is established prior to organogenesis and the phylotypic period.

Overview

The claims and statistics of this paper haven’t been checked yet.

Run the check — free, no account needed. It reads the open-access text and checks the sources it cites.

A few free checks a day · papers already verified open instantly · results are public

Integrity signals

Registry

Crossref · 10.1038/s41467-018-07451-z

Cites

112 of 112 references verified0 citation errors · 0 not checkable

Statistics

Figures

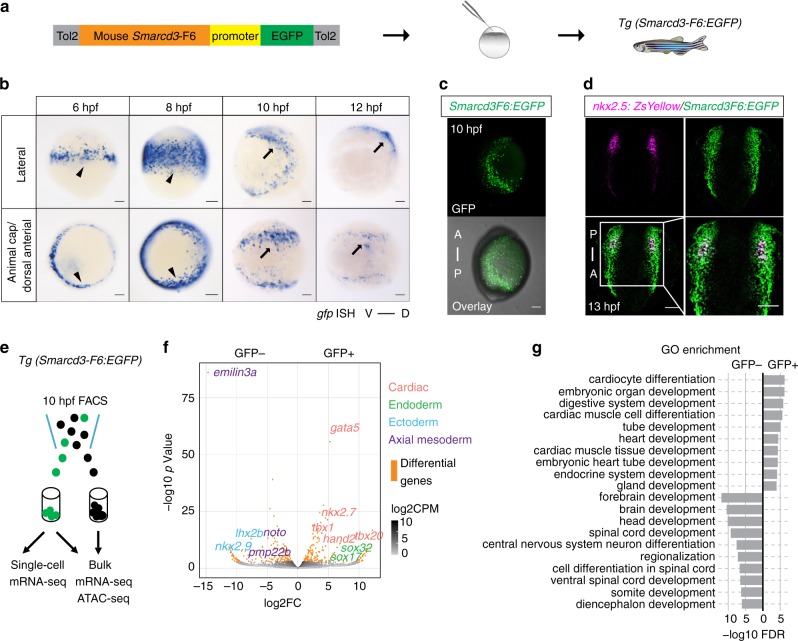
Fig. 1 Mouse Smarcd3-F6 enhancer labels early cardiac progenitors in zebrafish. a Generation of Tg(Smarcd3-F6:EGFP) zebrafish line b In-situ hybridization against gfp transcripts on Tg(Smarcd3-F6:EGFP) transgenic embryos. Smarcd3-F6 enhancer marks lateral margins (arrowheads) during gastrulation and ALPM regions (arrows) after gastrulation. c Native GFP expression in Tg(Smarcd3-F6:EGFP) embryos at 10 hpf. Embryos are shown in lateral views. d Immunostaining of GFP and ZsYellow on Tg(Smarcd3-F6:EGFP) and Tg(nkx2.5:ZsYellow) double transgenic embryos. Cells expressing ZsYellow were marked by GFP as well. e Workflow of mRNA-seq and ATAC-seq experiments. f Volcano plot showing genes differentially expressed between Smarcd3-F6:GFP+ and Smarcd3-F6:GFP- populations (FDR < 0.05, absolute log2FC > 1). g Top 10 most enriched GO terms obtained from genes that were significantly more highly expressed in Smarcd3-F6:GFP+ or Smarcd3-F6:GFP- populations. All scale bars represent 100 μm
Fig. 1 Mouse Smarcd3-F6 enhancer labels early cardiac progenitors in zebrafish. a Generation of Tg(Smarcd3-F6:EGFP) zebrafish line b In-situ hybridization against gfp transcripts on Tg(Smarcd3-F6:EGFP) transgenic embryos. Smarcd3-F6 enhancer marks lateral margins (arrowheads) during gastrulation and ALPM regions (arrows) after gastrulation. c Native GFP expression in Tg(Smarcd3-F6:EGFP) embryos at 10 hpf. Embryos are shown in lateral views. d Immunostaining of GFP and ZsYellow on Tg(Smarcd3-F6:EGFP) and Tg(nkx2.5:ZsYellow) double transgenic embryos. Cells expressing ZsYellow were marked by GFP as well. e Workflow of mRNA-seq and ATAC-seq experiments. f Volcano plot showing genes differentially expressed between Smarcd3-F6:GFP+ and Smarcd3-F6:GFP- populations (FDR < 0.05, absolute log2FC > 1). g Top 10 most enriched GO terms obtained from genes that were significantly more highly expressed in Smarcd3-F6:GFP+ or Smarcd3-F6:GFP- populations. All scale bars represent 100 μmCC BY · PubMed Central
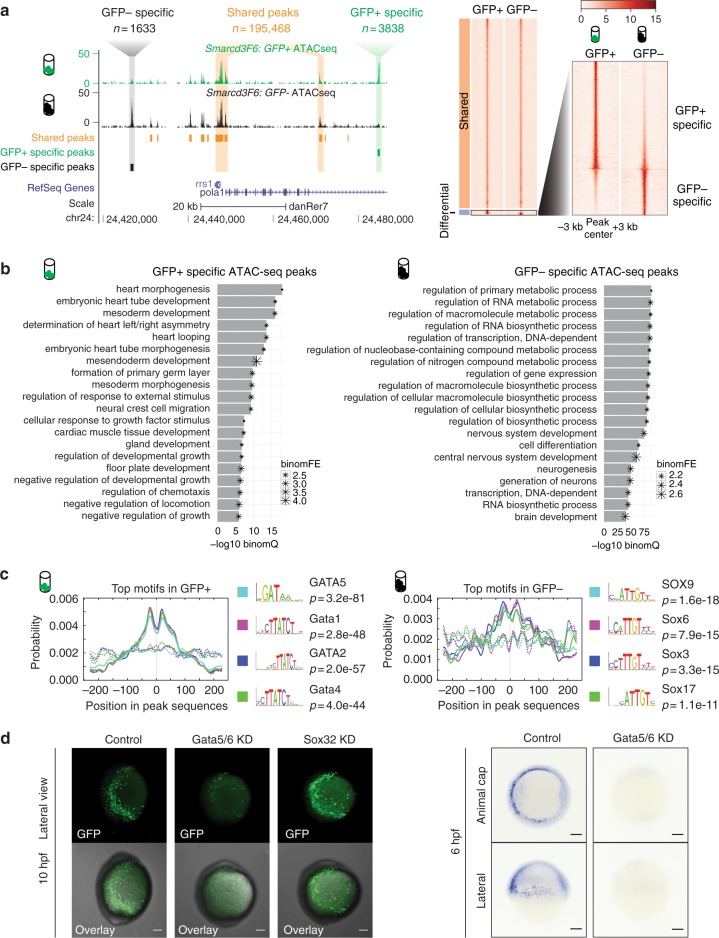
Fig. 2 Open chromatin landscape of Smarcd3-F6 labeled population. a Genome browser view and heatmap showing ATAC-seq peaks shared between GFP+ and GFP− populations or enriched in one population. In the heatmap, read intensity for regions within 3 kb of the peak center was plotted for each peak. b Barplot showing the 20 most enriched GO biological function terms obtained from GFP+ /− specific peaks using GREAT analysis. c Probabilities of the top 4 enriched motifs within the GFP+ /− specific peaks calculated by CentriMo76. Each curve shows the probability of the best match to a given motif occurring at a given position in the input sequences. Solid lines represent probabilities calculated from query peak sets (GFP+ /− specific peaks) while dash lines show that from the background sequences (shared peaks). d (Left) Confocal images of native GFP expression in control (uninjected), Gata5/6 KD (injected with Gata5/6 morpholinos) and Sox32 KD (injected with CAS morpholino) Tg(Smarcd3-F6: EGFP) transgenic embryos at 10 hpf; (Right) gfp in-situ on Tg(Smarcd3-F6: EGFP) embryos of 6 hpf that were uninjected (control) or injected with Gata5/6 morpholinos. All staining and imaging were performed under the same condition for the control and KD groups. All scale bars represent 100 μm
Fig. 2 Open chromatin landscape of Smarcd3-F6 labeled population. a Genome browser view and heatmap showing ATAC-seq peaks shared between GFP+ and GFP− populations or enriched in one population. In the heatmap, read intensity for regions within 3 kb of the peak center was plotted for each peak. b Barplot showing the 20 most enriched GO biological function terms obtained from GFP+ /− specific peaks using GREAT analysis. c Probabilities of the top 4 enriched motifs within the GFP+ /− specific peaks calculated by CentriMo76. Each curve shows the probability of the best match to a given motif occurring at a given position in the input sequences. Solid lines represent probabilities calculated from query peak sets (GFP+ /− specific peaks) while dash lines show that from the background sequences (shared peaks). d (Left) Confocal images of native GFP expression in control (uninjected), Gata5/6 KD (injected with Gata5/6 morpholinos) and Sox32 KD (injected with CAS morpholino) Tg(Smarcd3-F6: EGFP) transgenic embryos at 10 hpf; (Right) gfp in-situ on Tg(Smarcd3-F6: EGFP) embryos of 6 hpf that were uninjected (control) or injected with Gata5/6 morpholinos. All staining and imaging were performed under the same condition for the control and KD groups. All scale bars represent 100 μmCC BY · PubMed Central
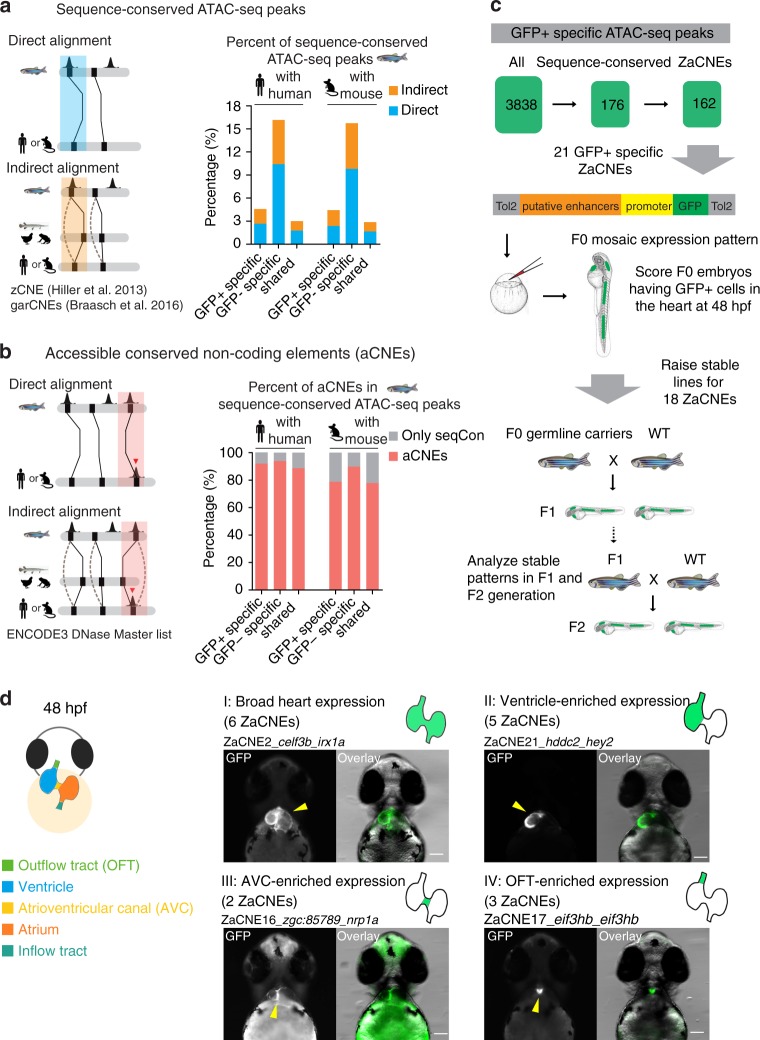
Fig. 3 Identification and in vivo characterization of accessible conserved non-coding elements (aCNEs). a Barplot showing the percentage of conserved regions in all GFP+ /− specific and shared ATAC-seq categories. Solid lines in the cartoon indicate direct sequence alignment and dotted lines showcases of indirect alignment bridged by intermediate species or ancestry reconstruction. b Barplot showing the aCNEs/sequenced conserved (seqCon) percentage. Most seqCon open chromatin regions were identified as having shared orthologous accessible chromatin. c Strategy for identifying and characterizing GFP+ specific aCNEs in zebrafish. Stable transgenic lines for 18 aCNEs were characterized. d Cartoon showing the zebrafish heart anatomy at 48 hpf (left panel). Heart expression patterns observed in ZaCNEs transgenic lines were classified into 4 categories (right panel), including I: broad expression in the whole heart; II: ventricle-enriched expression; III: atrioventricular (AVC)-enriched expression; IV: outflow tract (OFT)-enriched expression. One representative example of each category was shown and the numbers of ZaCNEs fall in each category are indicated in the brackets. The two closest genes near each ZaCNEs are indicated. All images were taken from the ventral view and all scale bars represent 100 μm
Fig. 3 Identification and in vivo characterization of accessible conserved non-coding elements (aCNEs). a Barplot showing the percentage of conserved regions in all GFP+ /− specific and shared ATAC-seq categories. Solid lines in the cartoon indicate direct sequence alignment and dotted lines showcases of indirect alignment bridged by intermediate species or ancestry reconstruction. b Barplot showing the aCNEs/sequenced conserved (seqCon) percentage. Most seqCon open chromatin regions were identified as having shared orthologous accessible chromatin. c Strategy for identifying and characterizing GFP+ specific aCNEs in zebrafish. Stable transgenic lines for 18 aCNEs were characterized. d Cartoon showing the zebrafish heart anatomy at 48 hpf (left panel). Heart expression patterns observed in ZaCNEs transgenic lines were classified into 4 categories (right panel), including I: broad expression in the whole heart; II: ventricle-enriched expression; III: atrioventricular (AVC)-enriched expression; IV: outflow tract (OFT)-enriched expression. One representative example of each category was shown and the numbers of ZaCNEs fall in each category are indicated in the brackets. The two closest genes near each ZaCNEs are indicated. All images were taken from the ventral view and all scale bars represent 100 μmCC BY · PubMed Central
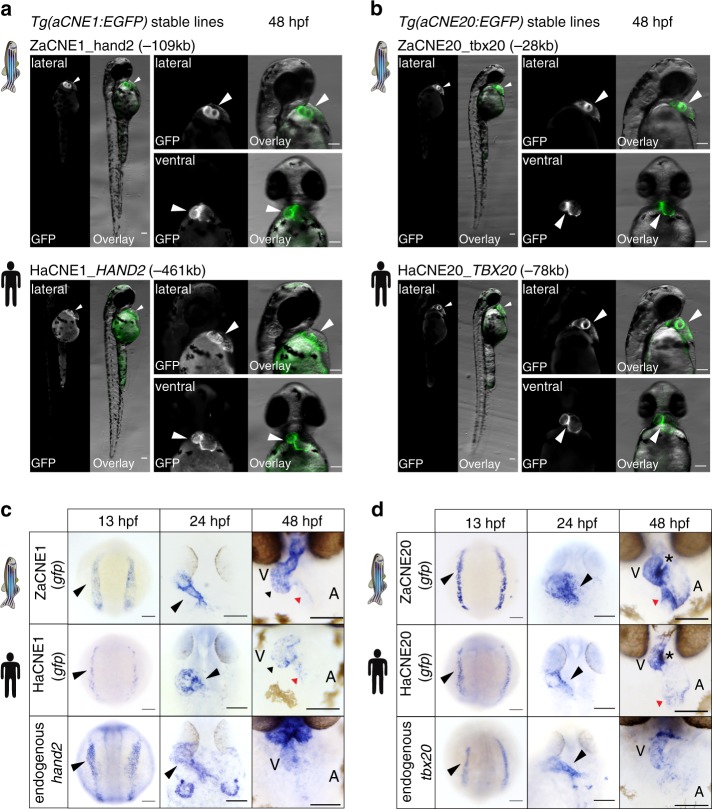
Fig. 4 Anciently conserved open chromatin regions share conserved cardiac activities. Fluorescent images (a, b) of aCNE transgenic lines generated using zebrafish or human sequences. In-situ characterization (c, d) of the activities of the zebrafish (upper panel) and human (middle panel) aCNE sequences and the endogenous expression of zebrafish cardiac genes (lower panel) nearby. In 48 hpf images in (c), black triangles indicate staining in ventricles and red triangles staining in the inner curvature of atria for both aCNE1 transgenic lines. In 48 hpf images in (d), stars indicate the conserved activity of both aCNE20 enhancers at the inner curvature of ventricles and atrioventricular canal regions and red triangles point to the staining in inflow tract. All images shown were collected from embryos of stable lines and all scale bars represent 100 μm
Fig. 4 Anciently conserved open chromatin regions share conserved cardiac activities. Fluorescent images (a, b) of aCNE transgenic lines generated using zebrafish or human sequences. In-situ characterization (c, d) of the activities of the zebrafish (upper panel) and human (middle panel) aCNE sequences and the endogenous expression of zebrafish cardiac genes (lower panel) nearby. In 48 hpf images in (c), black triangles indicate staining in ventricles and red triangles staining in the inner curvature of atria for both aCNE1 transgenic lines. In 48 hpf images in (d), stars indicate the conserved activity of both aCNE20 enhancers at the inner curvature of ventricles and atrioventricular canal regions and red triangles point to the staining in inflow tract. All images shown were collected from embryos of stable lines and all scale bars represent 100 μmCC BY · PubMed Central
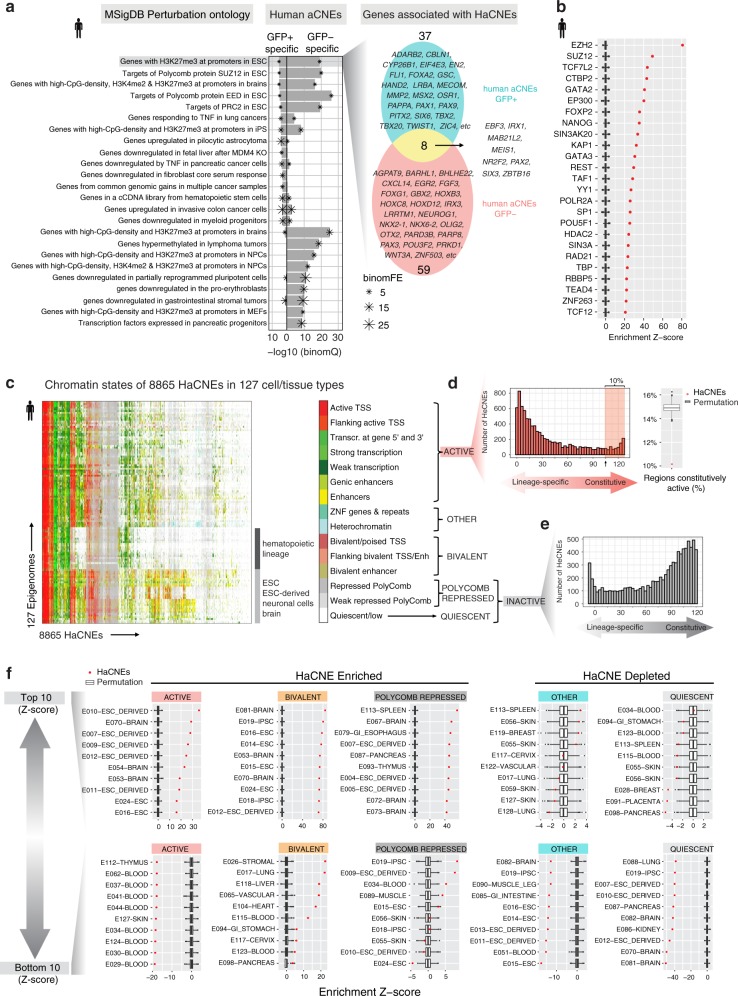
Fig. 5 Genomics and epigenomic features of aCNEs. a Enrichment analysis of HaCNEs conserved with GFP+ or GFP− specific ATAC-seq peaks. Top 15 enrichment terms (binomial FDR < 0.5, FE > 2, sorted by binomial FDR) for each category (GFP+, GFP−) were plotted. Venn diagram shows the overlap of genes associated with the GFP+ and GFP− specific HaCNEs that contribute to the top enrichment category (genes with H3K27me3 at promoters in ESC). b DNA binding factor occupancy enrichment within all HaCNEs (n = 8866). Boxplots show the distribution of 1000 times permutation and red dots represent the enrichment Z-scores normalized by the permutation results. The top 20 most enriched factors were plotted. c Heatmap showing the chromatin states of 8865 HaCNEs across 127 epigenomes from Roadmap Epigenomics Project. One HaCNE on chromosome Y was excluded from this analysis since it was absent in several epigenomes from female tissues. d Histogram showing the distribution of HaCNEs that displayed ACTIVE chromatin states (x-axis). Approximately 10% of HaCNEs were constitutively active in the majority of the epigenomes (> 80%) (shaded area in histogram). Compared to the same number of randomly selected open chromatin regions from the ENCODE3 human DHS master list, HaCNEs were depleted for regions constitutively active (red dot on boxplot on the right). e Histogram of HaCNEs that displayed Quiescent or Polycomb repressed states. f Enrichment of certain chromatin states (active, bivalent, polycomb repressed, quiescent and other) in HaCNEs compared to randomly selected open regions (permutation). The enrichment Z-scores were plotted for each epigenome (red dot) along with the permutation distribution (boxplot) (see Supplementary Methods for details). For each chromatin state, epigenomes with the top 10 (upper panel, most enriched/least depleted) and bottom 10 (lower panel, most depleted/least enriched) Z-scores were plotted. Row names were formatted as ID-EpigenomeName, which were retrieved from Roadmap Epigenomics Project metadata table (http://egg2.wustl.edu/roadmap/web_portal/meta.html). In all boxplots, center represents median, lower and higher hinges correspond to the first and third quartiles, and whiskers extend to values no further than 1.5 *(distance between first and third quantile) from the hinges. Data beyond the end of whiskers are plotted individually as outliers
Fig. 5 Genomics and epigenomic features of aCNEs. a Enrichment analysis of HaCNEs conserved with GFP+ or GFP− specific ATAC-seq peaks. Top 15 enrichment terms (binomial FDR < 0.5, FE > 2, sorted by binomial FDR) for each category (GFP+, GFP−) were plotted. Venn diagram shows the overlap of genes associated with the GFP+ and GFP− specific HaCNEs that contribute to the top enrichment category (genes with H3K27me3 at promoters in ESC). b DNA binding factor occupancy enrichment within all HaCNEs (n = 8866). Boxplots show the distribution of 1000 times permutation and red dots represent the enrichment Z-scores normalized by the permutation results. The top 20 most enriched factors were plotted. c Heatmap showing the chromatin states of 8865 HaCNEs across 127 epigenomes from Roadmap Epigenomics Project. One HaCNE on chromosome Y was excluded from this analysis since it was absent in several epigenomes from female tissues. d Histogram showing the distribution of HaCNEs that displayed ACTIVE chromatin states (x-axis). Approximately 10% of HaCNEs were constitutively active in the majority of the epigenomes (> 80%) (shaded area in histogram). Compared to the same number of randomly selected open chromatin regions from the ENCODE3 human DHS master list, HaCNEs were depleted for regions constitutively active (red dot on boxplot on the right). e Histogram of HaCNEs that displayed Quiescent or Polycomb repressed states. f Enrichment of certain chromatin states (active, bivalent, polycomb repressed, quiescent and other) in HaCNEs compared to randomly selected open regions (permutation). The enrichment Z-scores were plotted for each epigenome (red dot) along with the permutation distribution (boxplot) (see Supplementary Methods for details). For each chromatin state, epigenomes with the top 10 (upper panel, most enriched/least depleted) and bottom 10 (lower panel, most depleted/least enriched) Z-scores were plotted. Row names were formatted as ID-EpigenomeName, which were retrieved from Roadmap Epigenomics Project metadata table (http://egg2.wustl.edu/roadmap/web_portal/meta.html). In all boxplots, center represents median, lower and higher hinges correspond to the first and third quartiles, and whiskers extend to values no further than 1.5 *(distance between first and third quantile) from the hinges. Data beyond the end of whiskers are plotted individually as outliersCC BY · PubMed Central

Verification

Claims the paper makes

The claims and statistics of this paper haven’t been checked yet.

Run the check — free, no account needed. It reads the open-access text and checks the sources it cites.

A few free checks a day · papers already verified open instantly · results are public

Claims other papers make about this one

Each is checked against this paper’s own text: does it say what the citing paper says it does?

Self-check

Percentages, sums and reported differences re-computed from the paper’s own numbers.

The self-check needs the paper’s full text.

Citations

Cites

Show all 112 references

Research works printed but not linked: 1

  1. Westerfield, M. The Zebrafish Book. Eugene University of Oregon Press. (2000).

Cited by

Metadata

Authors
Yuan, X., Song, M., Devine, P., Bruneau, B. G., Scott, I. C., & Wilson, M. D.
Venue
Nature Communications
Published
2018-11-26
Volume
9
Issue
1
ISSN
2041-1723
Cited by
51
References
112
Language
en
Licence

About these checks

Registry, retraction, Cites and statistics results are computed, not judged, with one exception: a printed reference that no index lists is read once by a model before it counts as a citation error. Claims are extracted by a model and kept only when their quote appears verbatim in the text; each cited source is then checked, with a model’s help, for whether it says what the claim relies on. Those verdicts can be wrong — read the claim’s quote and the cited source before relying on one.

Statistics and arithmetic are recomputed, not judged.

Confidence bands are shown only for fields calibrated on our annotated test set. None is calibrated yet, so no band is shown.

What counts as a claim ›How we measure confidence ›How we check this ›

Are you an author, or do you see a problem with this page? Request a review

Data sources

Bibliographic data: Semantic Scholar, OpenAlex, Crossref.

Contains information from the Semantic Scholar Academic Graph Datasets, made available under the ODC Attribution License (ODC-BY 1.0).

Semantic Scholar’s data is described in: Kinney, R., et al. (2023). The Semantic Scholar Open Data Platform. arXiv:2301.10140.