

The DOI matches its Crossref record; 59 of the 59 references it cites were found in a registry or an index.
Microbial abundance, activity and population genomic profiling with mOTUs2
Open accessAbstract
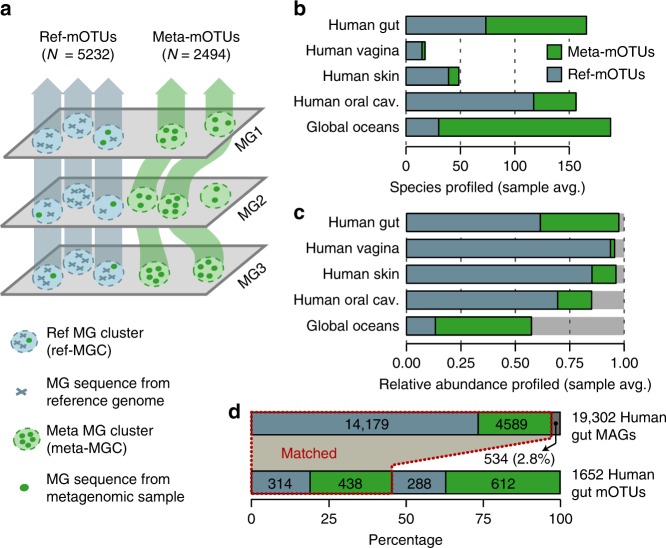
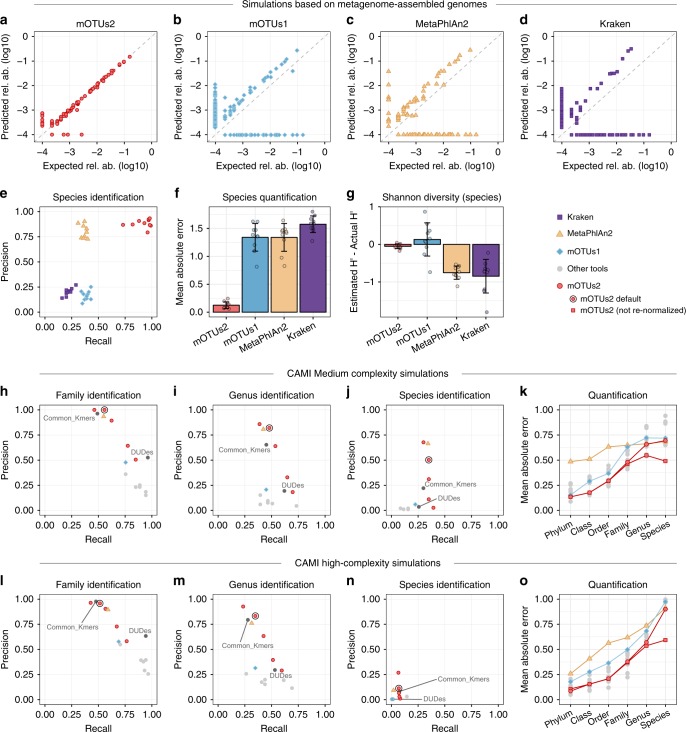
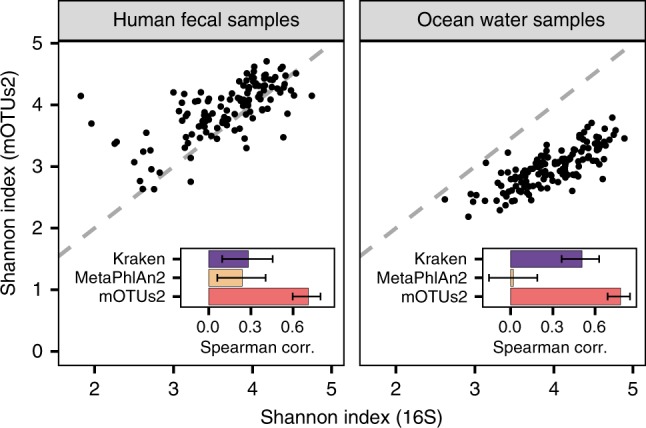
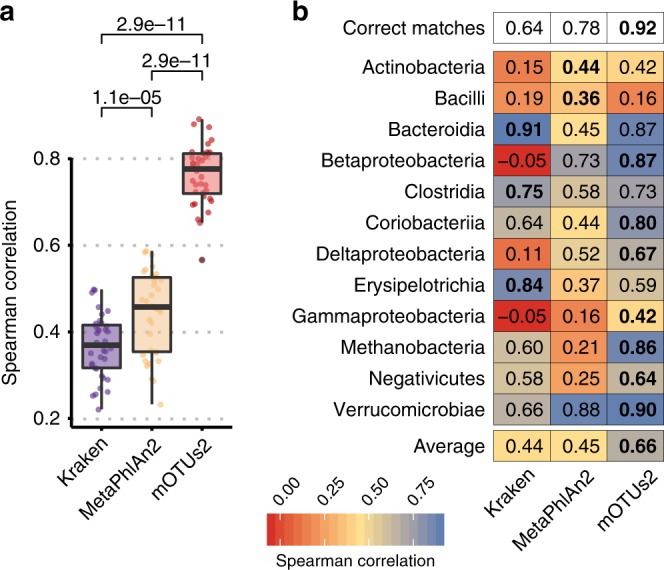
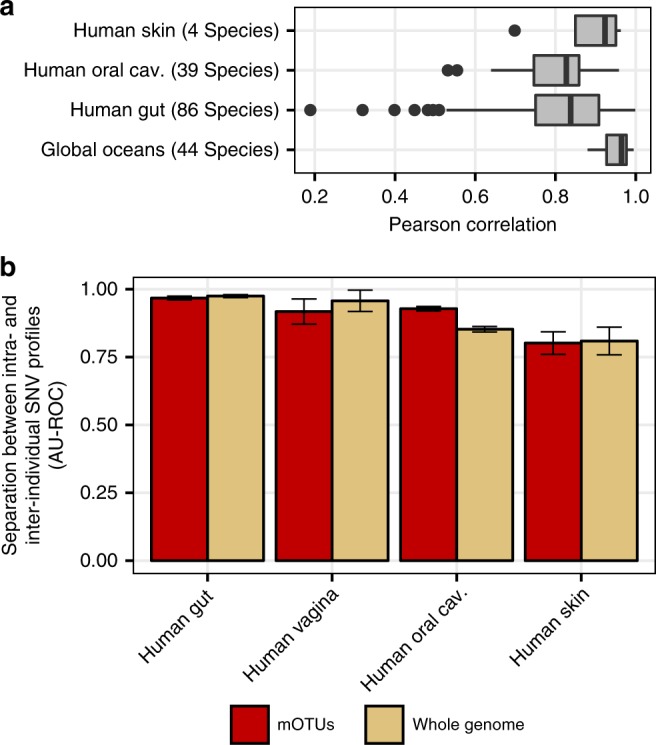
Metagenomic sequencing has greatly improved our ability to profile the composition of environmental and host-associated microbial communities. However, the dependency of most methods on reference genomes, which are currently unavailable for a substantial fraction of microbial species, introduces estimation biases. We present an updated and functionally extended tool based on universal (i.e., reference-independent), phylogenetic marker gene (MG)-based operational taxonomic units (mOTUs) enabling the profiling of >7700 microbial species. As more than 30% of them could not previously be quantified at this taxonomic resolution, relative abundance estimates based on mOTUs are more accurate compared to other methods. As a new feature, we show that mOTUs, which are based on essential housekeeping genes, are demonstrably well-suited for quantification of basal transcriptional activity of community members. Furthermore, single nucleotide variation profiles estimated using mOTUs reflect those from whole genomes, which allows for comparing microbial strain populations (e.g., across different human body sites).
Overview
The claims and statistics of this paper haven’t been checked yet.
Run the check — free, no account needed. It reads the open-access text and checks the sources it cites.
Integrity signals
Registry
Cites
Statistics
Figures
Verification
Claims the paper makes
The claims and statistics of this paper haven’t been checked yet.
Run the check — free, no account needed. It reads the open-access text and checks the sources it cites.
Claims other papers make about this one
Each is checked against this paper’s own text: does it say what the citing paper says it does?
In the citing paper
“These three profiling tools have consistently been shown to outperform other methods across multiple evaluations (McIntyre et al., 2017; Meyer et al., 2019; Milanese et al., 2019; Sczyrba et al., 2017; Truong et al., 2015; Ye et al., 2019).”
From Integrating taxonomic, functional, and strain-level profiling of diverse microbial communities with bioBakery 3 (2021) · cites this paper as Milanese et al., 2019
In the citing paper
“Additional phylogenetic marker gene-based operational taxonomic unit profiling is performed using mOTUs2 (35) on all reads that pass QC, which allows sensitive and accurate quantification for both known and unknown species.”
From MGnify: the microbiome analysis resource in 2020 (2019) · cites this paper as [35]
Self-check
Percentages, sums and reported differences re-computed from the paper’s own numbers.
The self-check needs the paper’s full text.
Citations
Cites
The Sequence Alignment/Map format and SAMtools
Li, H., Handsaker, B., Wysoker, A., Fennell, T., Ruan, J., Homer, N., Marth, G., Abecasis, G., Durbin, R., & 1000 Genome Project Data Processing Subgroup (2009) · Bioinformatics · doi:10.1093/bioinformatics/btp352 · Cited by 62,041
Fast and accurate short read alignment with Burrows-Wheeler transform
Li, H., & Durbin, R. (2009) · Bioinformatics · doi:10.1093/bioinformatics/btp324 · Cited by 58,607
IQ-TREE: A Fast and Effective Stochastic Algorithm for Estimating Maximum-Likelihood Phylogenies
Nguyen, L.-T., Schmidt, H. A., von Haeseler, A., & Minh, B. Q. (2015) · Molecular Biology and Evolution · doi:10.1093/molbev/msu300 · Cited by 26,046
UPARSE: highly accurate OTU sequences from microbial amplicon reads
Edgar, R. C. (2013) · Nature Methods · doi:10.1038/nmeth.2604 · Cited by 16,770
Fast, scalable generation of high-quality protein multiple sequence alignments using Clustal Omega
Sievers, F., Wilm, A., Dineen, D., Gibson, T., Karplus, K., Li, W.-Z., Lopez, R., McWilliam, H., Remmert, M., Söding, J., et al. (2011) · Molecular Systems Biology · doi:10.1038/msb.2011.75 · Cited by 15,576
pROC: an open-source package for R and S+ to analyze and compare ROC curves
Robin, X., Turck, N., Hainard, A., Tiberti, N., Lisacek, F., Sanchez, J.-C., & Müller, M. (2011) · BMC Bioinformatics · doi:10.1186/1471-2105-12-77 · Cited by 13,697
Parks, D. H., Imelfort, M., Skennerton, C. T., Hugenholtz, P., & Tyson, G. W. (2015) · Genome Research · doi:10.1101/gr.186072.114 · Cited by 12,496
Structure, function and diversity of the healthy human microbiome
The Human Microbiome Project Consortium (2012) · Nature · doi:10.1038/nature11234 · Cited by 11,726
A human gut microbial gene catalogue established by metagenomic sequencing
MetaHIT Consortium, Qin, J., Li, R., Raes, J., Arumugam, M., Burgdorf, K. S., Manichanh, C., Nielsen, T., Pons, N., Levenez, F., et al. (2010) · Nature · doi:10.1038/nature08821 · Cited by 11,624
Self-citationVSEARCH: a versatile open source tool for metagenomics
(2016) · doi:10.7717/peerj.2584 · Cited by 10,773
Cited by
Sorted by citations
Items 201–300 of 477
Mechanistic insights into the key marine dimethylsulfoniopropionate synthesis enzyme DsyB/DSYB
Li, C., Crack, J. C., Newton‐Payne, S., Murphy, A. R. J., Chen, X., Pinchbeck, B. J., Zhou, S., Williams, B. T., Peng, M., Zhang, X., et al. (2022) · mLife · doi:10.1002/mlf2.12030 · Cited by 17
Chen, X., Tang, K., Zhang, M., Liu, S., Chen, M., Zhan, P., Fan, W., Chen, C. A., & Zhang, Y. (2022) · Microbiome · doi:10.1186/s40168-022-01351-7 · Cited by 16
“We normalized the KO/COG functional profiles to relative cell numbers, dividing the abundance of a given gene by the median abundance of 38 universal single-copy marker genes [52].”
Liu, Y., Brinkhoff, T., Berger, M., Poehlein, A., Voget, S., Paoli, L., Sunagawa, S., Amann, R., & Simon, M. (2023) · Microbiome · doi:10.1186/s40168-023-01644-5 · Cited by 15
Guillonneau, R., Murphy, A. R. J., Teng, Z., Wang, P., Zhang, Y., Scanlan, D. J., & Chen, Y. (2022) · Proceedings of the National Academy of Sciences · doi:10.1073/pnas.2203057119 · Cited by 15
Villette, R., Sunyer, J. O., Novikova, P. V., Aho, V. T. E., Петров, В. А., Hickl, O., Busi, S. B., Rudder, C. D., Kunath, B. J., Heintz‐Buschart, A., et al. (2025) · Microbiome · doi:10.1186/s40168-025-02227-2 · Cited by 17
“Structural features were quantified on MG and MT level using featureCounts [72].”
Surgical Treatment for Colorectal Cancer Partially Restores Gut Microbiome and Metabolome Traits
Shiroma, H., Shiba, S., Erawijantari, P. P., Takamaru, H., Yamada, M., Sakamoto, T., Kanemitsu, Y., Mizutani, S., Soga, T., Saito, Y., et al. (2022) · mSystems · doi:10.1128/msystems.00018-22 · Cited by 20
BusyBee Web: towards comprehensive and differential composition-based metagenomic binning
Schmartz, G. P., Hirsch, P., Amand, J., Dastbaz, J., Fehlmann, T., Kern, F., Müller, R., & Keller, A. (2022) · Nucleic Acids Research · doi:10.1093/nar/gkac298 · Cited by 14
Phan, H. V., Yasuda, S., Oba, K., Tsukamoto, H., Hori, T., Kuroiwa, M., & Terada, A. (2025) · The ISME Journal · doi:10.1093/ismejo/wraf021 · Cited by 14
Hu, H., Tan, Y., Li, C., Chen, J., Kou, Y., Xu, Z. Z., Liu, Y., Tan, Y. Q., & Dai, L. (2022) · iMeta · doi:10.1002/imt2.41 · Cited by 12
Jørgensen, M., Nørgaard, J. C., Ilett, E. E., Marandi, R. Z., Noguera-Julián, M., Paredes, R., Murray, D. D., Lundgren, J. D., MacPherson, C. R., & Sengeløv, H. (2022) · International Journal of Molecular Sciences · doi:10.3390/ijms231911115 · Cited by 14
The Limits and Avoidance of Biases in Metagenomic Analyses of Human Fecal Microbiota
Bergsten, E., Mestivier, D., & Sobhani, I. (2020) · Microorganisms · doi:10.3390/microorganisms8121954 · Cited by 16
Patumcharoenpol, P., Nakphaichit, M., Panagiotou, G., Senavonge, A., Suratannon, N., & Vongsangnak, W. (2021) · PLoS Computational Biology · doi:10.1371/journal.pcbi.1008487 · Cited by 15
JAMS - A framework for the taxonomic and functional exploration of microbiological genomic dataPreprint
McCulloch, J. A., Badger, J. H., Cannon, N., Rodrigues, R. R., Valencia, M. E., Barb, J. J., Fernandes, M. R., Balaji, A. K., Crowson, L., Ó’hUigín, C., et al. (2023) · bioRxiv (Cold Spring Harbor Laboratory) · doi:10.1101/2023.03.03.531026 · Cited by 16
Wu, Q., Boonma, P., Badu, S., Yalçınkaya, N., So, S. Y., Garey, K. W., Williams, K. C., Arnold, L. E., Shulman, R. J., Kellermayer, R., et al. (2023) · npj Biofilms and Microbiomes · doi:10.1038/s41522-023-00421-4 · Cited by 15
Benchmarking Metagenomic Classifiers on Simulated Ancient and Modern Metagenomic Data
Pusadkar, V., & Azad, R. K. (2023) · Microorganisms · doi:10.3390/microorganisms11102478 · Cited by 13
“DNA-to-DNA profilers included Kraken2 (and its add-on version for more accurate abundance estimation, namely, Bracken) and KrakenUniq [22,23,48] DNA to protein profiler included Kaiju [28], and DNA to markers profilers included MetaPhlAn4 [49] and mOTUs [32] (Table 2).”
InfluentialSurface microlayer-mediated virome dissemination in the Central Arctic
Rahlff, J., Westmeijer, G., Weißenbach, J., Antson, A. A., & Holmfeldt, K. (2024) · Microbiome · doi:10.1186/s40168-024-01902-0 · Cited by 13
“Sickle v.1.33 [35] was subsequently run in pe mode and -t sanger setting. mOTUs v.3.0.2 [36, 37] was used on trimmed reads with options -”
InfluentialYuan, L., Yu, P., Huang, X., Zhao, Z., Chen, L.-X., & Ju, F. (2024) · Environment International · doi:10.1016/j.envint.2024.109125 · Cited by 13
Saenz, C., Nigro, E., Gunalan, V., & Arumugam, M. (2022) · Frontiers in Bioinformatics · doi:10.3389/fbinf.2022.846922 · Cited by 17
Long-term impact of fecal transplantation in healthy volunteersPreprint
Goloshchapov, O. V., Olekhnovich, E. I., Sv, S., Moiseev, I., Kucher, М. A., Fedorov, D. E., Pavlenko, A. V., Manolov, A. I., Валерьевич, Г. В., Veselovsky, V. A., et al. (2019) · bioRxiv (Cold Spring Harbor Laboratory) · doi:10.1101/671644 · Cited by 13
Ulrich, J.-U., & Renard, B. Y. (2024) · Genome Research · doi:10.1101/gr.278623.123 · Cited by 13
“We also did not consider the MetaPhlAn2 (Truong et al. 2015) and mOTUs2 (Milanese et al. 2019), which rely on marker genes and are not suitable for species assignments on viral data sets.”
Ortíz-Severín, J., Hojas, I., Redin, F., Serón, E., Santana, J., Maass, A., & Cambiazo, V. (2025) · Antibiotics · doi:10.3390/antibiotics14020122 · Cited by 12
Coral microbiomes as reservoirs of unknown genomic and biosynthetic diversity
Wiederkehr, F., Paoli, L., Richter, D., Racunica, D., Ruscheweyh, H., Sperfeld, M., O’Brien, J., Miravet‐Verde, S., Streiff, A. B., Ransome, J., et al. (2026) · Nature · doi:10.1038/s41586-026-10159-6 · Cited by 14
Unveiling the role of emerging metagenomics for the examination of hypersaline environments
Dindhoria, K., Manyapu, V., Ali, A., & Kumar, R. (2023) · Biotechnology and Genetic Engineering Reviews · doi:10.1080/02648725.2023.2197717 · Cited by 12
Constructing phylogenetic trees for microbiome data analysis: A mini-review
Liu, R., Qiao, X., Shi, Y., Peterson, C. B., Bush, W. S., Cominelli, F., Wang, M., & Zhang, L. (2024) · Computational and Structural Biotechnology Journal · doi:10.1016/j.csbj.2024.10.032 · Cited by 12
Olekhnovich, E. I., Ivanov, A. B., Игоревич, У. В., & Ilina, E. N. (2021) · mSystems · doi:10.1128/msystems.00811-21 · Cited by 12
CONSULT-II: accurate taxonomic identification and profiling using locality-sensitive hashing
Şapcı, A. O. B., Rachtman, E., & Mirarab, S. (2024) · Bioinformatics · doi:10.1093/bioinformatics/btae150 · Cited by 13
Functional resistomes in municipal wastewater treatment plants pose challenges to public health
Wirth, R., Pap, B., Szuhaj, M., Bagi, Z., Farkas, Z. J., Kovács, K. L., & Maróti, G. (2025) · Water Research · doi:10.1016/j.watres.2025.124663 · Cited by 11
Metagenomic next generation sequencing for studying antibiotic resistance genes in the environment
Li, B., & Yan, T. (2023) · Advances in applied microbiology · doi:10.1016/bs.aambs.2023.05.001 · Cited by 11
Payet, R. D., Bilham, L. J., Kabir, S. M. T., Monaco, S., Norcott, A. R., Allen, M. G. E., Zhu, X.-Y., Davy, A. J., Brearley, C. A., Todd, J. D., et al. (2024) · Nature Communications · doi:10.1038/s41467-024-51758-z · Cited by 11
Wirth, R., Shetty, P., Bagi, Z., Kovács, K. L., & Maróti, G. (2024) · Water Research · doi:10.1016/j.watres.2024.122650 · Cited by 11
Sun, Z., Zhang, M., Li, M., Bhaskar, Y., Zhao, J., Ji, Y., Cui, H., Zhang, H., & Sun, Z. (2022) · Microbiology Spectrum · doi:10.1128/spectrum.00925-21 · Cited by 12
Overgaard, C. K., Tao, K., Zhang, S., Christensen, B. T., Blahovska, Z., Radutoiu, S., Kelly, S. J., & Dueholm, M. S. (2022) · Frontiers in Microbiology · doi:10.3389/fmicb.2022.942396 · Cited by 11
Exercise and microbiome: From big data to therapy
Meng, D., Ai, S., Spanos, M., Shi, X., Li, G., Crețoiu, D., Zhou, Q., & Xiao, J. (2023) · Computational and Structural Biotechnology Journal · doi:10.1016/j.csbj.2023.10.034 · Cited by 12
Growth rates of marine prokaryotes are extremely diverse, even among closely related taxa
Deulofeu-Capo, O., Sebastián, M., Auladell, A., Cardelús, C., Ferrera, I., Sánchez, O., & Gasol, J. M. (2024) · ISME Communications · doi:10.1093/ismeco/ycae066 · Cited by 10
da Rocha, U. N., Kasmanas, J. C., Toscan, R. B., Sanches, D. S., Magnúsdóttir, S., & Saraiva, J. (2024) · PLoS Computational Biology · doi:10.1371/journal.pcbi.1012530 · Cited by 10
A Deep Embedded Clustering Algorithm for the Binning of Metagenomic Sequences
Bao, H. Q., Vinh, L. V., & Hoài, T. V. (2022) · IEEE Access · doi:10.1109/access.2022.3176954 · Cited by 10
Population Genetics of Host-Associated Microbiomes
Bobay, L., & Raymann, K. (2019) · Current Molecular Biology Reports · doi:10.1007/s40610-019-00122-y · Cited by 9
Kapustina, Ž., Medžiūnė, J., Alzbutas, G., Rokaitis, I., Matjošaitis, K., Mackevičius, G., Žeimytė, S., Karpus, L., & Lubys, A. (2021) · Microbial Genomics · doi:10.1099/mgen.0.000624 · Cited by 11
Smith, B. J., Zhao, C., Dubinkina, V. B., Jin, X., Zahavi, L., Shoer, S., Anderson, J. M., Segal, E., & Pollard, K. S. (2025) · Genome Research · doi:10.1101/gr.279543.124 · Cited by 11
“” Pangenomeprofilingestimatesthemeansequencingdepth,some-timescalledverticalcoverage,ofagenefamilyasthemeannumber of reads aligning to each base of a representative sequence (Milanese et al. 2019).”
Liu, G.-L., Wu, S.-L., Sun, Z., Xing, M.-D., Chi, Z., & Liu, Y. (2024) · Applied and Environmental Microbiology · doi:10.1128/aem.00255-24 · Cited by 9
MAGinator enables accurate profiling of de novo MAGs with strain-level phylogenies
Zachariasen, T., Russel, J., Petersen, C., Vestergaard, G., Shah, S. A., Atienza, P., Passali, M., Turvey, S. E., Sørensen, S. J., Lund, O., et al. (2024) · Nature Communications · doi:10.1038/s41467-024-49958-8 · Cited by 9
Takewaki, D., Kiguchi, Y., Masuoka, H., Manu, M. S., Raveney, B. J. E., Narushima, S., Kurokawa, R., Ogata, Y., Hattori, M., Kimura, Y., et al. (2024) · Cell Reports · doi:10.1016/j.celrep.2024.114785 · Cited by 11
Rahlff, J., Wietz, M., Giebel, H., Bayfield, O. W., Nilsson, E., Bergström, K., Kieft, K., Anantharaman, K., Ribas‐Ribas, M., Schweitzer, H. D., et al. (2023) · ISME Communications · doi:10.1038/s43705-023-00307-8 · Cited by 9
Methods for exploring the faecal microbiome of premature infants: a review
Westaway, J. A. F., Huerlimann, R., Miller, C., Kandasamy, Y., Norton, R. E., & Rudd, D. (2021) · Maternal Health Neonatology and Perinatology · doi:10.1186/s40748-021-00131-9 · Cited by 11
White, R. A., III, Garoutte, A., Mclachlan, E. E., Tiemann, L. K., Evans, S. E., & Friesen, M. (2023) · Agronomy · doi:10.3390/agronomy13051294 · Cited by 9
Reference genome-independent taxonomic profiling of microbiomes with mOTUs3Preprint
Ruscheweyh, H., Milanese, A., Paoli, L., Karcher, N., Clayssen, Q., Metzger, M. I., Wirbel, J., Peer Bork, B., Mende, D. R., Zeller, G., et al. (2021) · bioRxiv (Cold Spring Harbor Laboratory) · doi:10.1101/2021.04.20.440600 · Cited by 9
Binning meets taxonomy: TaxVAMB improves metagenome binning using bi-modal variational autoencoderPreprint
Kutuzova, S., Líndez, P. P., Nielsen, K. N., Olsen, N. S., Riber, L., Gobbi, A., Junco, L. M. F., Dougherty, P. E., Westergaard, J. C., Christensen, S., et al. (2024) · bioRxiv (Cold Spring Harbor Laboratory) · doi:10.1101/2024.10.25.620172 · Cited by 9
Becker, A., Schmartz, G. P., Gröger, L., Grammes, N., Galata, V., Philippeit, H., Weiland, J., Ludwig, N., Meese, E., Tierling, S., et al. (2021) · doi:10.1101/2021.02.07.21251098 · Cited by 102
Increased Nutrient Levels Enhance Bacterial Exopolysaccharides Production in the Context of Algae
Lipsman, V., & Segev, E. (2025) · Environmental Microbiology Reports · doi:10.1111/1758-2229.70071 · Cited by 9
“…conducted as described in Equation (4) (Salazar et al. 2019): As the MGs were shown to be constitutively expressed across many different conditions (Milanese et al. 2019), MGs normalised transcript abundance can be interpreted as the relative per-MAG number of transcripts of a given ORF (Salazar…”
Bioinformatic approaches to blood and tissue microbiome analyses: challenges and perspectives
Sirasani, J. P., Gardner, C., Jung, G., Lee, H., & Ahn, T.-H. (2025) · Briefings in Bioinformatics · doi:10.1093/bib/bbaf176 · Cited by 10
Quality Control in Metagenomics Data
Gihawi, A., Cardenas, R. P., Hurst, R., & Brewer, D. S. (2023) · Methods in molecular biology · doi:10.1007/978-1-0716-3072-3_2 · Cited by 8
Wang, A., Huang, F., Wang, W., Zhao, Y., Su, Y., Lei, Z., Gao, R., Tao, Y., Wei, J., Cheng, H.-Y., et al. (2024) · Engineering · doi:10.1016/j.eng.2024.04.022 · Cited by 8
Computational Approaches for Unraveling the Effects of Variation in the Human Genome and Microbiome
Zhu, C., Miller, M., Zeng, Z., Wang, Y., Mahlich, Y., Aptekmann, A. A., & Bromberg, Y. (2020) · Annual Review of Biomedical Data Science · doi:10.1146/annurev-biodatasci-030320-041014 · Cited by 8
Maistrenko, O. M., Serga, S. V., Kovalenko, P. A., & Kozeretska, I. A. (2023) · Cytology and Genetics · doi:10.3103/s0095452723030064 · Cited by 7
Taming large-scale genomic analyses via sparsified genomics
Alser, M., Eudine, J., & Mutlu, O. (2025) · Nature Communications · doi:10.1038/s41467-024-55762-1 · Cited by 7
Generation and application of pseudo–long reads for metagenome assembly
Sim, M., Lee, J., Wy, S., Park, N., Lee, D., Kwon, D., & Kim, J. (2022) · GigaScience · doi:10.1093/gigascience/giac044 · Cited by 7
Shadoff, R., Panoyan, M. A., & Novroski, N. M. M. (2022) · Forensic Genomics · doi:10.1089/forensic.2022.0007 · Cited by 7
“117 FIG.”
metaGEM: reconstruction of genome scale metabolic models directly from metagenomesPreprint
Zorrilla, F., Patil, K. R., & Zelezniak, A. (2021) · bioRxiv (Cold Spring Harbor Laboratory) · doi:10.1101/2020.12.31.424982 · Cited by 7
C. difficile may be overdiagnosed in adults and is a prevalent commensal in infantsPreprint
Ferretti, P., Wirbel, J., Maistrenko, O. M., Rossum, T. V., Alves, R., Fullam, A., Akanni, W. A., Schudoma, C., Schwarz, A. M., Thielemann, R., et al. (2022) · bioRxiv (Cold Spring Harbor Laboratory) · doi:10.1101/2022.02.16.480740 · Cited by 7
“…mOTUs-based species-level taxonomic profiling, C. difficile was detectable in just 30% of CDI samples at established metagenomic detection limits (Milanese et al. 2019) ( Figure 1A ), with considerable variance across study populations (9.2%-92.3%), and with much lower prevalence among diseased…”
InfluentialWirbel, J., Essex, M., Forslund, S. K., & Zeller, G. (2022) · bioRxiv (Cold Spring Harbor Laboratory) · doi:10.1101/2022.05.09.491139 · Cited by 7
Metagenomics: a powerful lens viewing the microbial world
Tiwari, N., Bansal, M., & Sharma, J. (2021) · Wastewater Treatment Reactors · doi:10.1016/b978-0-12-823991-9.00007-1 · Cited by 11
Transcriptional Difference of Deep-Sea Microorganisms under Different Sampling Methods
He, Y., Zhang, H., Baltar, F., & Wang, Y. (2025) · Environmental Science & Technology · doi:10.1021/acs.est.4c05624 · Cited by 7
Quantitative metagenomics for marine prokaryotes and photosynthetic eukaryotes
Bei, Q., Williams, N. L. R., Furtado, L. E., Blasi, D. D., Williams, J., Brotas, V., Tarran, G. A., Rees, A. P., Bowler, C., & Fuhrman, J. A. (2025) · ISME Communications · doi:10.1093/ismeco/ycaf131 · Cited by 10
“These genes, which, as the name implies, are t ypically present as one copy per genome, have been widely used in phylogenetic analysis [8, 9].”
High-resolution microbiome analysis of host-rich samples using 2bRAD-M without host depletion
Jiang, Y., Liu, J., Zhang, Y., Zhou, L., Kao, E., Hou, S., Niu, Q., Liu, Y., Xu, Z. Z., Ding, T., et al. (2025) · npj Biofilms and Microbiomes · doi:10.1038/s41522-025-00851-2 · Cited by 6
“For WMS sequencing, widely recognized bioinformatic tools like MetaPhlAn4 [22] and mOTUs2 [23] were utilized to taxonomically derive pro�les down to genus and species levels (Fig.”
Aminolipids in bacterial membranes and the natural environment
Liu, S., Silvano, E., Li, M., Mausz, M. A., Rihtman, B., Guillonneau, R., Geiger, O., Scanlan, D. J., & Chen, Y. (2024) · The ISME Journal · doi:10.1093/ismejo/wrae229 · Cited by 6
van der Ploeg, G. R., Westerhuis, J. A., Heintz‐Buschart, A., & Smilde, A. K. (2025) · mSystems · doi:10.1128/msystems.00472-25 · Cited by 6
“5.1 [33]).”
InfluentialOyarzun, I., Nevé, B. L., Yáñez, F., Xie, Z., Pichaud, M., Serrano-Gómez, G., Roca, J., Veiga, P., Azpiroz, F., Tap, J., et al. (2022) · Computational and Structural Biotechnology Journal · doi:10.1016/j.csbj.2022.04.001 · Cited by 6
Yersin, S., Garneau, J. R., Schneeberger, P. H. H., Osman, K. A., Cercamondi, C. I., Muhummed, A. M., Tschopp, R., Zinsstag, J., & Vonaesch, P. (2023) · Scientific Reports · doi:10.1038/s41598-023-47748-8 · Cited by 6
Yates, M. C., Wilcox, T. M., Kay, S. L., & Heath, D. D. (2022) · bioRxiv (Cold Spring Harbor Laboratory) · doi:10.1101/2022.12.06.519311 · Cited by 6
Expanding the human gut microbiome atlas of AfricaPreprint
Maghini, D. G., Oduaran, O. H., Wirbel, J., Ingasia, L. A. O., Smyth, N., Mathema, T., Belger, C. W., Agongo, G., Boua, P. R., Choma, S., et al. (2024) · bioRxiv (Cold Spring Harbor Laboratory) · doi:10.1101/2024.03.13.584859 · Cited by 6
Toward hypothesis-driven, personalized microbiome screening
Sedrani, C., & Wilmes, P. (2022) · Cell Reports Methods · doi:10.1016/j.crmeth.2021.100139 · Cited by 5
Exaggerated trans-membrane charge of ammonium transporters in nutrient-poor marine environments
Kellom, M., Pagliara, S., Richards, T. A., & Santoro, A. E. (2022) · Open Biology · doi:10.1098/rsob.220041 · Cited by 4
Proton Pump Inhibitors Modulate Gene Expression Profile in Esophageal Mucosa and Microbiome
Rajagopala, S. V., Shilts, M. H., Correa, H., Das, S. R., Choksi, Y. A., Jacobse, J., Goettel, J. A., & Hiremath, G. S. (2023) · The Journal of Pediatric Pharmacology and Therapeutics · doi:10.5863/1551-6776-28.6.504 · Cited by 5
Genome Recovery, Functional Profiling, and Taxonomic Classification from Metagenomes
Albanese, D., & Donati, C. (2021) · Methods in molecular biology · doi:10.1007/978-1-0716-1099-2_10 · Cited by 5
Zhang, Z., Zhang, L., Zhang, G., Zhao, Z., Wang, H., & Ju, F. (2023) · Microbiology Spectrum · doi:10.1128/spectrum.04282-22 · Cited by 5
Forward variable selection improves the power of random forest for high- dimensional microbiome dataPreprint
Dang, T., & Kishino, H. (2020) · bioRxiv (Cold Spring Harbor Laboratory) · doi:10.1101/2020.10.29.361360 · Cited by 5
Johnson, J. E., Sun, S., & Fodor, A. A. (2022) · bioRxiv (Cold Spring Harbor Laboratory) · doi:10.1101/2022.04.04.487034 · Cited by 7
Maruyama, T., Ishikawa, D., Kurokawa, R., Masuoka, H., Nomura, K., Haraikawa, M., Orikasa, M., Odakura, R., Koma, M., Omori, M., et al. (2025) · Biomedicines · doi:10.3390/biomedicines13081799 · Cited by 4
Karagiannis, T. T., Chen, Y., Bald, S., Tai, A., Reed, E. R., Milman, S., Andersen, S. L., Perls, T. T., Segrè, D., Sebastiani, P., et al. (2026) · PLoS Computational Biology · doi:10.1371/journal.pcbi.1013883 · Cited by 4
“The methods underlying these classification tools vary and include marker-gene-based methods (e.g., MetaPhlAn [2], mOTUs [3]), k-mer-based approaches (e.g., Kraken [4,5], Bracken [6,7], Centrifuge [8]), and protein-based methods (e.g., Kaiju [9], DIAMOND [10]), each with different strengths.”
MBCN: A novel reference database for Effcient Metagenomic analysis of human gut microbiome
Zheng, B., Xu, J.-M., Zhang, Y., Qin, J.-J., Yuan, D., Fan, T., Wu, W., Chen, Y., & Jiang, Y.-Y. (2024) · Heliyon · doi:10.1016/j.heliyon.2024.e37422 · Cited by 3
“…into four groups based on how they establish sequence similarity: (i) nucleotide or protein alignment methods such as Centrifuge [53], Kaiju [54] and DIAMOND [55], (ii) marker gene methods such as MetaPhlAn [56] and mOTUs [57], and (iii) k-mer based methods such as Kraken2 [58] and Bracken [59].”
MethodEcological diversity and metabolic strategies of widespread Marinisomatota in global oceans
Xiang, S., Li, J., Chen, Z., Cheng, R., Wang, L., Yu, L., Wei, G., Guan, X., Briggs, B. R., King, G. M., et al. (2025) · Marine Life Science & Technology · doi:10.1007/s42995-025-00293-x · Cited by 4
“…derive from samples collected during prominent marine expeditions, including Tara Oceans (virus-enriched, n = 190; prokaryote-enriched, n = 180) (Salazar et al. 2019; Sunagawa et al. 2015), the BioGEOTRACES Expedition ( n = 480), the Hawaiian Ocean Time-series (HOT) project ( n = 68), the…”
InfluentialA practical guide on environmental genomics for prokaryotic systematics
Ernster, N. M., & Rodriguez‐R, L. M. (2025) · Systematic and Applied Microbiology · doi:10.1016/j.syapm.2025.126643 · Cited by 4
Seasonal variability in community structure and metabolism of active deep-sea microorganisms
He, Y., Baltar, F., & Wang, Y. (2025) · The ISME Journal · doi:10.1093/ismejo/wraf214 · Cited by 4
“…divided the TPM values by the summed counts of 40 universally conserved, single-copy, and constitutively expressed marker genes suggested by mOTUs1 [44, 45] (K06942, K01889, K01887,K02950,K02992,K02967,K02867,K02863,K03043,K02926, K02906,K02886,K02890,K02982,K02874,K02931,K02994,K02933,…”
Wolbachia in Antarctic terrestrial invertebrates: Absent or undiscovered?
Serga, S. V., Kovalenko, P. A., Maistrenko, O. M., Deconninck, G., Shevchenko, O., Iakovenko, N., Protsenko, Y., Susulovsky, A., Kaczmarek, Ł., Pavlovska, M., et al. (2024) · Environmental Microbiology Reports · doi:10.1111/1758-2229.70040 · Cited by 4
Kreis, V., Toffano‐Nioche, C., Denève-Larrazet, C., Marvaud, J., Garneau, J. R., Dumont, F., van Dijk, E., Jaszczyszyn, Y., Boutserin, A., D’Angelo, F., et al. (2024) · mSystems · doi:10.1128/msystems.00863-24 · Cited by 4
“We applied mOTUs2 program well-adapted for taxonomic profiling of microbial community on housekeeping marker genes from transcriptomic data (46).”
Suzuki, S., & Yamada, T. (2020) · PeerJ · doi:10.7717/peerj.8722 · Cited by 4
“For relative abundance, we used the mOTUs2 pipeline with the default parameter set (Milanese et al., 2019).”
Interactive Web-Based Services for Metagenomic Data Analysis and Comparisons
Abdelsalam, N. A., Elshora, H., & El-Hadidi, M. S. (2023) · Methods in molecular biology · doi:10.1007/978-1-0716-3072-3_7 · Cited by 4
metaGOflow: a workflow for the analysis of marine Genomic Observatories shotgun metagenomics data
Zafeiropoulos, H., Beracochea, M., Ninidakis, S., Exter, K. M., Potirakis, A., Moro, G. D., Richardson, L., Corre, E., Machado, J., Pafilis, E., et al. (2022) · GigaScience · doi:10.1093/gigascience/giad078 · Cited by 4
“…the SILVA database (version 132) for the taxonomic classification of the small subunit (SSU) and the large subunit (LSU) sequences, while mOTUs2 [53] quantifies both known and unknown taxa on the filtered sequences. metaGOflow automatically returns Krona plots (an interactive visualization…”
Molecular and associated approaches for studying soil biota and their functioning
Karaöz, U., Emerson, J., & Brodie, E. (2024) · Elsevier eBooks · doi:10.1016/b978-0-12-822941-5.00006-5 · Cited by 4
PhySpeTree: an automated pipeline for reconstructing phylogenetic species trees
Fang, Y., Liu, C., Lin, J.-Y., Li, X., Alavian, K. N., Yang, Y., & Niu, Y. (2019) · BMC Evolutionary Biology · doi:10.1186/s12862-019-1541-x · Cited by 3
Drivers and Determinants of Strain Dynamics Following Faecal Microbiota TransplantationPreprint
Schmidt, T., Li, S. S., Maistrenko, O. M., Akanni, W. A., Coelho, L. P., Dolai, S., Fullam, A., Glazek, A. M., Hercog, R., Herrema, H., et al. (2021) · bioRxiv (Cold Spring Harbor Laboratory) · doi:10.1101/2021.09.30.462010 · Cited by 4
“Taxonomic profiles per sample were obtained using mOTUs v2 56 .”
The Rumen Microbiome Inhibits Methane Formation Through Dietary Choline SupplementationPreprint
Li, Y., Kreuzer, M., Clayssen, Q., Ebert, M., Ruscheweyh, H., Sunagawa, S., Kunz, C., Attwood, G. T., Amelchanka, S. L., & Terranova, M. (2021) · Research Square · doi:10.21203/rs.3.rs-640876/v1 · Cited by 4
Metagenomics of Bacterial Consortia for the Bioremediation of Organic Pollutants
Garrido‐Sanz, D., Sansegundo‐Lobato, P., Martín, M., Redondo‐Nieto, M., & Rivilla, R. (2022) · doi:10.1002/9781119762621.ch30 · Cited by 4
C. difficile may be overdiagnosed in adults and is a prevalent commensal in infantsPreprint
Ferretti, P., Wirbel, J., Maistrenko, O. M., Rossum, T. V., Alves, R., Fullam, A., Akanni, W. A., Schudoma, C., Schwarz, A. M., Thielemann, R., et al. (2023) · doi:10.7554/elife.90111 · Cited by 4
C. difficile may be overdiagnosed in adults and is a prevalent commensal in infantsPreprint
Ferretti, P., Wirbel, J., Maistrenko, O. M., Rossum, T. V., Alves, R., Fullam, A., Akanni, W. A., Schudoma, C., Schwarz, A. M., Thielemann, R., et al. (2023) · doi:10.7554/elife.90111.1 · Cited by 4
Yuan, L., Chen, L.-X., Yu, H., Zhou, J. Z., Sun, R., & Ju, F. (2024) · bioRxiv (Cold Spring Harbor Laboratory) · doi:10.1101/2024.03.12.584551 · Cited by 4
Liu, C., Tang, Z., Li, L., Kang, Y., Teng, Y., & Yu, Y. (2024) · Chinese Medical Journal · doi:10.1097/cm9.0000000000003182 · Cited by 3
“[14,15] These methods have enabled a deeper exploration of the microbiome, uncovering correlations between microbes and health status, [16,17] dietary habits, [18,19] as well as the characterization of the evolution of microbial species and strains.”
MethodMicrobiome and Communication Disorders: A Tutorial for Clinicians
Venkatraman, A., Davis, R. J., Tseng, W., & Thibeault, S. L. (2024) · Journal of Speech Language and Hearing Research · doi:10.1044/2024_jslhr-24-00436 · Cited by 3
Lemonnier, C., Alric, B., Domaizon, I., & Rimet, F. (2025) · Molecular Ecology Resources · doi:10.1111/1755-0998.70077 · Cited by 4
Structural basis and evolutionary pathways of glycerol-1-phosphate transport in marine bacteria
Wang, N., Westermann, L. M., Li, M., Li, C., Murphy, A. R. J., Gu, Z.-T., Silvano, E., Blindauer, C. A., Lidbury, I. D. E. A., Zhang, Y., et al. (2025) · Proceedings of the National Academy of Sciences · doi:10.1073/pnas.2524546122 · Cited by 3
Metadata
- Authors
- Milanese, A., Mende, D. R., Paoli, L., Salazar, G., Ruscheweyh, H.-J., Cuenca, M., Hingamp, P., Alves, R., Costea, P. I., Coelho, L. P., Schmidt, T. S. B., Almeida, A., Mitchell, A. L., Finn, R. D., Huerta-Cepas, J., Bork, P., Zeller, G., & Sunagawa, S.
- Affiliations
- European Molecular Biology Laboratory (DE)
- University of Hawaiʻi at Mānoa (US)
- SIB Swiss Institute of Bioinformatics (CH)
- Centre National de la Recherche Scientifique (FR)
- Heidelberg University (DE)
- European Bioinformatics Institute (GB)
- Corresponding author
- Zeller, Georg
- Sunagawa, Shinichi
- ORCID
- Venue
- Nature Communications
- Published
- 2019-03-04
- Volume
- 10
- Issue
- 1
- Pages
- 1014-1014
- ISSN
- 2041-1723 (ISSN-L)
- PMC
- PMC6399450
- OpenAlex
- W2920716817
- Cited by
- 446
- References
- 59
- Citations by year
- 2026: 24 · 2025: 43 · 2024: 74 · 2023: 73 · 2022: 89 · 2021: 82 · 2020: 42 · 2019: 17
- FWCI
- 20.03
- Type
- journal article
- Language
- en
- Open access
- gold
- doi.org
- Locations
- Nature Communications (publishedVersion, cc-by)
- Europe PMC (PubMed Central) (publishedVersion, cc-by)
- PubMed Central (publishedVersion, cc-by)
- PubMed (publishedVersion)
- MDC Repository (Max-Delbrueck-Center for Molecular Medicine) (acceptedVersion)
- HAL (submittedVersion, cc-by)
- RePEc: Research Papers in Economics (submittedVersion)
- DIGITAL.CSIC (Spanish National Research Council (CSIC)) (submittedVersion, cc-by)
- DOAJ (DOAJ: Directory of Open Access Journals) (submittedVersion)
- DOAJ (DOAJ: Directory of Open Access Journals) (submittedVersion, cc-by-sa)
- Online Publication Service of Würzburg University (Würzburg University) (submittedVersion, cc-by)
- Repository for Publications and Research Data (ETH Zurich) (submittedVersion, cc-by)
- ETH Zürich Research Collection (cc-by)
- Funders
- European Molecular Biology Organization (GA-2013-609409, ALTF 721-2015, LTFCOFUND2013)
- Novartis Foundation (LTFCOFUND2013, GA-2013-609409)
- Bundesministerium für Bildung und Forschung (031A537B)
- Eidgenössische Technische Hochschule Zürich (PHRT 521)
- Novartis Stiftung für Medizinisch-Biologische Forschung
- Helmut Horten Stiftung
- German Network for Bioinformatics Infrastructure (031 A537B)
- Topics
- Life Sciences › Biochemistry, Genetics and Molecular Biology › Molecular Biology › Genomics and Phylogenetic Studies
- Physical Sciences › Environmental Science › Ecology › Microbial Community Ecology and Physiology
- Life Sciences › Biochemistry, Genetics and Molecular Biology › Molecular Biology › Gut microbiota and health
- Keywords
- operational taxonomic units, housekeeping genes, microbial community composition, single nucleotide variants, human microbiome, metagenomics
- MeSH terms
- Host Microbial Interactions, Algorithms, Genetic Markers, Humans, Phylogeny, Cluster Analysis, Sequence Alignment, Genome, Sequence Analysis, DNA, Computational Biology, Genes, Essential, Gene Expression Profiling, Metagenomics, Molecular Sequence Annotation, Microbiota
About these checks
Registry, retraction, Cites and statistics results are computed, not judged, with one exception: a printed reference that no index lists is read once by a model before it counts as a citation error. Claims are extracted by a model and kept only when their quote appears verbatim in the text; each cited source is then checked, with a model’s help, for whether it says what the claim relies on. Those verdicts can be wrong — read the claim’s quote and the cited source before relying on one.
Statistics and arithmetic are recomputed, not judged.
Confidence bands are shown only for fields calibrated on our annotated test set. None is calibrated yet, so no band is shown.
What counts as a claim ›How we measure confidence ›How we check this ›
Are you an author, or do you see a problem with this page? Request a review
