

The DOI matches its Crossref record; 82 of the 90 references it cites were found in a registry or an index.
G-quadruplex DNA drives genomic instability and represents a targetable molecular abnormality in ATRX-deficient malignant glioma
Open accessPublished version of a preprint
Abstract
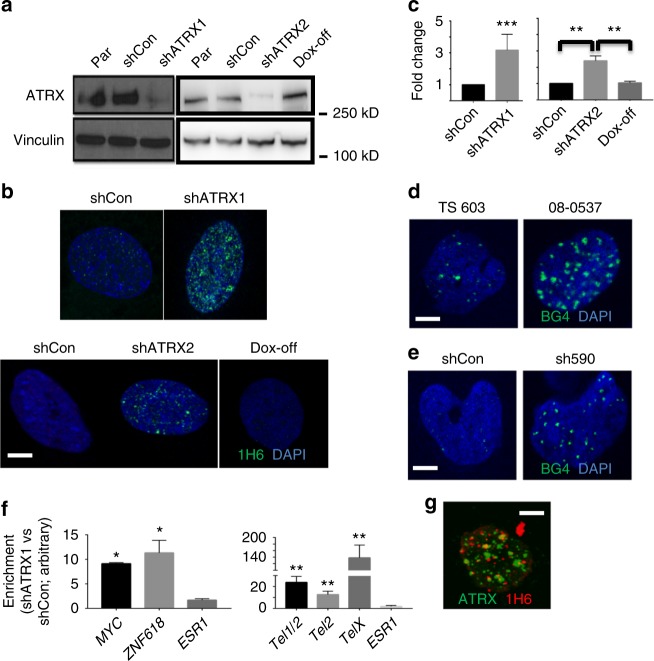
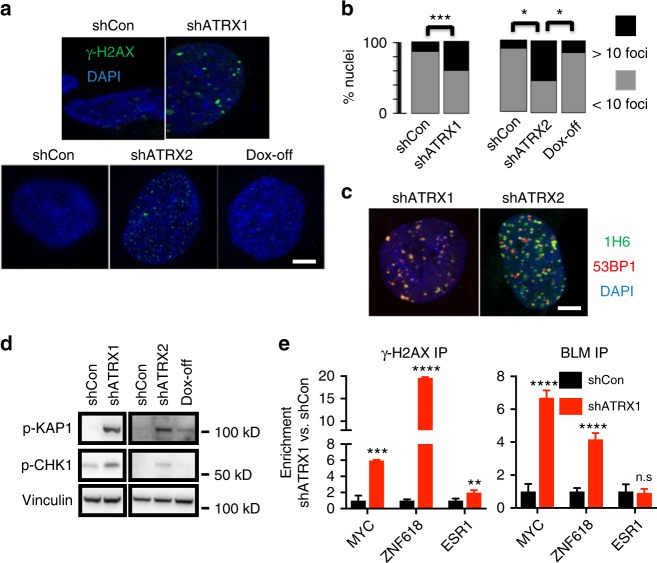
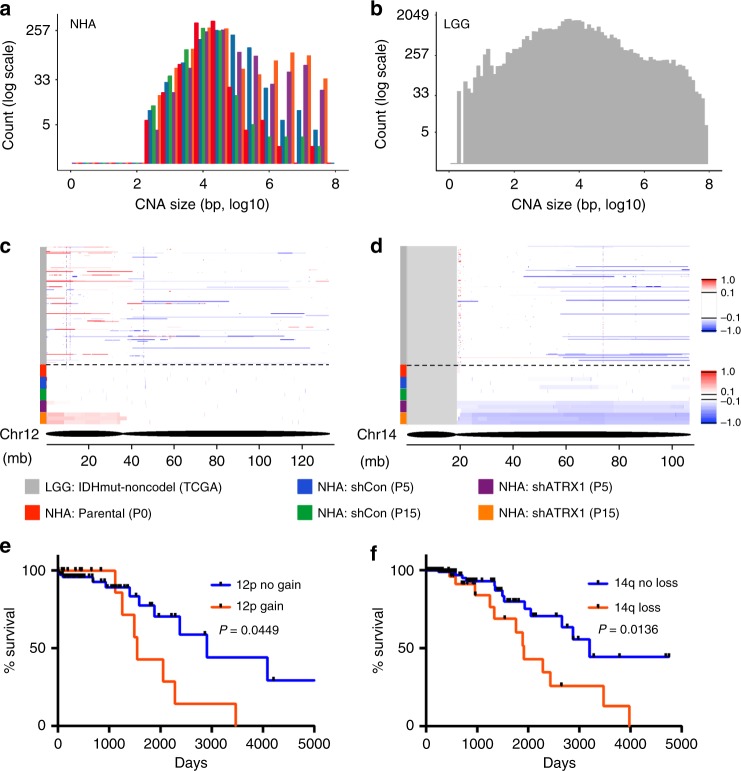
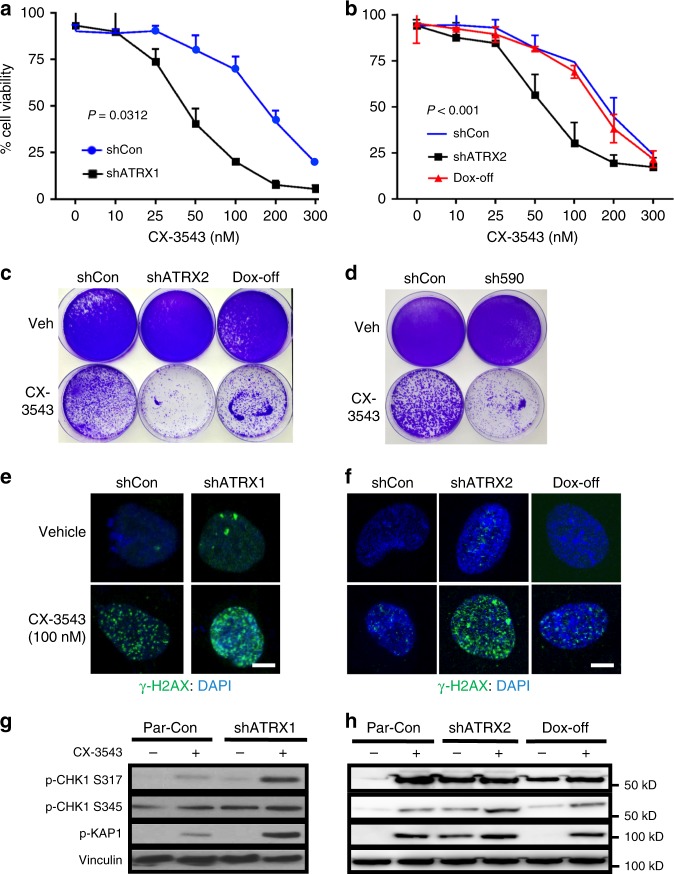
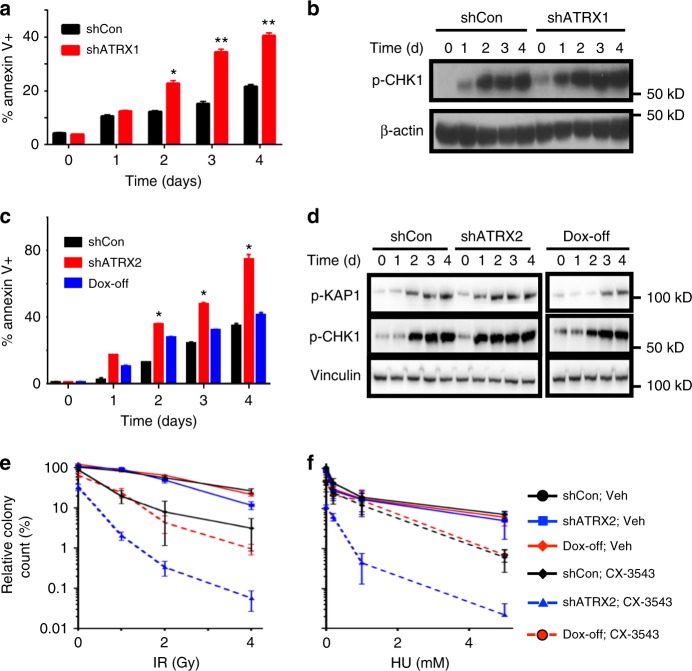
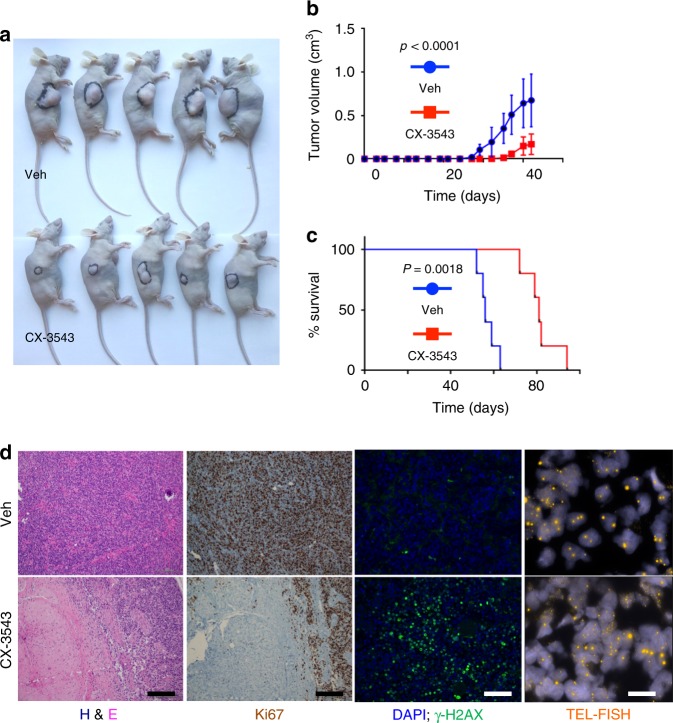
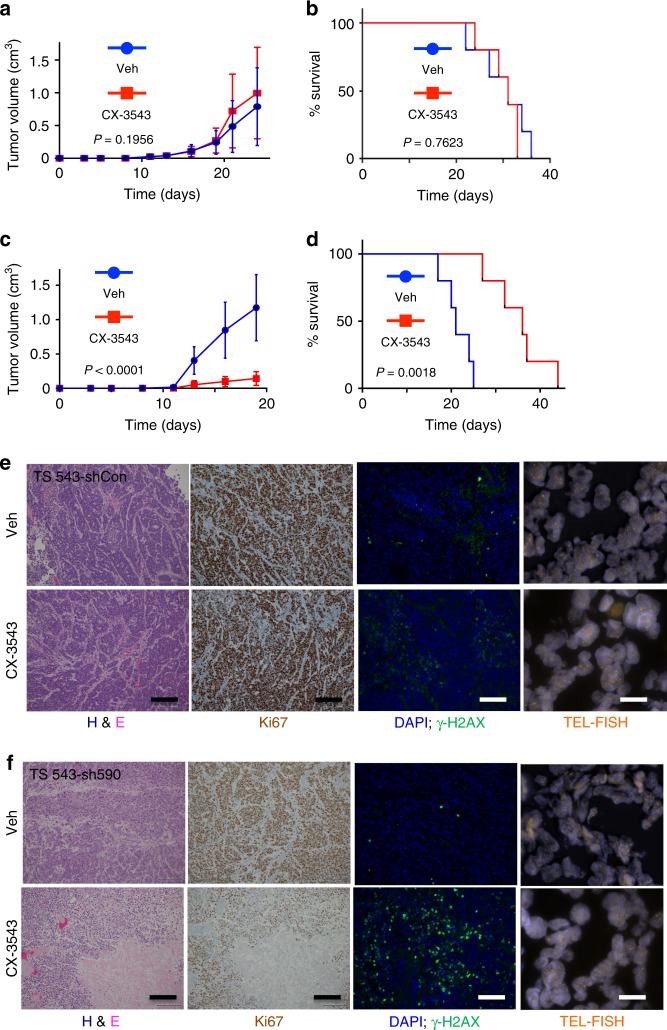
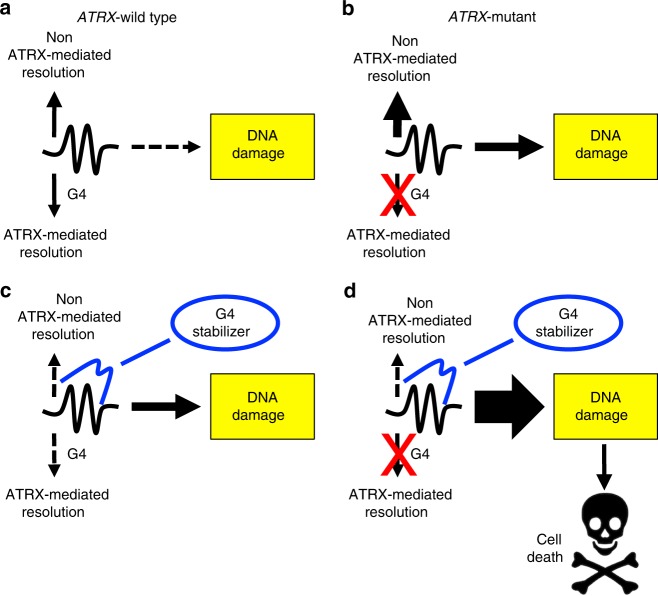
Mutational inactivation of ATRX (α-thalassemia mental retardation X-linked) represents a defining molecular alteration in large subsets of malignant glioma. Yet the pathogenic consequences of ATRX deficiency remain unclear, as do tractable mechanisms for its therapeutic targeting. Here we report that ATRX loss in isogenic glioma model systems induces replication stress and DNA damage by way of G-quadruplex (G4) DNA secondary structure. Moreover, these effects are associated with the acquisition of disease-relevant copy number alterations over time. We then demonstrate, both in vitro and in vivo, that ATRX deficiency selectively enhances DNA damage and cell death following chemical G4 stabilization. Finally, we show that G4 stabilization synergizes with other DNA-damaging therapies, including ionizing radiation, in the ATRX-deficient context. Our findings reveal novel pathogenic mechanisms driven by ATRX deficiency in glioma, while also pointing to tangible strategies for drug development.
Overview
The claims and statistics of this paper haven’t been checked yet.
Run the check — free, no account needed. It reads the open-access text and checks the sources it cites.
Integrity signals
Registry
Cites
Statistics
Figures
Verification
Claims the paper makes
The claims and statistics of this paper haven’t been checked yet.
Run the check — free, no account needed. It reads the open-access text and checks the sources it cites.
Claims other papers make about this one
Each is checked against this paper’s own text: does it say what the citing paper says it does?
The source backs part of the claim, not all of it — or backs it for a different population, condition or comparison.
In the citing paper
“there is strong evidence that deregulated G4-formation is a major driver of genomic instability”
From G-quadruplex-mediated genomic instability drives SNVs in cancer (2024) · cites this paper as [36]
Experimental — accuracy not yet measured
Self-check
Percentages, sums and reported differences re-computed from the paper’s own numbers.
The self-check needs the paper’s full text.
Citations
Cites
Connolly, F., Byrne, D., Lydon, S., Walsh, C., & O'Connor, P. (2017) · International Journal for Quality in Health Care · doi:10.1093/intqhc/mzx148 · Cited by 40,218
Telomere measurement by quantitative PCR
Cawthon, R. (2002) · Nucleic Acids Research · doi:10.1093/nar/30.10.e47 · Cited by 3,550
Comprehensive, Integrative Genomic Analysis of Diffuse Lower-Grade Gliomas
The Cancer Genome Atlas Research Network (2015) · New England Journal of Medicine · doi:10.1056/nejmoa1402121 · Cited by 3,148
Driver mutations in histone H3.3 and chromatin remodelling genes in paediatric glioblastoma
Schwartzentruber, J., Korshunov, A., Liu, X.-Y., Jones, D. T. W., Pfaff, E., Jacob, K., Sturm, D., Fontebasso, A. M., Quang, D.-A. K., Tönjes, M., et al. (2012) · Nature · doi:10.1038/nature10833 · Cited by 2,631
Glioblastoma and Other Malignant Gliomas
Omuro, A. M. P. (2013) · JAMA · doi:10.1001/jama.2013.280319 · Cited by 2,402
IDH1 mutation is sufficient to establish the glioma hypermethylator phenotype
Turcan, S., Rohle, D., Goenka, A., Walsh, L. A., Fang, F., Yilmaz, E., Campos, C., Fabius, A. W. M., Lu, C., Ward, P. S., et al. (2012) · Nature · doi:10.1038/nature10866 · Cited by 1,974
Self-citationTargeting G-quadruplexes in gene promoters: a novel anticancer strategy?
Balasubramanian, S., Hurley, L. H., & Neidle, S. (2011) · Nature Reviews Drug Discovery · doi:10.1038/nrd3428 · Cited by 1,720
Evaluation of BCNU and/or radiotherapy in the treatment of anaplastic gliomas
WALKER, M. D., Alexander, E., Hunt, W. E., MacCarty, C. S., Mahaley, M. S., Mealey, J., Norrell, H., Owens, G., Ransohoff, J., Wilson, C. B., et al. (1978) · Journal of neurosurgery · doi:10.3171/jns.1978.49.3.0333 · Cited by 1,684
WALKER, M. D., Green, S. B., Byar, D. P., Alexander, E., Batzdorf, U., Brooks, W. H., Hunt, W. E., MacCarty, C. S., Mahaley, M. S., Mealey, J., et al. (1980) · New England Journal of Medicine · doi:10.1056/nejm198012043032303 · Cited by 1,618
G-quadruplexes and their regulatory roles in biology
Rhodes, D., & Lipps, H. J. (2015) · Nucleic Acids Research · doi:10.1093/nar/gkv862 · Cited by 1,537
Cited by
Sorted by citations
Items 101–168 of 168
Brázda, V., Bohálová, N., & Bowater, R. (2021) · Gene · doi:10.1016/j.gene.2021.146058 · Cited by 12
Telomere Maintenance and DNA Repair: A Bidirectional Relationship in Cancer Biology and Therapy
Rembiałkowska, N., Sędzik, M., Kisielewska, M., Łuniewska, W., Sebastianka, K., Molik, K., Skinderowicz, K., Kuźnicki, J., Tunikowska, J., & Kulbacka, J. (2025) · Cancers · doi:10.3390/cancers17142284 · Cited by 12
“Moreover, the absence of ATRX/DAXX triggers recombination-based repair at telomeres, thereby contributing to therapeutic resistance in ALT-positive cancers-particularly noted in gliomas and sarcomas’ therapy where conventional methods are ineffective [37–39].”
Roles of G4-DNA and G4-RNA in Class Switch Recombination and Additional Regulations in B-Lymphocytes
Dézé, O., Laffleur, B., & Cogné, M. (2023) · Molecules · doi:10.3390/molecules28031159 · Cited by 15
“CX-5461 was also recently shown to decrease cell viability in ATRX-deficient glioma and BRCA1/BRCA2-deficient tumor cells [165,166].”
BackgroundShin, I., Park, Y., Sim, Y., Choi, S. H., Ahn, S., Chang, J.-H., Kim, S. H., Lee, S.-K., & Jain, R. (2024) · Acta Neuropathologica Communications · doi:10.1186/s40478-024-01832-w · Cited by 10
“…ATRX loss may also play a unique role in the manifestation of GC. ATRX loss is reported to be associated with genomic instability and DNA damage [29], with increased cellular motility and invasion [5, 18]; however, the underlying molecular pathway of this association with GC should be explored…”
BackgroundLiu, Z., Xu, X.-Y., Zhang, W., Zhang, L.-Q., Wen, M., Gao, J., Yang, J., Kan, Y., Yang, X., Wen, Z.-F., et al. (2024) · Quantitative Imaging in Medicine and Surgery · doi:10.21037/qims-23-807 · Cited by 10
“ATRX loss drives glioma-related biological behaviors by directly regulating chromatin structure and composition (27) and favors the malignant progression of gliomas (28).”
BackgroundSelf-citationATRX-Deficient High-Grade Glioma Cells Exhibit Increased Sensitivity to RTK and PDGFR Inhibitors
Pladevall‐Morera, D., Castejón-Griñán, M., Aguilera, P., Gaardahl, K., Ingham, A., Brosnan‐Cashman, J. A., Meeker, A. K., & Lopez-Contreras, A. J. (2022) · Cancers · doi:10.3390/cancers14071790 · Cited by 13
“Thus, loss of ATRX leads to increased genome instability manifested as elevated DSBs, increased CFS expression, and micronuclei formation [5,7,8], which can influence tumor progression and therapy response in cancer patients.”
BackgroundYan, J., Bu, L., Wang, Y., Yao, H., Li, G., Zheng, K., & Huang, J. (2025) · Nucleic Acids Research · doi:10.1093/nar/gkaf543 · Cited by 10
“While G4 resolution under physiological conditions helps maintain genomic stability, small molecules that stabilize G4s convert these transient structures into persistent replication and transcription barriers, leading to fork stalling, DNA damage, and genome instability [ 10 , 11 ].”
Self-citationTargeting base excision repair in precision oncology
Montaldo, N. P., Nilsen, H. L., & Bordin, D. L. (2025) · DNA repair · doi:10.1016/j.dnarep.2025.103844 · Cited by 10
Harnessing G-quadruplex ligands for lung cancer treatment: A comprehensive overview
Figueiredo, J., Djavaheri‐Mergny, M., Ferret, L., Mergny, J., & Cruz, C. (2023) · Drug Discovery Today · doi:10.1016/j.drudis.2023.103808 · Cited by 9
ATRX modulates the escape from a telomere crisis
Geiller, H. E. B., Harvey, A., Jones, R. E., Grimstead, J. W., Cleal, K., Hendrickson, E. A., & Baird, D. M. (2022) · PLoS Genetics · doi:10.1371/journal.pgen.1010485 · Cited by 11
Zhao, Z.-Z., Li, X.-R., Cui, Z., Tong, T., Zhang, Y., Zhang, Y.-P., Yang, X.-X., Keerthiga, R., Fu, C., & Fu, A. (2022) · Journal of Medicinal Chemistry · doi:10.1021/acs.jmedchem.1c01982 · Cited by 9
Wang, X.-D., Li, Z.-M., Liu, X.-Z., & Hu, M.-H. (2025) · Sensors and actuators. B, Chemical · doi:10.1016/j.snb.2025.138696 · Cited by 9
How DNA secondary structures drive replication fork instability
Sethi, A., Fernández-Casañas, M., Delpino, B., & Coster, G. (2025) · DNA repair · doi:10.1016/j.dnarep.2025.103913 · Cited by 7
TZAP overexpression induces telomere dysfunction and ALT-like activity in ATRX/DAXX-deficient cells
Moreno, S. P., Fusté, J. M., Kaiser, M., Li, J. S. Z., Nassour, J., Haggblom, C., Denchi, E. L., & Karlseder, J. (2023) · iScience · doi:10.1016/j.isci.2023.106405 · Cited by 8
“34,62 Interest-ingly, recent work provides evidence consistent with the idea that nucleosome positioning appears to be associated with the formation of specific DNA secondary structures, including G4s.”
Shelterin reduces the accessibility of telomeric overhangs
Shiekh, S. A., Jack, A., Saurabh, A., Mustafa, G., Kodikara, S. G., Gyawali, P., Hoque, M. E., Pressé, S., Yıldız, A., & Balci, H. (2022) · Nucleic Acids Research · doi:10.1093/nar/gkac1176 · Cited by 7
“There is growing evidence that GQ formation regulates essential cellular processes such as DNA replication, transcription, and translation (22,23), as well as its pivotal role in telomere maintenance (24).”
Transcription-Replication Collisions and Chromosome Fragility
Wu, W., He, J. N., Lan, M., Zhang, P., & Chu, W. K. (2021) · Frontiers in Genetics · doi:10.3389/fgene.2021.804547 · Cited by 9
“G4 is also known to obstruct DNA replication resulting in RS and genome instability (Wang et al., 2019).”
BackgroundSelf-citationHow do neurons live long and healthy? The mechanism of neuronal genome integrity
Ihara, D., Rasli, N. R., & Katsuyama, Y. (2025) · Frontiers in Neuroscience · doi:10.3389/fnins.2025.1552790 · Cited by 6
“The single-stranded DNA within R-loop is vulnerable to SSBs due to its susceptibility to nucleases (Allison and Wang, 2019).”
Resf1 is a compound G4 quadruplex-associated tumor suppressor for triple negative breast cancer
Majocha, M., Jackson, D. E., Ha, N., Amin, R., Pangrácová, M., Ross, C. R., Yang, H. H., Lee, M. P., & Hunter, K. W. (2024) · PLoS Genetics · doi:10.1371/journal.pgen.1011236 · Cited by 7
“In cancer, stabilized or induced G4s can lead to telomere maintenance issues [40,41,42], reduced oncogene expression [43,44,45], genome instability [21,46,47,48,49], or apoptosis [50,51,52].”
BackgroundImmunotherapy and targeted therapy for high grade gliomas: current and future directions
Hsueh, B., Steuart, S. J., Odukoya, A. O., Prager, B. C., Kim, Y. J., Hill, C. M., Choi, B. D., & Dunn, G. P. (2025) · Journal of Neuro-Oncology · doi:10.1007/s11060-025-05315-3 · Cited by 5
“ATRX is activated by DNA damage, pausing the cell cycle to facilitate repair of double-stranded DNA breaks [81–83 ].”
Yu, R., Huang, K., He, X., Zhang, J., Ma, Y., & Liu, H. (2025) · Medicine · doi:10.1097/md.0000000000041180 · Cited by 5
Mutant ATRX: pathogenesis of ATRX syndrome and cancer
Yuan, K., Tang, Y. H., Ding, Z., Peng, L., Zeng, J., Wu, H., & Yi, Q. (2024) · Frontiers in Molecular Biosciences · doi:10.3389/fmolb.2024.1434398 · Cited by 7
Single-Molecule Analysis of the Improved Variants of the G-Quadruplex Recognition Protein G4P
Gaur, P., Bain, F. E., Honda, M., Granger, S. L., & Spies, M. (2023) · International Journal of Molecular Sciences · doi:10.3390/ijms241210274 · Cited by 5
Sung, J., & Hwang, K. (2026) · MedComm · doi:10.1002/mco2.70693 · Cited by 3
Pang, Y., Cheng, M., Wang, J., Wang, R., Chen, X., Zhang, C., Yang, Y., Ji, T., Liu, M., Zhang, J., et al. (2025) · Nucleic Acids Research · doi:10.1093/nar/gkaf939 · Cited by 7
“Previous research has demonstrated that chemical stabilization of G4 induces replication stress at G4-prone genomic regions, resulting in DNA damage and apoptosis [ 38 , 39 ].”
Xu, F., Yu, D., Guo, J., Hu, J., Zhao, Y., Jiang, C., Meng, X., Cai, J., & Zhao, Y. (2025) · Mutation Research/Reviews in Mutation Research · doi:10.1016/j.mrrev.2025.108537 · Cited by 4
Knockdown of ATRX enhances radiosensitivity in glioblastoma
Zhao, Y., Chen, Y., Liu, R., Liu, M., You, N., Zhao, K., Zhang, J., & Xu, B. (2024) · Chinese Neurosurgical Journal · doi:10.1186/s41016-024-00371-6 · Cited by 4
“ATRX deficiency specifically amplifies DNA damage and cellular apoptosis both in vitro and in vivo [43].”
BackgroundQUFIND: tool for comparative prediction and mining of G4 quadruplexes overlapping with CpG islands
Kaur, B., Sharma, P., Arora, P., & Sood, V. (2023) · Frontiers in Genetics · doi:10.3389/fgene.2023.1265808 · Cited by 4
RAIDS atlas of significant genetic and protein biomarkers in cervical cancer
Scholl, S., Roufai, D. B., Chérif, L. L., & Kamal, M. T. (2023) · Journal of Gynecologic Oncology · doi:10.3802/jgo.2023.34.e74 · Cited by 4
“Cells derived from an ATRX LoF mouse glioma model were defective in NHEJ and more susceptible to DNA damaging treatments [63].”
BackgroundWang, Z., Liu, W., Guo-hu, L., Wang, J., Zhao, B., Huang, P., & Mei, W. (2023) · Molecules · doi:10.3390/molecules28041529 · Cited by 5
“chain, [Ru(phen)2(L1-(CH2)4-erianin)](ClO4)2 (L1 = 2-(2-(tri-fluoromethyphenyl))-imidazo [4,5f ][1– 10]phenanthroline (1) and [Ru(phen)2(L2-(CH2)4-eria)](ClO4)2 (L2 = 2-(4-(tri-fluoromethyphenyl))imidazo [4,5f ][1,10]phenanthroline (2), have been synthesized and investigated as a potential G-”
BackgroundYu, L., Zhang, Y.-S., Ding, C., & Shi, X. (2019) · Molecules · doi:10.3390/molecules24102015 · Cited by 4
Liew, D., Dharmatilleke, A. D., See, E., & Yong, E.-H. (2025) · Bioinform. · doi:10.1093/bioinformatics/btaf545 · Cited by 3
“G4s have emerged as potential therapeutic targets due to their biological relevance (Eversole and Maizels 2000, Sun et al. 2008, Wang et al. 2019).”
ATRX Promotes Transcription Initiation of HSV-1 Immediate Early Genes During Early Lytic Infection
Dunn, L. E. M., Clark, M. M., & Baines, J. D. (2025) · Viruses · doi:10.3390/v17091169 · Cited by 3
“Although ATRX knockdown increases G4 formation on cellular DNA [49,52,53], directly confirming a similar effect on the viral genome is experimentally challenging.”
De-Paula, R. B., Bacolla, A., Syed, A., & Tainer, J. A. (2024) · Journal of Biological Chemistry · doi:10.1016/j.jbc.2024.107822 · Cited by 3
Panda, S., Roychowdhury, T., Dutta, A., Chakraborty, S., Das, T., & Chatterjee, S. (2024) · bioRxiv · doi:10.1101/2024.02.01.578345 · Cited by 3
Malgulwar, P., Danussi, C., Dharmaiah, S., Johnson, W., Rao, A., & Huse, J. (2023) · bioRxiv · doi:10.1101/2023.01.09.523324 · Cited by 3
“ATRX deficiency also promotes replication stress and DNA damage, likely through accumulation of G-quadruplex DNA secondary structures genome-wide and modulates developmentally relevant transcriptional programs through dysregulated chromatin marks and epigenomic landscapes(11, 12, 15, 16).”
BackgroundMethodSelf-citationBazzicalupi, C., Bonardi, A., Biver, T., Ferraroni, M., Papi, F., Savastano, M., Lombardi, P., & Gratteri, P. (2022) · International Journal of Molecular Sciences · doi:10.3390/ijms232214061 · Cited by 4
Folding Stability of Pax9 Intronic G-Quadruplex Correlates with Relative Molar Size in Eutherians
Espejo, M. A. J., Hawkins, M. T. R., Fogalli, G. B., & Line, S. R. P. (2020) · Molecular Biology and Evolution · doi:10.1093/molbev/msaa331 · Cited by 4
“Besides, the presence of G4 motifs in loci with elevated recombination and rearrangements, such as telomeres, immunoglobulin switch regions, ribosomal DNA loci, and breakpoints associated with translocations and somatic copy number variations in malignant neoplastic processes (Katapadi et al. 2012; Bacolla et al. 2016…”
BackgroundNew Modified Deoxythymine with Dibranched Tetraethylene Glycol Stabilizes G-Quadruplex Structures
Tateishi‐Karimata, H., Ohyama, T., Muraoka, T., Tanaka, S., Kinbara, K., & Sugimoto, N. (2020) · Molecules · doi:10.3390/molecules25030705 · Cited by 5
“The non-canonical structure of the G-quadruplex is often associated with cancer and neurodegenerative disease [2,3].”
BackgroundSingle-stranded DNA structural diversity: TAGGGT from monomers to dimers to tetramer formation.
Porter, J., Chapagain, P., & Fernandez-Lima, F. (2019) · Rapid Communications in Mass Spectrometry · doi:10.1002/rcm.8367 · Cited by 3
Guerriau, C., Léonce, C., Carpentier, C., Mokhtari, K., Bielle, F., Dridi-Aloulou, A., Lomonte, P., Meyronet, D., Sanson, M., Castro‐Vega, L. J., et al. (2025) · Acta Neuropathologica Communications · doi:10.1186/s40478-025-02164-z · Cited by 2
“ATRX also contributes to telomere maintenance and replication, partly by regulating the formation and/or resolution of G-quadruplex structures (intramolecular rearrangements of the telomeric G-rich strand) [3] and R-loops [4] (RNA: DNA heteroduplexes).”
Lopina, O. D., Sidorenko, S. V., Fedorov, D. A., & Климанова, Е. А. (2024) · Biochemistry (Moscow) · doi:10.1134/s0006297924140153 · Cited by 6
“The G-quadruplex-induced increase in the rate of mutagenesis occurs mostly in the cells that have no functioning helicases unfolding G-quadruplexes (e.g., FANCJ, BLM) [62, 117, 118].”
Clynes, D., Goncalves, T., Kent, T., Shepherd, S., Cunniffe, S. M. T., Kim, S., Humphrey, T., & Gibbons, R. J. (2021) · Research Square · doi:10.21203/rs.3.rs-362334/v1 · Cited by 3
Télomères et télomérase : des cibles toujours pertinentes en oncologie ?
Mergny, J., Guittat, L., & Ségal-Bendirdjian, É. (2020) · Bulletin du Cancer · doi:10.1016/j.bulcan.2020.10.007 · Cited by 2
“…: les cellules carencées en ATRX forment plus de ces structures, et l’on observe une augmentation des dommages à l'ADN et de la mort cellulaire induite par des ligands G4, ainsi qu’une une synergie entre ces ligands et d'autres traitements endommageant l’ADN dans ces mêmes cellules [Wang 2019].”
BackgroundFrasson, I., Soldà, P., Nadai, M., Lago, S., & Richter, S. (2020) · bioRxiv · doi:10.1101/2020.07.14.202747 · Cited by 2
“G4 folded/unfolded state modulates numerous processes, including replication, transcription, translation and can trigger genomic instability (Gray et al., 2014; Hänsel-Hertsch et al., 2017; Prorok et al., 2019; Wang et al., 2019).”
BackgroundGiangaspero, F., Minasi, S., Gianno, F., Alzoubi, H., Antonelli, M., & Buttarelli, F. R. (2020) · Glioma · doi:10.4103/glioma.glioma_20_20 · Cited by 3
“[181-183] At present, two of these G4 stabilizers reached the stage of clinical trial: CX-3543 (at phase 2) for several tumors, including neuroendocrine tumors, carcinoid tumors, and lymphoma, and CX-5461 (at phase 1) for patients with BRCA1/2-deficient tumors.[183] However, the application of these ligands in ALT-pos…”
BackgroundHuang, Z., Jiang, T., Palacios, M. M. S., Ouyang, T., Abdallah, A. S., Niu, L., Chen, J., Zhai, X., Ciolak, E., Qiang, W., et al. (2026) · Cancer Letters · doi:10.1016/j.canlet.2026.218771 · Cited by 1
Chen, Y.-L., Liu, Y., Xu, Y., Yang, A.-Q., Chen, G.-J., Xing, J.-S., Su, H.-W., & Liao, L.-S. (2024) · World Journal of Oncology · doi:10.14740/wjon1754 · Cited by 1
Koneru, B., Farooqi, A., Nguyen, T., Chen, W.-H., Hindle, A., Eslinger, C., Makena, M., Burrow, T. A., Wilson, J., Smith, A., et al. (2021) · bioRxiv · doi:10.1101/2021.04.06.438692 · Cited by 1
“ALT tumors (16-19), but none of these ALT specific therapeutic strategies have yet translated into 19 the clinic.”
BackgroundA strike against indolent neuroblastoma
Cook, A., & Bernstein, E. (2020) · EBioMedicine · doi:10.1016/j.ebiom.2020.103000 · Cited by 1
“This includes the regulation of repetitive DNA such as pericentric and telomeric heterochromatin [7,8], G-quadruplex structures [9], and relevant to this study, various aspects of the DNA damage response [10].”
BackgroundRoy, S., Pradhan, A., & Jainarayanan, A. K. (2026) · Frontiers in Neural Circuits · doi:10.3389/fncir.2026.1893836
“…mutations in the chromatin remodeler ATRX, which normally helps resolve G4 structures, lead to reversible G4 accumulation at GC-rich loci, replication-fork stalling, and DNA damage that drives the copy-number alterations characteristic of ATRX-deficient malignant glioma (Wang et al., 2019).”
Divergent genomic evolution in astrocytomas and oligodendrogliomas
Chowdhury, T., Tesileanu, C. M. S., Kocakavuk, E., Johnson, K. C., Lee, J. H., Erson-Omay, Z., Heo, C., Aldape, K., Amin, S. B., Anderson, K. J., et al. (2026) · Nature · doi:10.1038/s41586-026-11150-x · Cited by 7
Self-citationReplication stress in cancer: origins, consequences and therapeutic opportunities
Chen, J., & Zou, L. (2026) · Nature reviews. Cancer · doi:10.1038/s41568-026-00979-z · Cited by 2
Telomeric Replication Stress Promotes ALT-Associated Hallmarks in ATRX- and p53-Deficient Cells
Amato, R., Micheli, E., Focaccetti, C., Bei, R., Rosa, P. L., Sgura, A., & Berardinelli, F. (2026) · Frontiers in Bioscience-Landmark · doi:10.31083/fbl52954
Revealing G4 Structures as Drug Targets: Exploring the Potential of Novel Therapeutic Agents
Che, Y., Peng, Y., Pan, X., Hu, X.-Y., Zhao, Y.-T., Zhao, Y., Tian, C., Yuan, M., Yin, Y., Gan, R., et al. (2026) · Research · doi:10.34133/research.1363
“Similarly, defects in the alpha thalassemia/mental retardia syndrome x-linked (ATRX) [ 91 ] or Fanconi anemia complementation group J (FANCJ) helicase [ 86 ] stabilize DNA G4 structures, inducing replication stress, DNA damage, and subsequent apoptosis in cancer cell.”
Malgulwar, P., Singh, A. K., Saw, A., Danussi, C., Dharmaiah, S., Johnson, W. E., Machado, A. A., Barathi, B. B., Raman, A., Satpati, S., et al. (2026) · Nucleic Acids Research · doi:10.1093/nar/gkag644
“As we and others have reported, ATRX deficiency exerts significant effects on genomic stability [ 42 –45 ], telomere maintenance [ 13 , 46 ], and cellular differentiation [ 15 , 16 , 28 , 47 ], all of which likely contribute to oncogenesis in multiple tumor types, including malignant glioma.”
Self-citationXu, L., Li, F., Wen, N., Wu, C., Zhu, A., Hou, Y., Wang, W., Zhao, Y., Zheng, H., & Zhang, L. (2026) · Cellular Signalling · doi:10.1016/j.cellsig.2026.112569
Shen, Y., Gupta, K., Tan‐Wong, S. M., Wen, S., Fisher, C. A., Tamon, L., Proudfoot, N. J., Gibbons, R. J., & Higgs, D. R. (2026) · Nature Communications · doi:10.1038/s41467-026-69169-7
“ATRX is enriched at such transcribed G-rich loci, whereits lossresults inincreased G4 and R-loop accumulation 31,42 .”
Trejo-Lopez, J. A., Mendoza, C., Kollmeyer, T., Drucker, K., Pazdernik, V. M., Decker, P., Praska, C. E., Hardcastle, J., Smoley, S., Isaacson, M., et al. (2026) · Brain Pathology · doi:10.1111/bpa.70076
Mechanistic insights into chromatin modulation by the “orphan” remodeler ATRXPreprint
Duan, S.-L., Wong, T.-F., Yang, X.-R., Xi, H.-M., Zhao, Y.-X., Yao, Z.-P., Zhai, Y.-L., Liao, J.-Y., Ni, T., Zhou, K.-D., et al. (2026) · bioRxiv · doi:10.64898/2026.01.04.697590
Sawangsri, P., Limsirichaikul, S., Takeuchi, T., Mizutani, Y., Tran, D. Q., Kajino, T., Suzuki, M., & Niimi, A. (2025) · Fujita medical journal · doi:10.20407/fmj.2025-017
Segura‐Bayona, S., Maric, M., Takaki, T., Manova, Z., Stanage, T. H., Idilli, A. I., Idilli, A. I., Hewitt, G., Machour, F. E., Millar, R., et al. (2026) · Nature Structural & Molecular Biology · doi:10.1038/s41594-026-01827-2 · Cited by 2
“3 at euchromatic regulatory elements, such as CpG islands 35 , and suppresses spurious transcription and replication stress in heterochromatin 36–39 .”
Amaral, E. D. O. S., Espejo, M. A. J., & Line, S. R. P. (2024) · Journal of Mammalian Evolution · doi:10.1007/s10914-024-09719-2 · Cited by 1
“…also involved in key events, such as DNA replication (Valton and Prioleau 2016; Prorok et al. 2019), progression of replication forks (Bryan 2019; Wang et al. 2019), translation (Huppert et al. 2008; Bugaut and Balasubramanian 2012), telomere elongation and maintenance (Wang et al. 2011; Moye et…”
Single-molecule analysis of the improved variants of the G-quadruplex recognition protein G4P
Gaur, P., Bain, F. E., Honda, M., Granger, S. L., & Spies, M. (2023) · bioRxiv · doi:10.1101/2023.05.08.539902
Interplay between ATRXand IDH1 mutations governs innate immune responses in diffuse gliomas
Hariharan, S., Whitfield, B., Pirozzi, C. J., Waitkus, M. S., Brown, M. C., Bowie, M. L., Irvin, D. M., Roso, K., Fuller, R. D., Hostettler, J., et al. (2023) · bioRxiv · doi:10.1101/2023.04.20.537594
Self-citationImpact of Shelterin Complex on Telomere Accessibility
Shiekh, S. A., Jack, A., Mustafa, G., Kodikara, S. G., Gyawali, P., Hoque, M., Yildiz, A., & Balci, H. (2022) · bioRxiv · doi:10.1101/2022.05.24.493289
Yuan, M., Eberhart, C., Pratilas, C., Blakeley, J., Davis, C., Stojanova, M., Reilly, K. M., Meeker, A., Heaphy, C., & Rodriguez, F. (2022) · bioRxiv · doi:10.1101/2022.02.03.479021
“Functional loss of ATRX leads to G-quadruplex (G4) DNA secondary structures as a result of replication stress in glioma models (33).”
BackgroundEspejo, M. A. J., & Line, S. R. P. (2020) · bioRxiv (Cold Spring Harbor Laboratory) · doi:10.1101/2020.08.28.272971
Computational Analysis of Breast Cancer Sequences using Next Generation Sequencing Methods in Julia
Kurian, B., & Jyothi, V. (2019) · Procedia Computer Science · doi:10.1016/j.procs.2020.01.052
Metadata
- Authors
- Wang, Y., Yang, J., Wild, A. T., Wu, W. H., Shah, R., Danussi, C., Riggins, G. J., Kannan, K., Sulman, E. P., Chan, T. A., & Huse, J. T.
- Affiliations
- Memorial Sloan Kettering Cancer Center (US)
- The University of Texas MD Anderson Cancer Center (US)
- Johns Hopkins University (US)
- New York University (US)
- Corresponding author
- Huse, Jason T.
- ORCID
- Venue
- Nature Communications
- Published
- 2019-02-26
- Volume
- 10
- Issue
- 1
- Pages
- 943-943
- ISSN
- 2041-1723 (ISSN-L)
- PMC
- PMC6391399
- OpenAlex
- W2950531883
- Cited by
- 184
- References
- 90
- Citations by year
- 2026: 11 · 2025: 16 · 2024: 21 · 2023: 24 · 2022: 34 · 2021: 35 · 2020: 31 · 2019: 11
- FWCI
- 9.18
- Type
- journal article
- Language
- en
- Open access
- gold
- doi.org
- Locations
- Nature Communications (publishedVersion, cc-by)
- bioRxiv (Cold Spring Harbor Laboratory) (acceptedVersion, cc-by-nc-nd)
- Europe PMC (PubMed Central) (publishedVersion, other-oa)
- PubMed Central (publishedVersion, cc-by)
- PubMed (publishedVersion)
- RePEc: Research Papers in Economics (submittedVersion)
- DOAJ (DOAJ: Directory of Open Access Journals) (submittedVersion)
- DOAJ (DOAJ: Directory of Open Access Journals) (submittedVersion, cc-by-sa)
- Funders
- American Cancer Society (RSG-16-179-01- DMC)
- Sontag Foundation
- Memorial Sloan-Kettering Cancer Center (P30-CA08748)
- Sidney Kimmel Foundation
- Cycle for Survival
- National Institutes of Health (CA- 016672, CA08748)
- National Cancer Institute (CA 016672, P30-CA-08748, CA08748, P30CA008748, P30CA016672)
- Topics
- Life Sciences › Biochemistry, Genetics and Molecular Biology › Molecular Biology › DNA and Nucleic Acid Chemistry
- Health Sciences › Medicine › Oncology › Glioma Diagnosis and Treatment
- Life Sciences › Biochemistry, Genetics and Molecular Biology › Molecular Biology › DNA Repair Mechanisms
- Keywords
- high-grade glioma, G-quadruplex, genomic instability, replication stress, DNA damage, copy number alterations, G-quadruplex stabilization, ionizing radiation, combination therapy, therapeutic targeting
- MeSH terms
- X-linked Nuclear Protein, Animals, Brain Neoplasms, DNA Damage, DNA Replication, DNA, Neoplasm, Glioma, Humans, Mice, Nude, Mutation, Genomic Instability, Cell Line, Tumor, Mice, G-Quadruplexes, Gene Knockdown Techniques, DNA Copy Number Variations, Heterografts
About these checks
Registry, retraction, Cites and statistics results are computed, not judged, with one exception: a printed reference that no index lists is read once by a model before it counts as a citation error. Claims are extracted by a model and kept only when their quote appears verbatim in the text; each cited source is then checked, with a model’s help, for whether it says what the claim relies on. Those verdicts can be wrong — read the claim’s quote and the cited source before relying on one.
Statistics and arithmetic are recomputed, not judged.
Confidence bands are shown only for fields calibrated on our annotated test set. None is calibrated yet, so no band is shown.
What counts as a claim ›How we measure confidence ›How we check this ›
Are you an author, or do you see a problem with this page? Request a review
