

Lineage tracing using a Cas9-deaminase barcoding system targeting endogenous L1 elements
Open accessPublished version of a preprint
The DOI matches its Crossref record; 33 of the 33 references it cites were found in a registry or an index.
Abstract
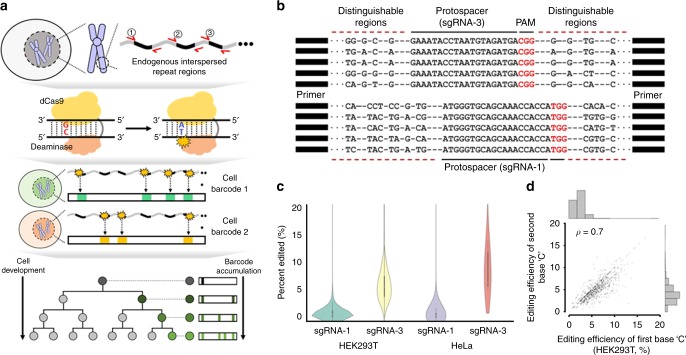
Determining cell lineage and function is critical to understanding human physiology and pathology. Although advances in lineage tracing methods provide new insight into cell fate, defining cellular diversity at the mammalian level remains a challenge. Here, we develop a genome editing strategy using a cytidine deaminase fused with nickase Cas9 (nCas9) to specifically target endogenous interspersed repeat regions in mammalian cells. The resulting mutation patterns serve as a genetic barcode, which is induced by targeted mutagenesis with single-guide RNA (sgRNA), leveraging substitution events, and subsequent read out by a single primer pair. By analyzing interspersed mutation signatures, we show the accurate reconstruction of cell lineage using both bulk cell and single-cell data. We envision that our genetic barcode system will enable fine-resolution mapping of organismal development in healthy and diseased mammalian states.
Overview
The claims and statistics of this paper haven’t been checked yet.
Free: it reads the open-access text and checks the first 5 claims that cite a source we can check. Create a free account to check every claim.
Integrity signals
Registry
Cites
Statistics
Figures


Verification
Claims the paper makes
The claims and statistics of this paper haven’t been checked yet.
Free: it reads the open-access text and checks the first 5 claims that cite a source we can check. Create a free account to check every claim.
Claims other papers make about this one
Each is checked against this paper’s own text: does it say what the citing paper says it does?
The source backs part of the claim, not all of it — or backs it for a different population, condition or comparison.
In the citing paper
“In fact, usage of a modified CRISPR-cas9 system has been expanded beyond genome editing, to RNA targeting, chromatin topology, chromatin imaging, and developmental trajectories as well as to lineage tracing (188, 304).”
From Epigenetic Modifications in Stress Response Genes Associated With Childhood Trauma (2019) · cites this paper as [304]
Experimental — accuracy not yet measured
Self-check
Percentages, sums and reported differences re-computed from the paper’s own numbers.
The self-check needs the paper’s full text.
Citations
Cites
A Programmable Dual-RNA–Guided DNA Endonuclease in Adaptive Bacterial Immunity
Jinek, M., Chylinski, K., Fonfara, I., Hauer, M., Doudna, J. A., & Charpentier, E. (2012) · Science · doi:10.1126/science.1225829 · Cited by 17,116
Multiplex Genome Engineering Using CRISPR/Cas Systems
Cong, L., Ran, F. A., Cox, D., Lin, S., Barretto, R., Habib, N., Hsu, P. D., Wu, X., Jiang, W., Marraffini, L. A., et al. (2013) · Science · doi:10.1126/science.1231143 · Cited by 15,339
Genome engineering using the CRISPR-Cas9 system
Ran, F. A., Hsu, P. D., Wright, J., Agarwala, V., Scott, D. A., & Zhang, F. (2013) · Nature Protocols · doi:10.1038/nprot.2013.143 · Cited by 11,133
Programmable editing of a target base in genomic DNA without double-stranded DNA cleavage
Komor, A. C., Kim, Y. B., Packer, M. S., Zuris, J. A., & Liu, D. R. (2016) · Nature · doi:10.1038/nature17946 · Cited by 5,437
Cpf1 Is a Single RNA-Guided Endonuclease of a Class 2 CRISPR-Cas System
Zetsche, B., Gootenberg, J. S., Abudayyeh, O. O., Slaymaker, I. M., Makarova, K. S., Essletzbichler, P., Volz, S. E., Joung, J., van der Oost, J., Regev, A., et al. (2015) · Cell · doi:10.1016/j.cell.2015.09.038 · Cited by 4,761
Programmable base editing of A•T to G•C in genomic DNA without DNA cleavage
Gaudelli, N. M., Komor, A. C., Rees, H. A., Packer, M. S., Badran, A. H., Bryson, D. I., & Liu, D. R. (2017) · Nature · doi:10.1038/nature24644 · Cited by 4,184
CRISPR-Cas systems for editing, regulating and targeting genomes
Sander, J. D., & Joung, J. K. (2014) · Nature Biotechnology · doi:10.1038/nbt.2842 · Cited by 3,153
In vivo genome editing using Staphylococcus aureus Cas9
Ran, F. A., Cong, L., Yan, W. X., Scott, D. A., Gootenberg, J. S., Kriz, A. J., Zetsche, B., Shalem, O., Wu, X., Makarova, K. S., et al. (2015) · Nature · doi:10.1038/nature14299 · Cited by 2,687
Rationally engineered Cas9 nucleases with improved specificity
Slaymaker, I. M., Gao, L., Zetsche, B., Scott, D. A., Yan, W. X., & Zhang, F. (2016) · Science · doi:10.1126/science.aad5227 · Cited by 2,414
Dynamic Imaging of Genomic Loci in Living Human Cells by an Optimized CRISPR/Cas System
Chen, B., Gilbert, L. A., Cimini, B. A., Schnitzbauer, J., Zhang, W., Li, G.-W., Park, J., Blackburn, E. H., Weissman, J. S., Qi, L. S., et al. (2013) · Cell · doi:10.1016/j.cell.2013.12.001 · Cited by 1,963
Cited by
Lineage tracing meets single-cell omics: opportunities and challenges
Wagner, D. E., & Klein, A. M. (2020) · Nature Reviews Genetics · doi:10.1038/s41576-020-0223-2 · Cited by 646
CRISPR in cancer biology and therapy
Katti, A., Diaz, B. J., Caragine, C. M., Sanjana, N. E., & Dow, L. E. (2022) · Nature Reviews Cancer · doi:10.1038/s41568-022-00441-w · Cited by 424
Integrating genetic and non-genetic determinants of cancer evolution by single-cell multi-omics
Nam, A. S., Chaligne, R., & Landau, D. A. (2021) · Nature Reviews Genetics · doi:10.1038/s41576-020-0265-5 · Cited by 378
Epigenetic Modifications in Stress Response Genes Associated With Childhood Trauma
Jiang, S., Postovit, L., Cattaneo, A., Binder, E. B., & Aitchison, K. J. (2019) · Frontiers in Psychiatry · doi:10.3389/fpsyt.2019.00808 · Cited by 288
Aging and Rejuvenation of Neural Stem Cells and Their Niches
Navarro Negredo, P., Yeo, R. W., & Brunet, A. (2020) · Cell Stem Cell · doi:10.1016/j.stem.2020.07.002 · Cited by 246
Metadata
- Authors
- Hwang, B., Lee, W., Yum, S.-Y., Jeon, Y., Cho, N., Jang, G., & Bang, D.
- Affiliations
- Yonsei University (KR)
- Seoul National University (KR)
- Corresponding author
- Jang, Goo
- Bang, Duhee
- Venue
- Nature Communications
- Published
- 2019-03-15
- Volume
- 10
- Issue
- 1
- Pages
- 1234-1234
- ISSN
- 2041-1723 (ISSN-L)
- PMC
- PMC6420643
- OpenAlex
- W2949307008
- Cited by
- 65
- References
- 32
- Citations by year
- 2026: 9 · 2025: 8 · 2024: 13 · 2023: 6 · 2022: 8 · 2021: 7 · 2020: 9 · 2019: 5
- FWCI
- 2.39
- Type
- journal article
- Language
- en
- Open access
- gold
- doi.org
- Licence
- cc-by
- creativecommons.org/licenses/by/4.0 (tdm)
- creativecommons.org/licenses/by/4.0 (vor)
- Locations
- Nature Communications (publishedVersion, cc-by)
- bioRxiv (Cold Spring Harbor Laboratory) (acceptedVersion, cc-by-nc-nd)
- Europe PMC (PubMed Central) (publishedVersion, cc-by)
- PubMed Central (publishedVersion, cc-by)
- PubMed (publishedVersion)
- RePEc: Research Papers in Economics (submittedVersion)
- DOAJ (DOAJ: Directory of Open Access Journals) (submittedVersion, cc-by-sa)
- DOAJ (DOAJ: Directory of Open Access Journals) (submittedVersion)
- Funders
- National Research Foundation
- National Research Foundation of Korea (2018R1A2A1A05079172, NRF-2018M3A9H3024850, 2016M3A9B6948494, NRF-2018R1A2A1A05079172, 2018M3A9H3024850, 2015R1A2A1A10055972, NRF-2016M3A9B6948494)
- Ministry of Science and ICT, South Korea (2018R1A2A1A05079172, 2016M3A9B6948494)
- Topics
- Life Sciences › Biochemistry, Genetics and Molecular Biology › Molecular Biology › CRISPR and Genetic Engineering
- Life Sciences › Biochemistry, Genetics and Molecular Biology › Molecular Biology › Single-cell and spatial transcriptomics
- Life Sciences › Biochemistry, Genetics and Molecular Biology › Molecular Biology › RNA regulation and disease
- Keywords
- lineage tracing, LINE-1 retrotransposons, endogenous retrotransposons, cytidine deaminase, DNA barcoding, targeted mutagenesis, single guide RNA, interspersed repeats, cell fate mapping, mammalian development
- MeSH terms
- Gene Editing, CRISPR-Associated Protein 9, RNA, Guide, CRISPR-Cas Systems, Cell Differentiation, Cytidine Deaminase, HeLa Cells, Humans, Mutagenesis, Cell Lineage, Long Interspersed Nucleotide Elements, HEK293 Cells, DNA Barcoding, Taxonomic, Time-Lapse Imaging, Single-Cell Analysis
About these checks
Registry, retraction, Cites and statistics results are computed, not judged, with one exception: a printed reference that no index lists is read once by a model before it counts as a citation error. Claims are extracted by a model and kept only when their quote appears verbatim in the text; each cited source is then checked, with a model’s help, for whether it says what the claim relies on. Those verdicts can be wrong — read the claim’s quote and the cited source before relying on one.
Statistics and arithmetic are recomputed, not judged.
Confidence bands are shown only for fields calibrated on our annotated test set. None is calibrated yet, so no band is shown.
What counts as a claim ›How we measure confidence ›How we check this ›
Are you an author, or do you see a problem with this page? Request a review
How to cite
Cite CoChat for the checks on this page, and the paper for its own findings.
- This page
- CoChat. (2026). Citation check: Lineage tracing using a Cas9-deaminase barcoding system targeting endogenous L1 elements. https://app.cochat.ai/papers/10.1038/s41467-019-09203-z
- The paper
- Hwang, B., Lee, W., Yum, S.-Y., Jeon, Y., Cho, N., Jang, G., & Bang, D. (2019). Lineage tracing using a Cas9-deaminase barcoding system targeting endogenous L1 elements. Nature Communications. https://doi.org/10.1038/s41467-019-09203-z
Data sources
Bibliographic data: Semantic Scholar, OpenAlex, Crossref.
Contains information from the Semantic Scholar Academic Graph Datasets, made available under the ODC Attribution License (ODC-BY 1.0).
Semantic Scholar’s data is described in: Kinney, R., et al. (2023). The Semantic Scholar Open Data Platform. arXiv:2301.10140.
